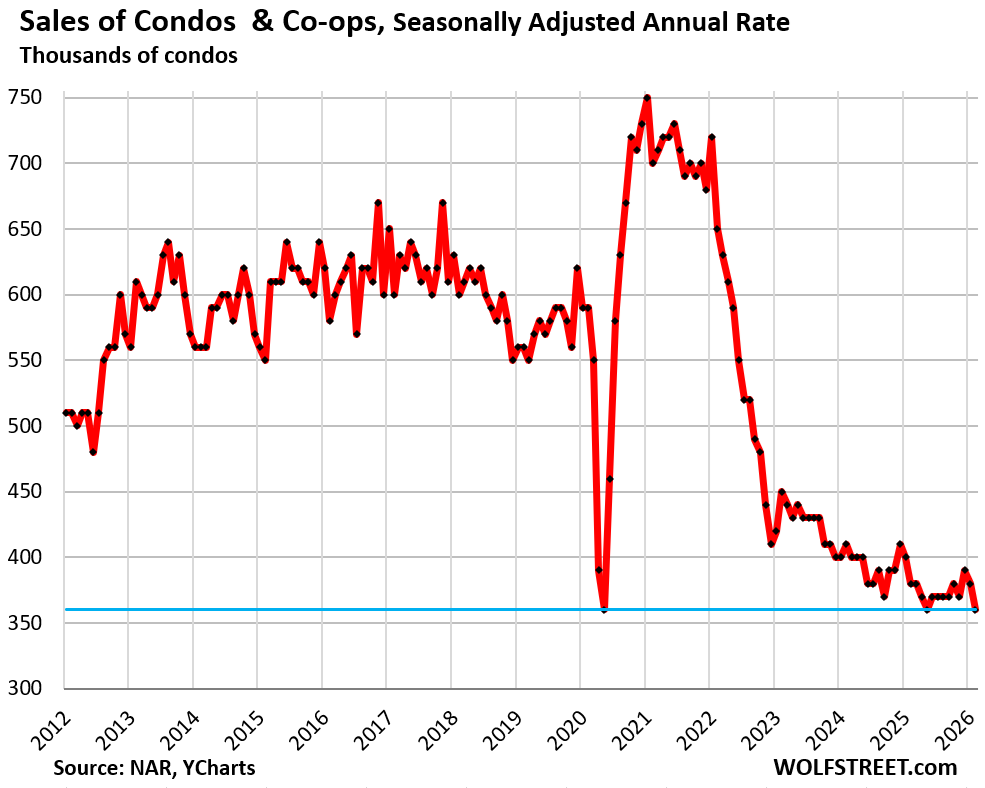
Condo sales plunged to near-record lows.
By Wolf Richter for WOLF STREET.
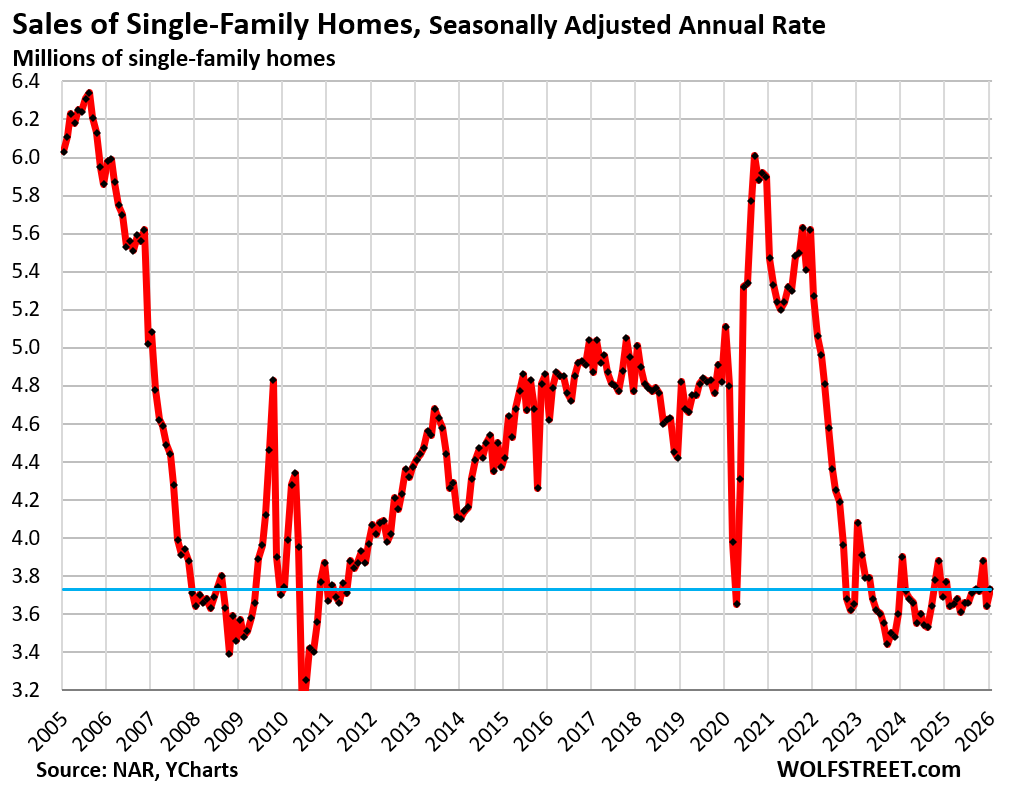
Sales of existing single-family homes that closed in February ticked up seasonally adjusted from January by 2.5%, making up only a small portion of the 6.2% plunge in January from December, to an annual rate of 3.73 million sales, right along at the deepfreeze levels that began in 2022, according to data by the National Association of Realtors today.
Compared to February in (historical data from YCharts):
- 2025: -1.1% (year-over-year)
- 2024: -4.4%
- 2023: -8.6%
- 2022: -29.2%
- 2021: -31.8%
- 2019: -22.6%
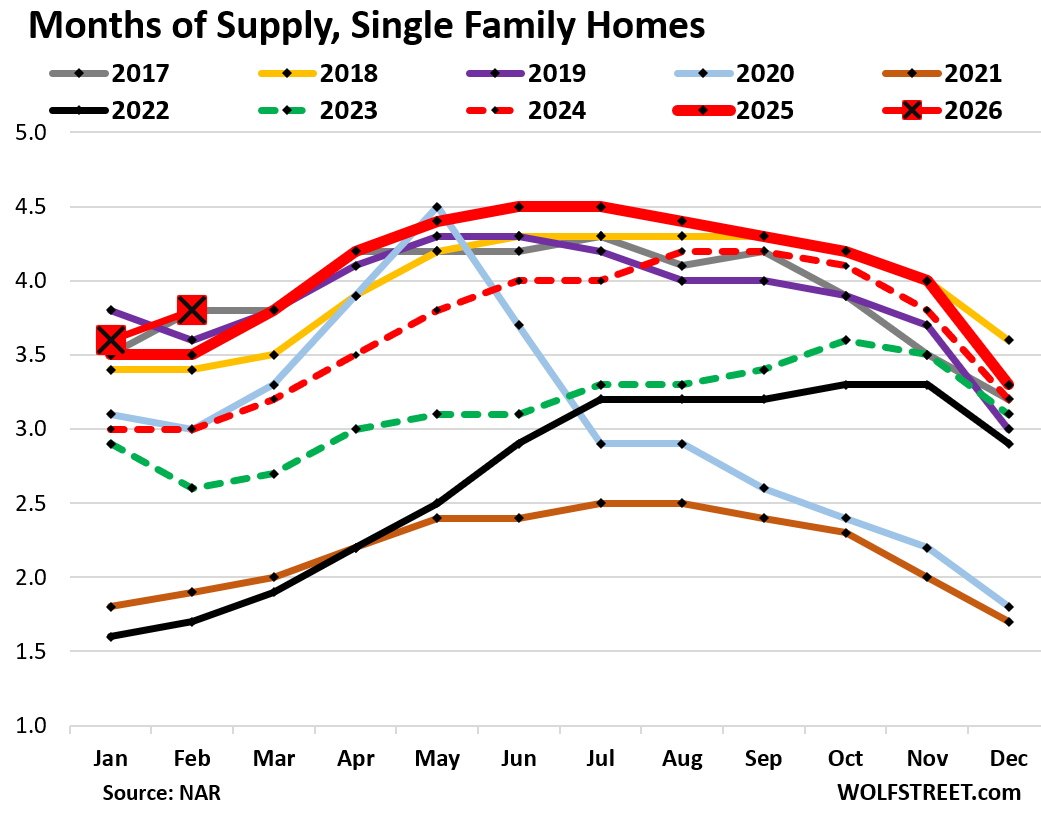
But supply of single-family homes jumped to 3.8 months in February (red line with big red square in the chart below), the highest supply for February since 2017, also 3.8 months.
In February a year ago, supply was 3.5 months. The fat red line without boxes shows the year 2025, which had marked the high end for supply in that time range going back to 2017 (historical data from YCharts).
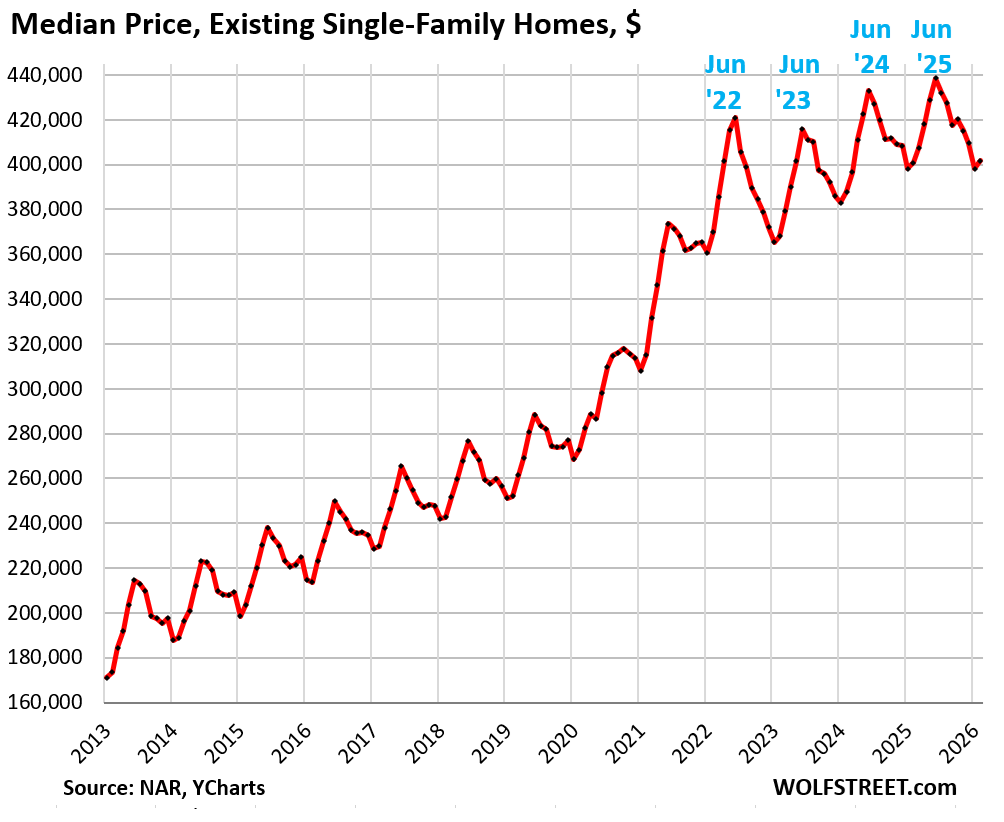
The national median price of single-family homes, not seasonally adjusted, edged up by 0.2% year-over-year. It has now been nearly unchanged year-over-year for the past three months (0.2%, 0.0%, 0.2%).
The median price had exploded by 41% from June 2020 through June 2022, from already high prices. Those too-high prices (what NAR calls “affordability issues”) are a big factor why the housing market has frozen up since then.
The median price is not seasonally adjusted. And it’s very seasonal, rising and falling with the shift in inventories and sales, as a larger share of more expensive homes come on the market and sell in the spring, thereby changing the mix of what sold, and shifting the median price up through June. In the second half of the year, the mix reverts, and the median price drops and bottoms out in January.
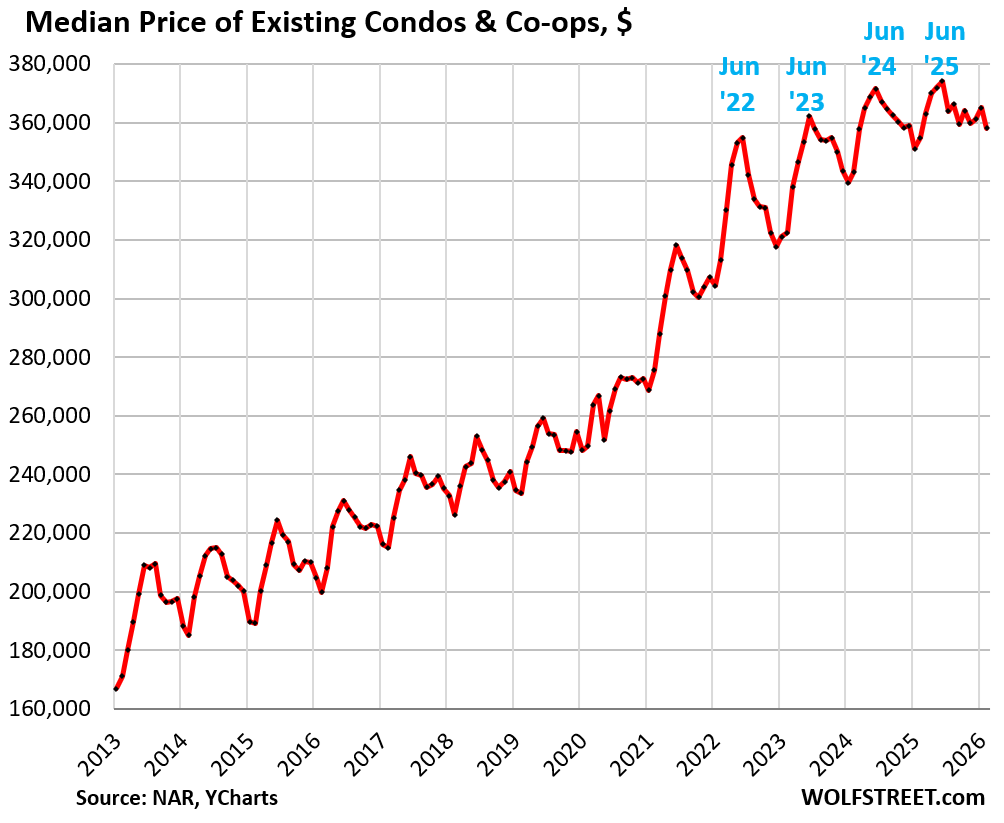
Sales of condos and co-ops plunged seasonally adjusted by 5.3% in February from January and 5.3% year-over-year, by 49% from February 2021, and by 36% from February 2019, to an annual rate of 360,000 sales, a record low in the data shared with May 2020 and May 2025.
NAR’s condo sales data go back to only 2011, and within that time frame, sales have been wobbling along record lows for the fourth year now.
The national median price of condos and co-ops, not seasonally adjusted, was up by 0.9% year-over-year, after the drop in February from January.
Sales by region.
The charts below show the seasonally adjusted annual rate of sales (SAAR) in the four Census Regions of the US. A map of the four regions is below the article at the top of the comments.
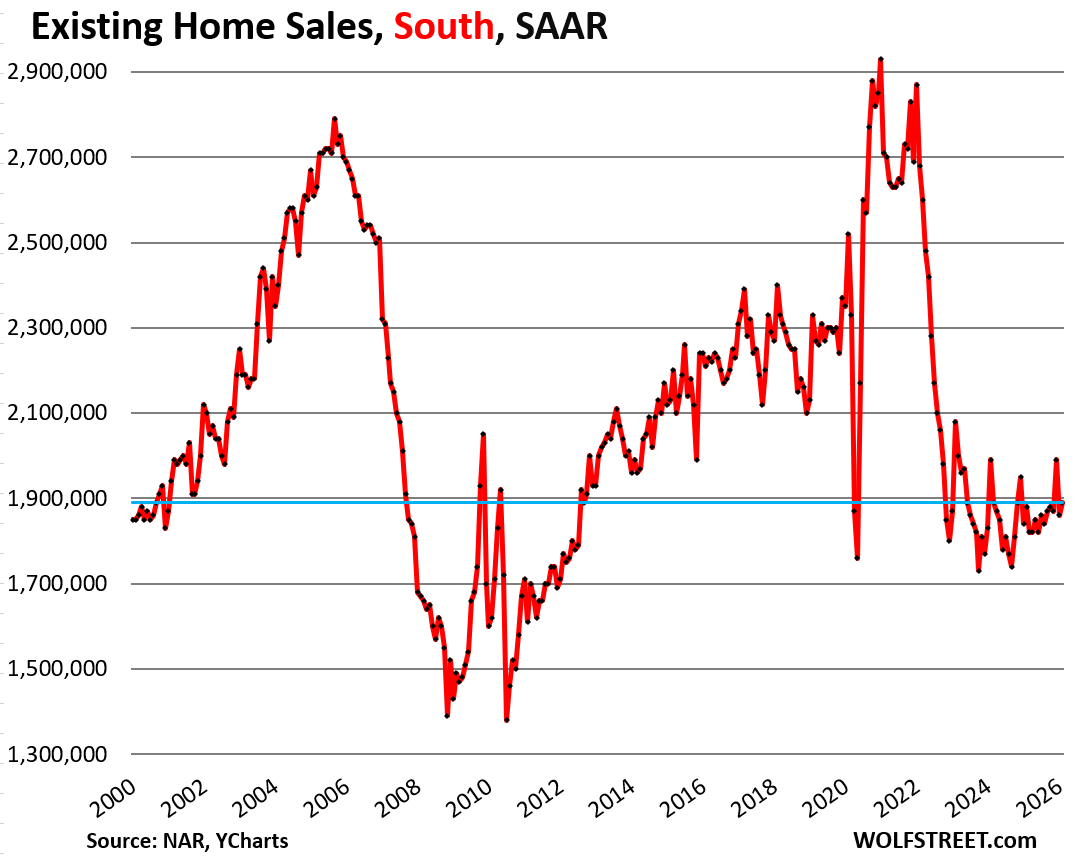
In the South, the seasonally adjusted annual rate of sales ticked up by 1.6%, after the 6.5% plunge in January, to 1.89 million homes.
Compared to February in:
- 2025: +0.5% (year-over-year)
- 2024: -5.0%
- 2023: -9.1%
- 2022: -29.5%
- 2019: -18.9%
- 2018: -21.3%
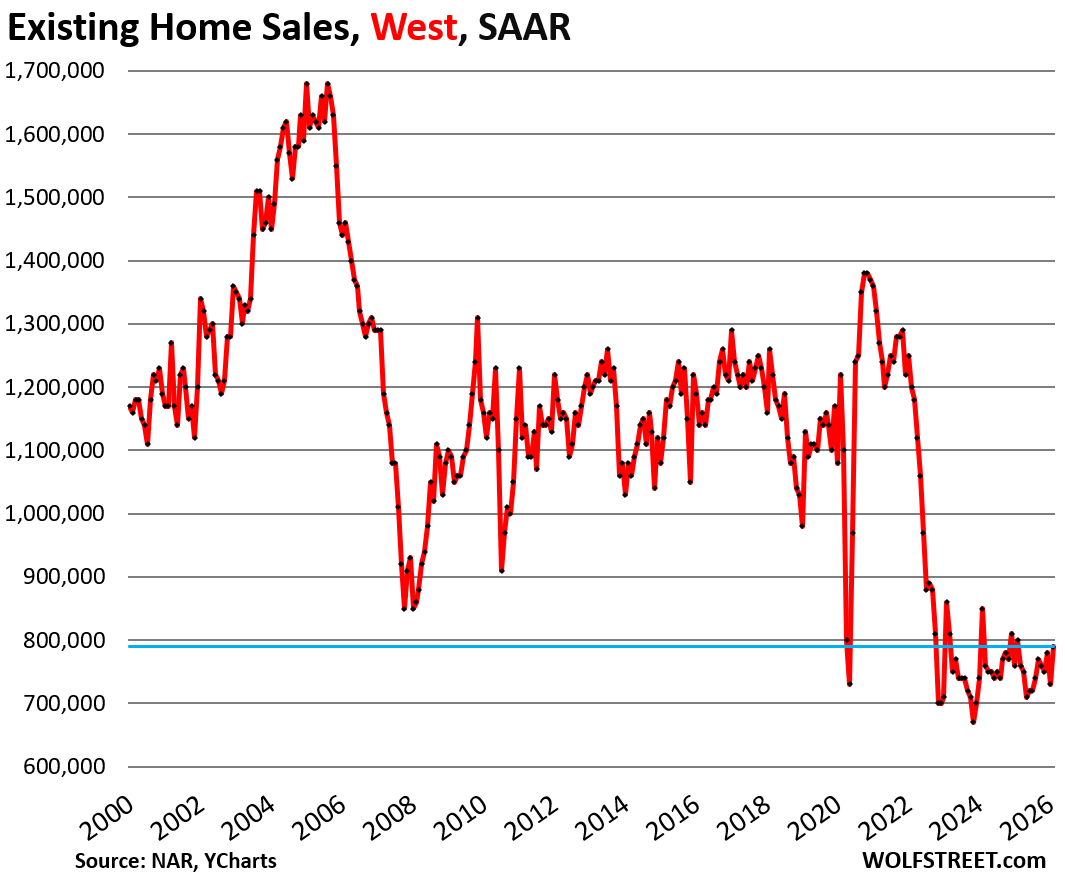
In the West, the seasonally adjusted annual rate of sales rose by 8.2% in February from January, after the 6.4% plunge in the prior month, to 790,000 homes.
Compared to February in:
- 2025: -1.3% (year-over-year)
- 2024: -7.1%
- 2023: -8.1%
- 2022: -34.2%
- 2019: -30.1%
- 2018: -37.3%
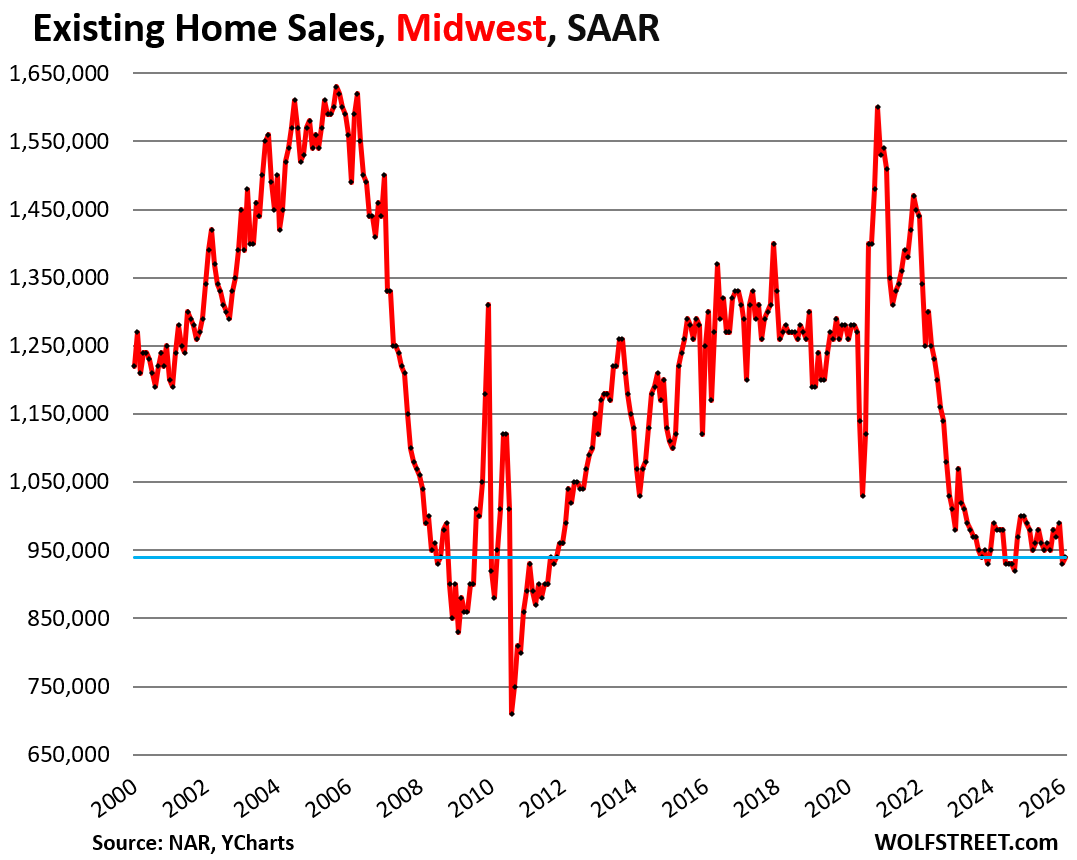
In the Midwest, the seasonally adjusted annual rate of sales rose by 1.1% in February from January, undoing only a small portion of the 6.1% plunge in the prior month, to 940,000 homes.
Compared to February in:
- 2025: -4.1%
- 2024: -5.1%
- 2023: -12.1%
- 2022: -29.9%
- 2019: -21.0%
- 2018: -25.4%
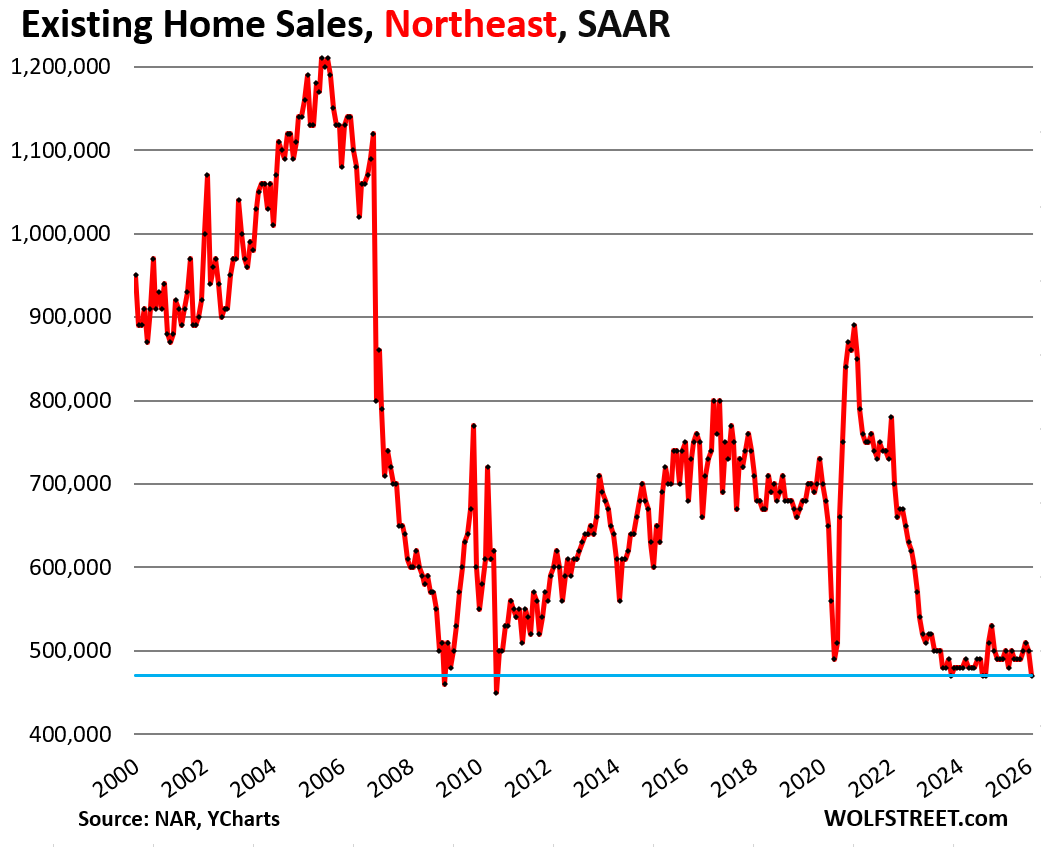
In the Northeast, the seasonally adjusted annual rate of sales fell by 6.0% in February from January to 470,000 homes, sharing the lowest end at the very bottom of the range with four other months.
Compared to February in:
- 2025: -4.1% (year-over-year)
- 2024: -2.1%
- 2023: -9.6%
- 2022: -32.9%
- 2019: -30.9%
- 2018: -30.9%
Enjoy reading WOLF STREET and want to support it? You can donate. I appreciate it immensely. Click on the mug to find out how:

![]()
Here is a map of the four Census regions of the US:
While I have seen some softening on pricing for the properties that interest me still on strike unless I see a real good deal,time will tell.o
For someone less educated like myself, what does this mean for the short, mid, and long term? Interesting to see that the increase in SALT deductions has not moved the needle more for house humpers in Southern Cali.
Here come the price cuts.
Hey y’all make sure you shop around for home owners. I switched, would have been 4700 now it is 3100. I was paying 4200.
I’m sure it will go up again though
What’s cool about the months supply graph is that it shows the COVID+ years were the outliers.
Really hope people can keep that in mind
Months of supply in the northeast is definitely not close to 2 months and well below the nation average. Back to real estate is local.
The existing SFH all time high set back in June of 2025 will remain the ATH for years, decades, and perhaps, for all eternity. The 2026 peak season will prove to be nothing more than a pimple on gnat’s ass, with regards to the chart, that is. The only remaining options for the median price to move are sideways and down.
Yes, until dollar dilution hits full stride, 2028-2034.
It seems that, basically, it’s the wash-rinse-repeat mantra.
I don’t buy into the “People are happy with their low interest mortgages,” or “The supply of homes is low,”or any other array of excuses or reasons.
SOMETHING is artificially keeping home prices sky high. This market is NOT normal in any way, shape or form. The current housing market is a circus freak; a freak of nature! Free market forces have been overridden in this housing market.
Here comes…in SoCal like OC and West LA…not in my neighborhood…demand is just fine and inventory still tight…/S