Condo sales plunged to near-record lows.
By Wolf Richter for WOLF STREET.
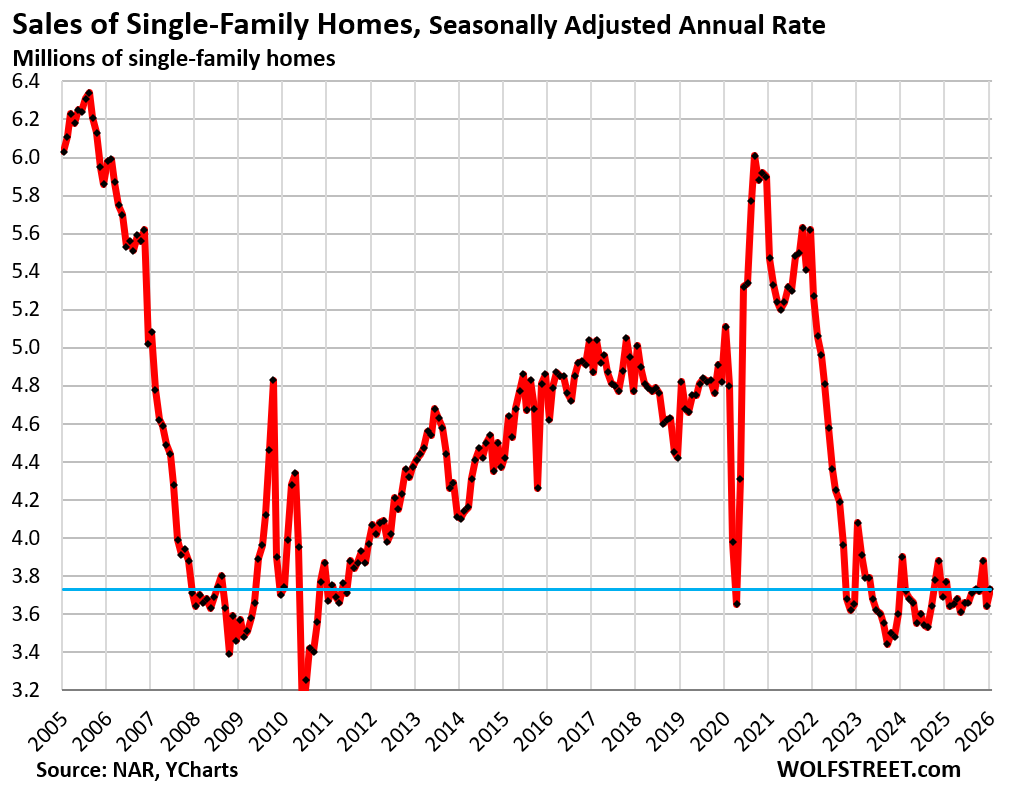
Sales of existing single-family homes that closed in February ticked up seasonally adjusted from January by 2.5%, making up only a small portion of the 6.2% plunge in January from December, to an annual rate of 3.73 million sales, right along at the deepfreeze levels that began in 2022, according to data by the National Association of Realtors today.
Compared to February in (historical data from YCharts):
- 2025: -1.1% (year-over-year)
- 2024: -4.4%
- 2023: -8.6%
- 2022: -29.2%
- 2021: -31.8%
- 2019: -22.6%
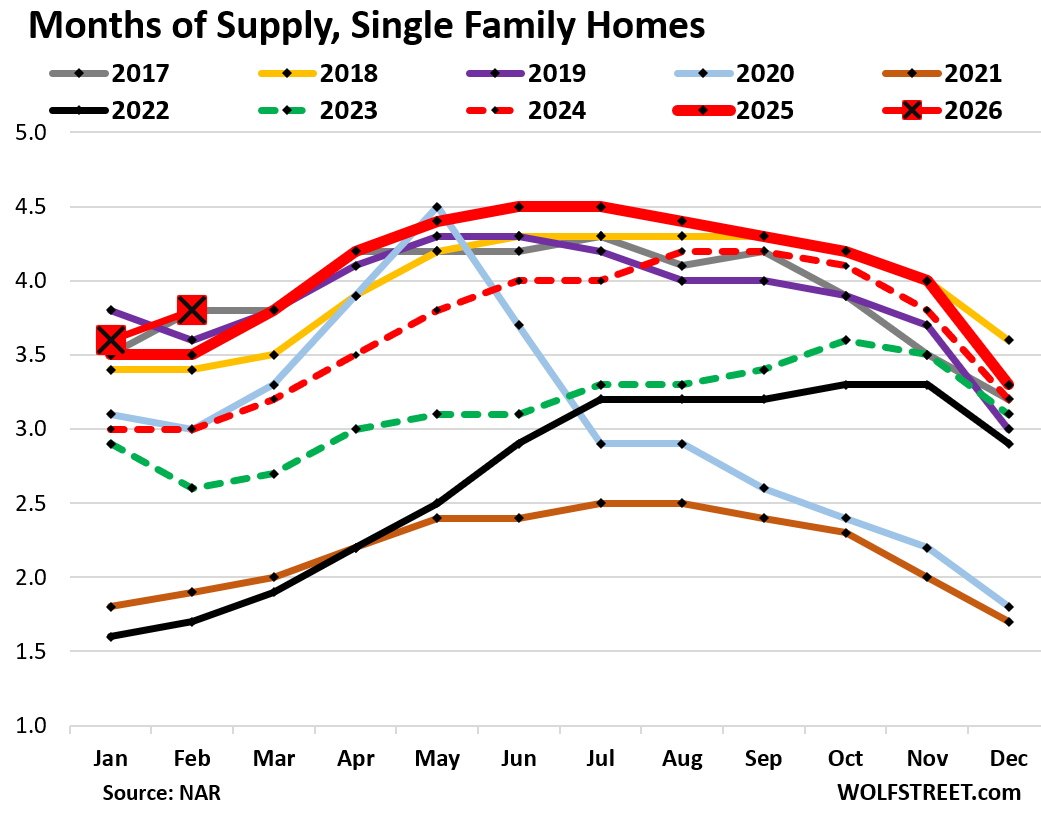
But supply of single-family homes jumped to 3.8 months in February (red line with big red square in the chart below), the highest supply for February since 2017, also 3.8 months.
In February a year ago, supply was 3.5 months. The fat red line without boxes shows the year 2025, which had marked the high end for supply in that time range going back to 2017 (historical data from YCharts).
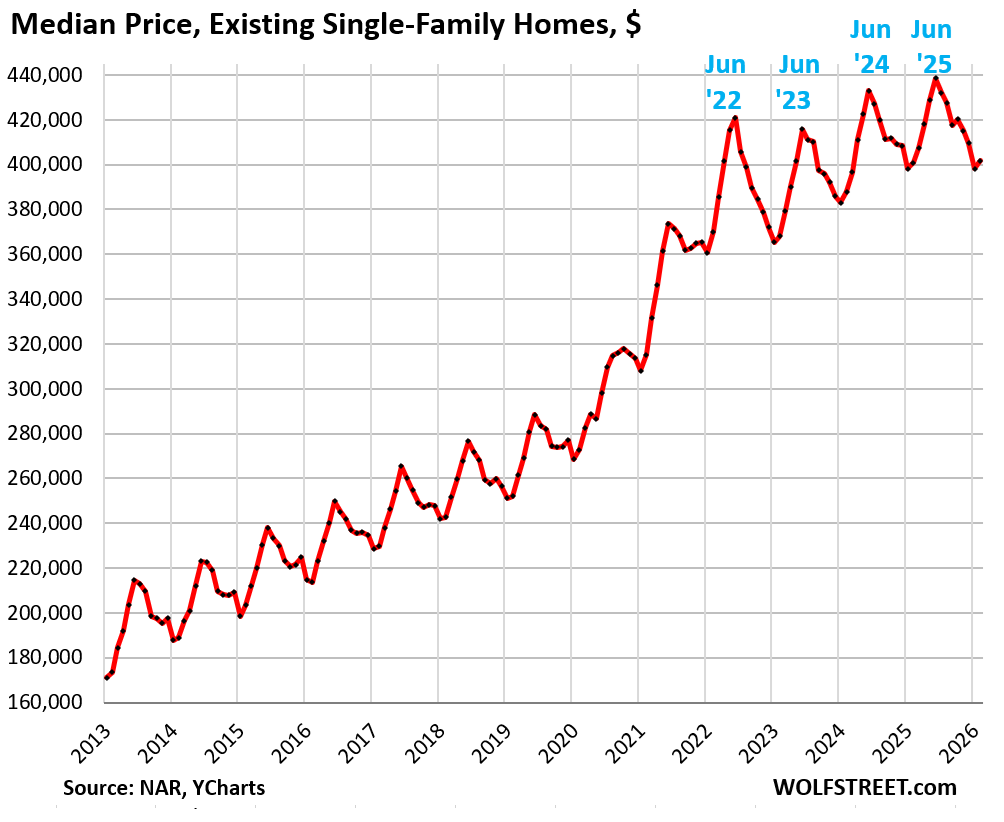
The national median price of single-family homes, not seasonally adjusted, edged up by 0.2% year-over-year. It has now been nearly unchanged year-over-year for the past three months (0.2%, 0.0%, 0.2%).
The median price had exploded by 41% from June 2020 through June 2022, from already high prices. Those too-high prices (what NAR calls “affordability issues”) are a big factor why the housing market has frozen up since then.
The median price is not seasonally adjusted. And it’s very seasonal, rising and falling with the shift in inventories and sales, as a larger share of more expensive homes come on the market and sell in the spring, thereby changing the mix of what sold, and shifting the median price up through June. In the second half of the year, the mix reverts, and the median price drops and bottoms out in January.
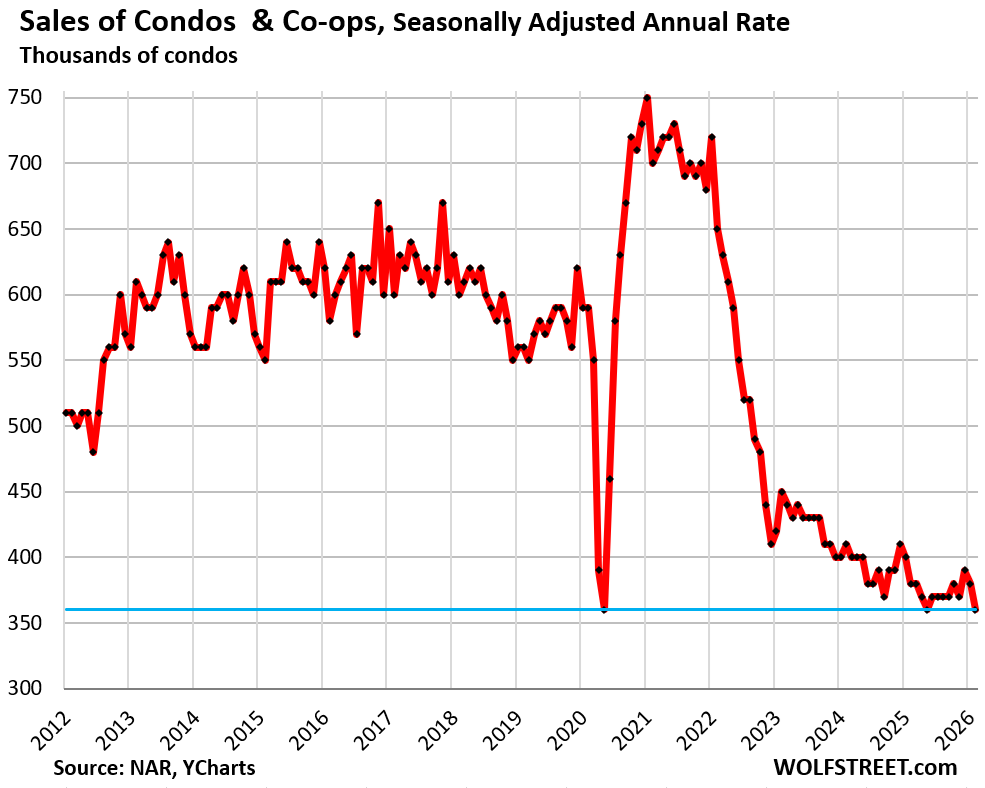
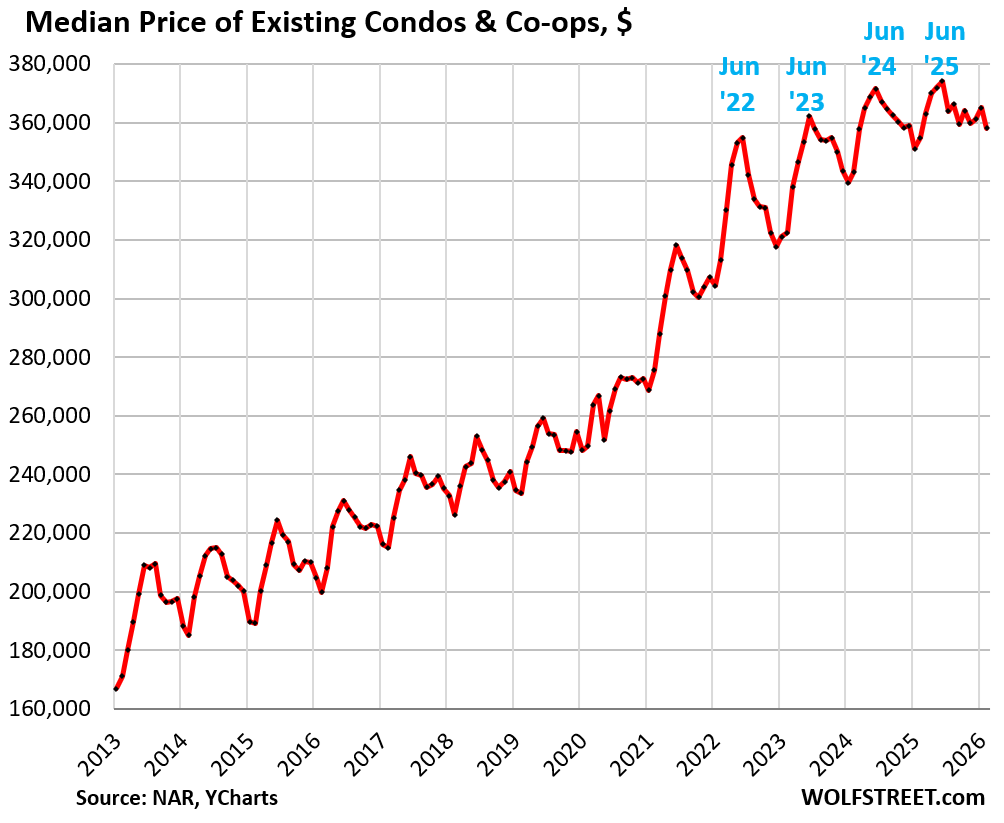
Sales of condos and co-ops plunged seasonally adjusted by 5.3% in February from January and 5.3% year-over-year, by 49% from February 2021, and by 36% from February 2019, to an annual rate of 360,000 sales, a record low in the data shared with May 2020 and May 2025.
NAR’s condo sales data go back to only 2011, and within that time frame, sales have been wobbling along record lows for the fourth year now.
The national median price of condos and co-ops, not seasonally adjusted, was up by 0.9% year-over-year, after the drop in February from January.
Sales by region.
The charts below show the seasonally adjusted annual rate of sales (SAAR) in the four Census Regions of the US. A map of the four regions is below the article at the top of the comments.
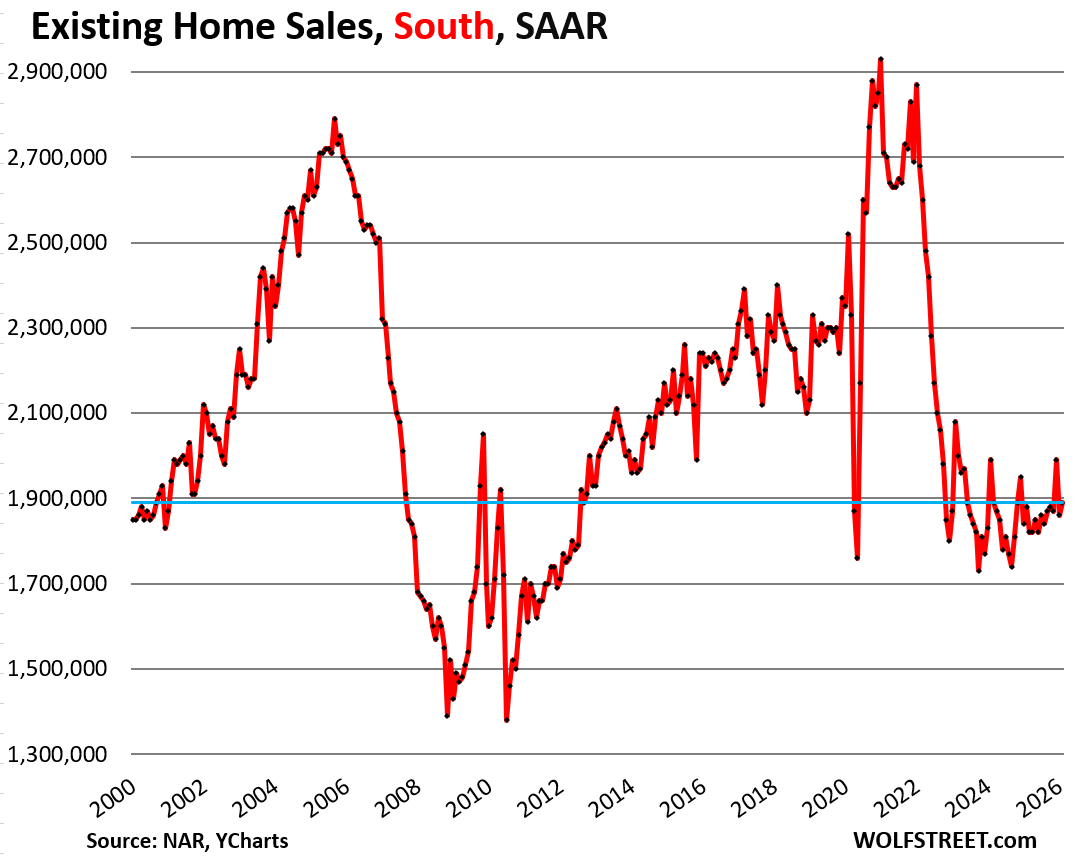
In the South, the seasonally adjusted annual rate of sales ticked up by 1.6%, after the 6.5% plunge in January, to 1.89 million homes.
Compared to February in:
- 2025: +0.5% (year-over-year)
- 2024: -5.0%
- 2023: -9.1%
- 2022: -29.5%
- 2019: -18.9%
- 2018: -21.3%
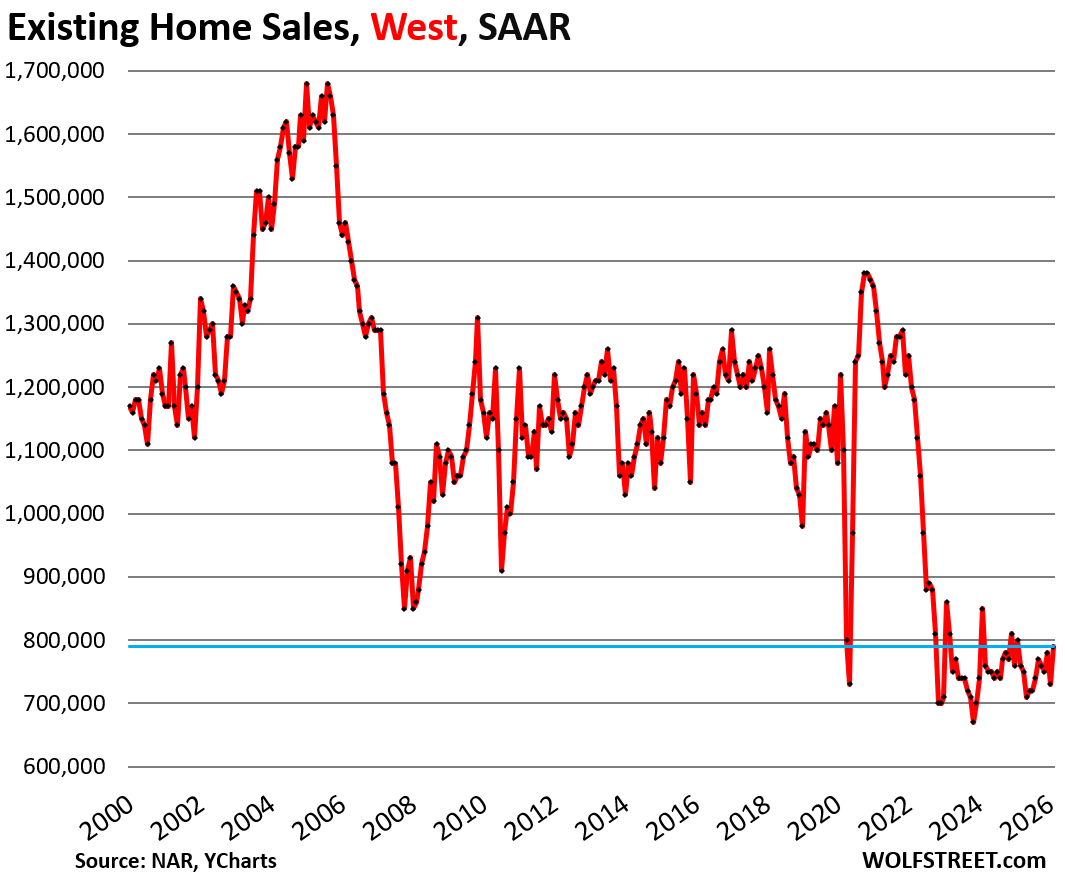
In the West, the seasonally adjusted annual rate of sales rose by 8.2% in February from January, after the 6.4% plunge in the prior month, to 790,000 homes.
Compared to February in:
- 2025: -1.3% (year-over-year)
- 2024: -7.1%
- 2023: -8.1%
- 2022: -34.2%
- 2019: -30.1%
- 2018: -37.3%
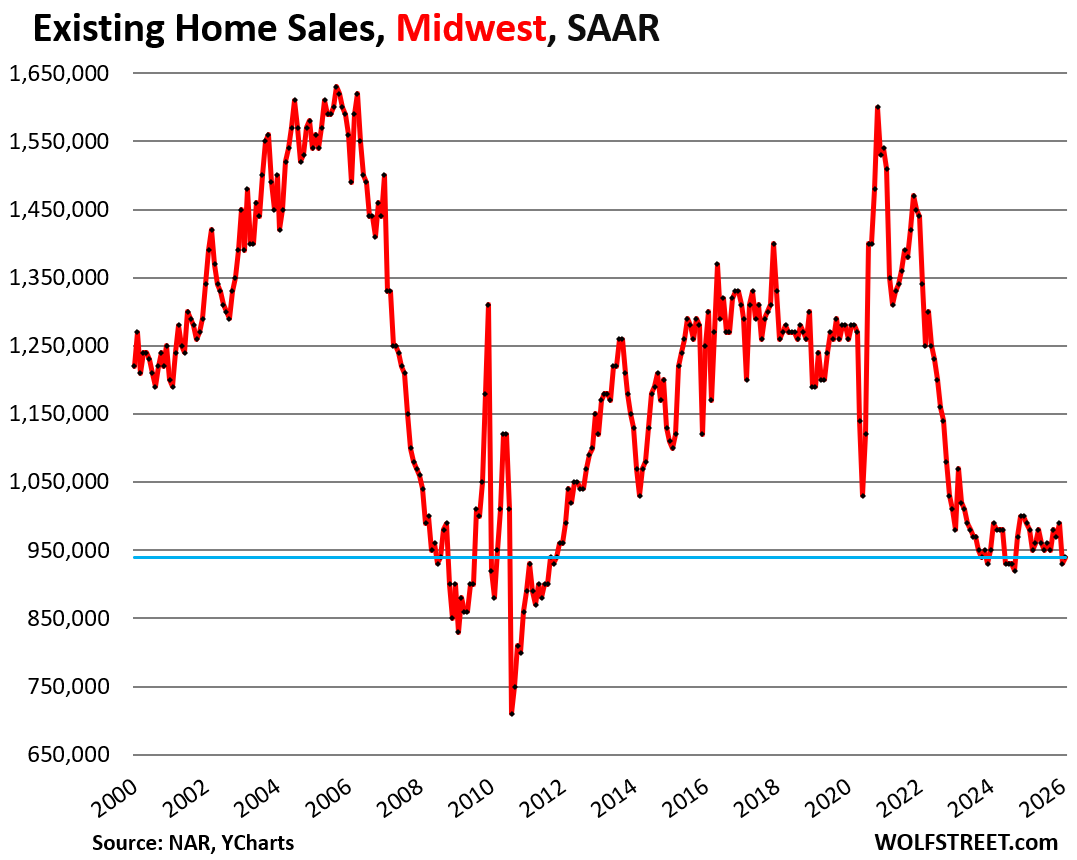
In the Midwest, the seasonally adjusted annual rate of sales rose by 1.1% in February from January, undoing only a small portion of the 6.1% plunge in the prior month, to 940,000 homes.
Compared to February in:
- 2025: -4.1%
- 2024: -5.1%
- 2023: -12.1%
- 2022: -29.9%
- 2019: -21.0%
- 2018: -25.4%
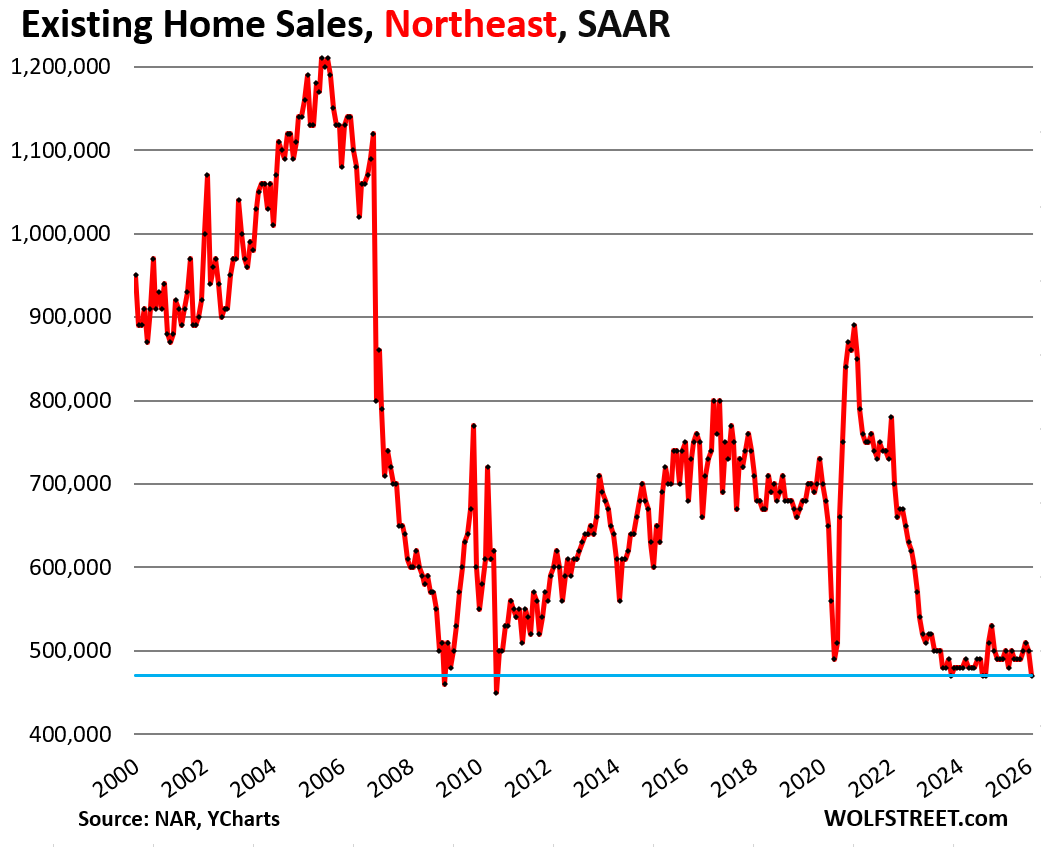
In the Northeast, the seasonally adjusted annual rate of sales fell by 6.0% in February from January to 470,000 homes, sharing the lowest end at the very bottom of the range with four other months.
Compared to February in:
- 2025: -4.1% (year-over-year)
- 2024: -2.1%
- 2023: -9.6%
- 2022: -32.9%
- 2019: -30.9%
- 2018: -30.9%
Enjoy reading WOLF STREET and want to support it? You can donate. I appreciate it immensely. Click on the mug to find out how:

![]()
Here is a map of the four Census regions of the US:
While I have seen some softening on pricing for the properties that interest me still on strike unless I see a real good deal,time will tell.o
I know that the nesting instinct will make the kids crazy and they will do what I did.
Buy a house with a 14.5 pct FHA loan at the height of Volker’s solution too inflation. Created by the expenditures for the Vietnam war.
was a monetary conscription that cost me dearly in the relative sense. A krone signed a sales agreement without a drop dead clause.
Sometimes I think it might have been the splitting of my pants during a sit in my wife, me, and my six month old staged at the the title company to force them to issue the sales documents
It was probably the changing of the diapers on full display that done it,
I think there’s also an instinct many people have to change their environment every few years or so. I’ve met people who don’t like settling for anything old when that new thing comes around. They want it – new cars, new job, new spouse, latest clothing, new house.
These folks won’t sit tight in a 3% mortgage for long when the old boring home is driving them crazy. If circumstances allow them to afford it, they’ll always make that emotional leap, regardless of finances.
That mindset is in the buyer and the seller pool and may be impacting prices on the margin.
It’s one way to live. Not my way.
Same here , 80% of houses in Raleigh have big issues that none of the owners address.
They want their Zillow rate! Morons
For someone less educated like myself, what does this mean for the short, mid, and long term? Interesting to see that the increase in SALT deductions has not moved the needle more for house humpers in Southern Cali.
Think a Salt deduction would just cover your prop taxes. Maybe they cover them.
Here come the price cuts.
Not around Boston-Cambridge or Providence, RI. Prices not moving at all. Gridlock.
Same for most of N.H.,…..,hold.
Hey y’all make sure you shop around for home owners. I switched, would have been 4700 now it is 3100. I was paying 4200.
I’m sure it will go up again though
Yeah, I had to unbundle to save. The savings were significan, much more than the bundling discount. One was $1K more for home and $1K less for auto the the other the reverse. Makes no sense, but each company has its priorities. Loyalty counts for nothing…..
Lots of greed pricing in rents out there. Most aren’t getting it and the houses remain vacant. These are accidental landlords who don’t understand math and how vacancy eats up all of your profit. You NEVER get that lost rent back.
What’s cool about the months supply graph is that it shows the COVID+ years were the outliers.
Really hope people can keep that in mind
Months of supply in the northeast is definitely not close to 2 months and well below the nation average. Back to real estate is local.
The existing SFH all time high set back in June of 2025 will remain the ATH for years, decades, and perhaps, for all eternity. The 2026 peak season will prove to be nothing more than a pimple on gnat’s ass, with regards to the chart, that is. The only remaining options for the median price to move are sideways and down.
Yes, until dollar dilution hits full stride, 2028-2034.
RE is often touted as inflation insurance, but I wonder if there is a tipping point somewhere out there. E.g. if inflation gets too high and stays that way for too long, the whole country becomes a basket case.
I’d be curious to learn how RE did in places like Turkyie’, Argentina, Venezuela, Egypt, India, or Russia. I just never hear about the “hot” RE markets in such countries.
The answer to that question would tell you how things will go if the US goes full-shitehole-country.
Real Estate has led the way in inflation. Now the bets are if everything rises to meet housing costs or housing costs drop. The people that pull the levers seem to fear wage inflation most, so I’d say the later is more likely.
“Turkey’s real estate market was an excellent inflation hedge only in select windows (notably 2020–2022); outside those periods, prices rose fast but often failed to keep up with inflation.” – CoPilot
So unless you were apart of great movement in after the pandemic, no.
It seems that, basically, it’s the wash-rinse-repeat mantra.
I don’t buy into the “People are happy with their low interest mortgages,” or “The supply of homes is low,”or any other array of excuses or reasons.
SOMETHING is artificially keeping home prices sky high. This market is NOT normal in any way, shape or form. The current housing market is a circus freak; a freak of nature! Free market forces have been overridden in this housing market.
There’s no conspiracy here. It’s that the 2020-2022 recklessness from the Fed and Congress reset expectations about what houses “should” cost, and sellers are consequently unwilling to sell for much below their idea of what that “should” is, and some buyers (albeit, a much reduced pool, which is why volume has collapsed) are willing to pay those higher prices.
It’s a lot easier to reset expectations up than it is reset them down, no matter what is being bought or sold.
The reason nothing is moving is because the prices are still too high and sellers don’t have to sell. Sellers may want to sell but many don’t “have” to sell.
Shit, if I had to move, I would just rent my house out probably.
Those people, make the worst landlords.
and the biggest suckers. They get taken hard. The scammers know who they are. (like a radar)
and then their house that wasn’t worth what they thought a year or two earlier is worth even less after the tennant lives in it for a few years
Over the next year, a lot more of them are going to have to sell.
The coming crises in private credit (and banking) and deferred commercial real estate losses, AI replacing more workers, the foolish ignorance of the wanna be authoritarians in D.C. and all the ridiculous decisions they are making and subsequent inflation, followed by the coming recession and stock market swoon, will see to that.
Here comes…in SoCal like OC and West LA…not in my neighborhood…demand is just fine and inventory still tight…/S
I’m in one of those neighborhoods—and I’ve been house hunting since the summer of 2020! Every time I think now is the time prices will finally drop I get proven wrong. I’m like Charlie Brown and Lucy with the football. But no more! I made an under asking offer on a home in January and it ended up selling for 10% over asking price and that was it for me. I told my kid to make peace with our rent-controlled apartment because we’re not leaving. I’ll probably die living here, lol.
Some neighborhoods here in AZ just going up. Pretty much every time a house sells in my parents neighbor it’s a new price record.
I have seen the number of listings EXPLODE where I am (South Bay Area, CA) the last 10 days to 2 weeks. It will be interesting to see what that means as the market had been already softening a bit recently.
Great observation! This market has been defying reality for way too long. It CANNOT go on…it will eventually break. And yes, it will be super interesting to see what effect the surge in listings does to home prices. Prices in many/most areas are insane‼️
It’s that old saying “the market can remain irrational longer than you can remain solvent.” The housing market is illiquid and glacial in its pace. However, once it turns and prices go negative, it picks up speed.
You all should see Cape Coral Florida. 3-2’s going for 200k. Inventory still surging. lol, this here party is just getting started!
Yes, Cape Coral has long been a hero here, including here:
https://wolfstreet.com/2026/01/16/condo-prices-now-below-2005-2007-housing-bubble-peaks-in-8-cities-including-oakland-chicago-and-2-cities-in-florida/
and here:
https://wolfstreet.com/2025/08/23/the-12-bigger-cities-with-the-biggest-price-declines-of-single-family-homes-10-to-23-through-july/
The city of the future!
If you ever drove around Cape Coral, you would not be impressed. It’s famous for literally being the worst planned (or one of the worst) in the whole state. There’s only 2 bridges that connect it to the mainland…massive traffic jams.
There’s no old “downtown Cape Coral”. Look up the wiki entry…it has more canals than Venice. It’s just a massive grid of ugly homes built about 3′ AMSL. A direct hit from a Cat 5 hurricane puts the entire thing deep under water.
Ugly homes and very little in the way of commercial zoning so you have massive neighborhoods with no services. You have to drive in 95% of the n’hoods to find stores.
You can’t overstate how poorly planned it is. I’ve been there for work several times over the last 15 yrs and every time I leave, I thank God and hope to never return.
Nobody has ever gone there for a concert or a movie. There’s nothing to do. Nothing.
Thanks for the reminder re: Cape Coral Wolf.
Just for those with no FL experience, CC is just one of the ”cities” platted out decades ago, and were ”built out” very very slowly for houses because most lots were sold before and during the building of infrastructure including paved roads, etc., but not including storm drainage, and many many have been underwater many times since…
Many folx of all ages, ethnic backgrounds, etc., etc., ended up, and continue with serious flooding and similar challenges in all of these quickly sold areas in FL…
Suggesting only that anyone interested in the benefits of buying and living in FL investigate thoroughly,,, AKA ”Due Diligence”,,, before buying or even moving there…
”Due Diligence” – agree 100%. Been living in S. FL since mid 1990’s on Atlantic side. Knew family members who lived there for years and finally had enough of the storms & Flooding. Final stake was that last hurricane few years ago. I was never a fan of CC, it’s an old old town with some serious flood zone ares.
Said that, Just as Vintage said… Do your home work if you want too move there, make sure you know what your getting into. My opinion FWIW.
I know nothing about Florida but I remember reading something recently where people were chiming in that Cape Coral is a dump and should have never been developed. Lots of swampland, crime and not a lot to do in the general area. Not sure if this is true.
It’s got wildlife refuges! And burrowing owls! Building over the natural wonder of Florida’s ecologically diverse hurricane-prone coasts was a travesty. The pythons are just the latest environmental disaster.
A cursory glance at Zillow shows that, what’s available for $200k or less, is that way for a reason?
One foreclosure, another ($220k) well-lived in (no interior pictures, but the garage is open, and packed with junk), and most others are mid-$200k and up.
All seem like fairly meh quality builds, but definitely cheaper than a lot of options out there.
I don’t know much about Florida, but I remember the traffic was pretty mind boggling when I was in Ft. Myers Beach several years ago (there was a major water line replacement at the time, meaning total gridlock near the beach. It was already bad in the whole area though).
I just watched a video on Miami’s permeable limestone underlayer, and recent floods they’ve had at high tides in spite of a $500 million pumping project that was designed to stop the intermittent floods. That works as designed, but is not solving the right problem, which is that the water bubbling up from below when saturated overwhelms the amount of water pumped out that’s flooding in from above.
Between that, sea level rising deniers, and the issues of poor construction in hurricane alley, Florida’s future ain’t looking so good to me. Apparently those swingin’ seniors are starting to desert those rockin’ Villages too.
Those low mortgage rates have owners locked in. Home owners cannot afford to sell or move. unless prices come down.
So if they get laid off there is an emergency money tree in the backyard to bail them out ?
Obviously no, They will be forced to sell or face foreclosure and 7 years of bad credit.
What gets me: the owners who can’t afford to sell because they bought too recently. Or perhaps the buyer wants some repairs/bad systems solved and these sellers could never afford to make that happen. Joe normal cannot be out $25,000 on this transaction because he HAD to have this house. Homes only go up ⬆️ 🙄
Listings in the markets I’m watching (CA, Albuqueque) are ticking up, but it seems only a few of the sellers are getting the message that prices need to drop. Nice homes priced to sell are gobbled up while the rest just get the stink on them.
When you say “nice homes priced to sell are gobbled up” do you mean that fixer uppers are stagnating on the market?
It would seem like high mortgage rates would encourage more people to bargain shop, and plan on investing sweat equity instead of mortgaging a higher amount on a house that’s already fixed up. I’d be interested to know if my intuition is wrong here.
The inflation impulse coming out of COVID seriously impacted the cost of new construction (other than flimsy starters which are impacted to a lesser degree).
This is another factor providing a “floor” under current prices. One of many: Aging Boomers, crazy low mortgage rates for a short period, inflation impulse putting lower K further out of reach of any housing purchase, expensive/unique properties still being purchased by upper K.
All in all, I’d say we’re in for a few more years of watching the paint dry.
Homebuilders get the drift and are selling at lower prices, and their sales volumes have been holding up. Homeowners haven’t figured it out yet. They’re still thinking, “this too shall pass.”
Big problem. I want to sell home, but after selling it and paying taxes, moving costs, I only have enough to money to buy a new trailer on 1/2 sized lot in the same area. So why sell my big beautiful old home?
It’s called “the golden handcuff”! :) Many of us are in that boat. Fortunately I love my 1940s pecky cypress cottage….
Interesting. According to Lennar, people can afford about as much for a home as they could in 2017. Did all the 43% in gains to average hourly earnings go to higher interest rates?
1. It’s not affordability. It’s what buyers are willing to pay that will allow Lennar to sell the large volume of homes it wants to sell. It’s a business, not a charity.
2. Affordability is NOT just price and interest rates, but a mix of price, interest rates, property taxes, HOA fees, and homeowners’ insurance.
Wolf, can you post the link to your earlier post that included this chart?
Thanks!
Sorry, I usually include links with charts
https://wolfstreet.com/2025/12/17/lennar-further-cuts-average-sales-price-of-new-homes-to-lowest-since-2017-25-from-peak-thats-what-this-housing-market-needs/
Lennar will report quarterly earnings later this month, and I will update the chart and maybe post a new article on it. But they’re not going to cut much more, if any, because construction costs have started to rise again.
In FL – buying a condo has always looked like an investment slightly less preferable to just setting your money on fire 🤔
Until they do something about the HOA rackets, you’re better off living in a van down by the river
HOAs were basically underfunded for decades. That is why the fees are spiking.
@Eric86 – for clarity, I am talking Florida specifically where we have numerous ongoing racketeering cases and fraud convictions in the HOA space, all promulgating legislation. We literally had legislation pass State Congress just last week to attack these issues (bipartisan by a huge margin).
Maybe your statement broadly applies – but in Florida this HOA madness is next level. When it comes to “F you, pay me” the Mafia never had it so good as the HOA rackets in FL
This is well documented; just a bit of research will get you there 👍
Yeah I know about all of that as well. I used to live there when this shit came out.
And yes, some of these issues in florida were because they were underfunded as well.
And talk about a bunch of assholes. Some 90 yr old woman in Tampa had 7 garden gnomes and the HOA only allowed 5. You know the rest of the story.
Put ‘HOA nightemare’ into google and get 10M hits.
My mom got a letter when I was a kid. Said our curtains needed to be white. I told the lady delivering the letter “They are white.” She said “No honey, those are CREAM colored.”
If you want some fucking nazis to control your life….move into an HOA!!!! :)
Interestingly, condos took off in popularity during the high-inflation 1970s and early 80s. You could buy less house and take out a smaller mortgage at double-digit rates. And the HOA meant your now-two-income household could focus on work and outsource the maintenance and lawn care.
All those reasons seem to be coming back. However, as you mentioned, the HOAs have become businesses / jobs in themselves. The original concept for HOAs was for them to be a cheaper way to pool resources and buy services in bulk. They were often originally run by elected volunteers in smaller condo developments. Now they just add a layer of cost.
In a sense, the same bloat that made labor unions deviate from their original designs affected HOAs: Passive members gave up more and more authority to professional leaders whose growing salaries ate up more and more of their monthly payments. The alternative was volunteering, which seemed like throwing one’s time away when other people were free-riding.
Which is why the cycle will mean the pendulum swings back and prices of HOAs drop because fewer folks are willing to pay. Right? I hope. I’d buy a condo if it weren’t the massive HOAs. I’d rather continue renting and bouncing around before locking in to a SFH or condo for 15 years. Based on Wolf’s work, I don’t foresee a world where I see any capital gains on real estate if I purchase now for the next 5 years or so. And with prices continuing to drop and supply increasing, I’ll continue to wait on the sidelines. Waiting for other folks’ misfortunes to lead to my indirect benefit.
IN my neighborhood, it takes $11K to purchase and $5.5K to rent the same house. It’s crazy and makes sense to rent and wait than to purchase at these prices/rates.
This is in So Cal/SD.
Are you still planning to do more “Most Splended” ZHVI monthly posts?
yes. Just needed a break for various technical reasons.
Such a dumb article. Inventory is still below historical norms. If inventory is low prices remain high. Supply, the amount of time it takes to exhaust current inventory at current sales rate, can be high because purchases are low due MANY variables, one of which is that inventory is low.
Inventory in a vacuum doesn’t matter, you goofball. Supply does. Supply is active listings in relationship to sales (demand). And sales have plunged: sales of single-family homes crashed by 40% from 2005, and by 32% from 2021, and by 25% from 2017. Sales of condos collapsed by nearly 50% from 2021 and by 40% from 2017. Sales have not come up over the past three years. But active listings have come up a lot, and supply is now the highest in many years.
Look for professional arsonists to pop up in some of these Blue cities to get properties off the frozen status. This occurred some time back in Boston several decades ago. I saw the video documentary. I think it was called “The fire next door”
Is there any sense that increasing the capital gains tax exclusion for sale of primary residence could also help things? Right now for a couple it sits at $500k gain which is where it has been for 30 years. Maybe increase it to $1MM??
I was surprised increasing the cap wasn’t part of OBBB last year- missed opportunity in my opinion to help the middle class.
Yes, I 100% agree that the capital gains tax should be increased. A 500K exclusion in 1997 is ~$1M today and it should have been indexed accordingly. At the very least, bring back the old rule that allowed you to defer cap gains if you rolled those gains into a more expensive home. I believe that would get some real estate movement, at least in some of the more expensive areas. Just my thoughts though and I welcome any comments/insights.
At some level, behind this and many other things you chart – and you do it well – is the sad reality America is just falling apart. Ourselves and our children simply wont do as well. The very very, teeny tiny rich are trying to also figure out what to do. No one has an answer but it – whatever this process is – will continue to show up in your charts.
In this specific case you have millions of folks with 2% mortgages who’ll probably go out of those homes under forced life conditions. The market is not like the past markets as a result.
People have been saying the answer, which is common sense, for a long time: stopping deficit spending, balancing the budget, stopping interest rate repression. But most people don’t see a problem because deficit spending is giving an illusion of semi-normalcy so they continue to vote for the Republicans and Democrats who are both responsible for the bad economic policies, when there has been a choice on the ballot for a balanced budget for a long time, Libertarian, and it be there again this coming November midterm elections, and will be there after that too. So maybe this country has to re-learn fiscal responsibility, idk.
Here in the South East. People are in the process of building a house next door to me, still aways from finished. Put their current house they were living on the market figuring they had plenty of time. Sold in 48 hrs.
Now they are under the gun to finish while staying in a friend’s Air B&B.
They were surprised as well as I.