Power generation surged for the second year amid a struggle to power AI data centers.
By Wolf Richter for WOLF STREET.
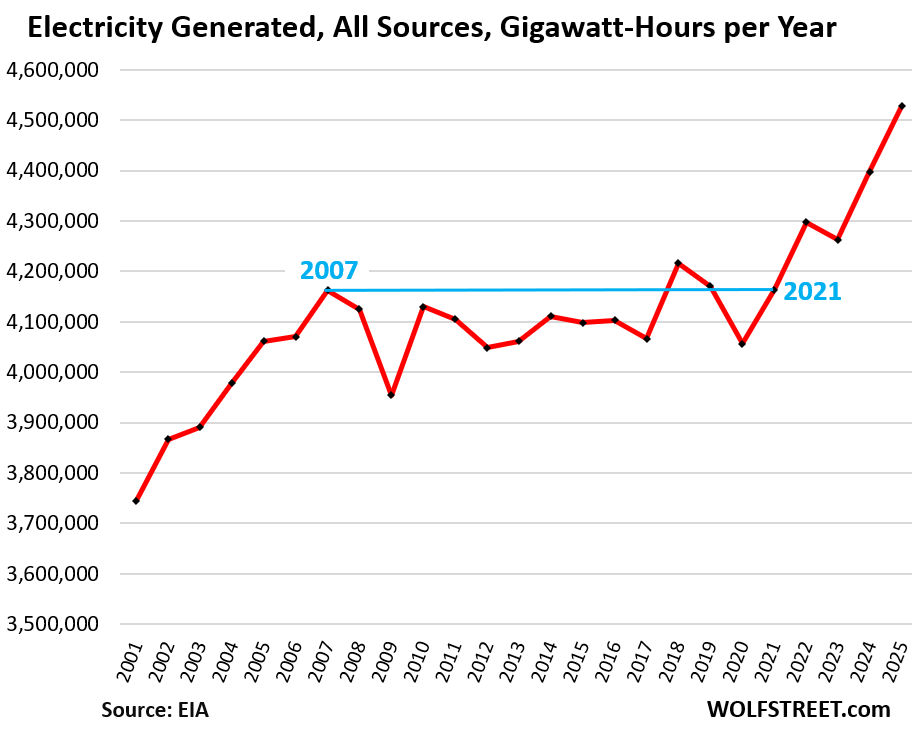
The quantity of electricity generated in the US by all sources, from natural gas to rooftop solar, rose by 3.0% in 2025 from 2024 to a record 4,527,969 gigawatt-hours (GWh), according to data from the EIA.
There had been 14 years of roughly no growth in power generation from 2007 through 2021, despite the growing economy and population, as electricity users cut their usage by investing in more efficient equipment – lights, appliances, electronic equipment, industrial equipment, heating and air-conditioning, etc. – and by investing in building insulation, shading, etc., with the hope of putting a lid on their rising power costs. During those years, many power generators and electric utilities were mired in a no-growth business where only rate increases could generate revenue growth.
But now there is a large-scale demand increase from data centers that are sprouting like mushrooms, on top of the demand from the rising share of EVs in the national vehicle fleet.
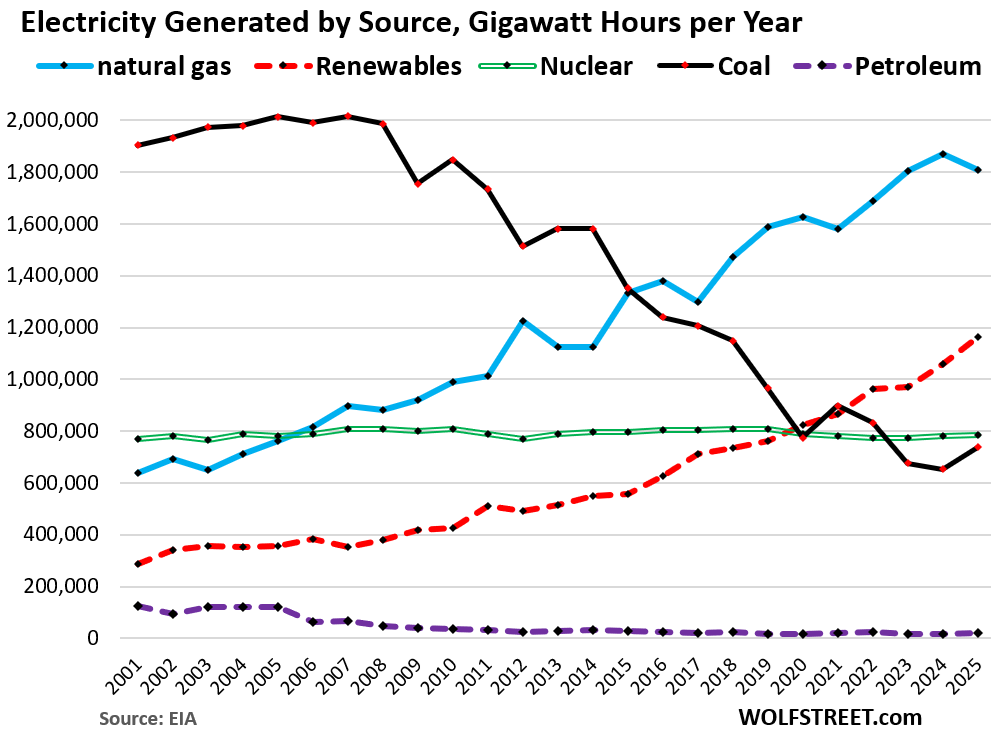
Electricity generated by source:
Natural gas dipped but still ruled. Electricity generated by natural-gas-fired power plants declined by 3.3% to 1,807,338 GWh in 2025, the second-highest after the record in the prior year (blue in the chart below).
The US became the world’s largest natural gas producer in 2014. This soaring production oversupplied the US market starting in 2009 and caused the price of natural gas to collapse. The low price of US natural gas and the high thermal efficiency of combined-cycle natural-gas-fired power plants – around 65%, nearly double that of older coal powerplants – made natural gas immensely attractive for power generators. Since 2007, power generation from natural gas has doubled.
Coal power generation jumped by 13% in 2025, from the record low in 2024, to 737,151 GWh (black in the chart below).
In terms of costs for power generation, coal cannot compete with the combination of cheap US natural gas and the efficiency of a combined-cycle gas turbine powerplant. Wind power has also become more cost-efficient than coal. With renewables, the “fuel” is free; and all methods of power generation require costly plants, equipment, and maintenance, there not being any free lunches when it comes to energy.
Generation from all renewables combined – wind, solar, hydro, geothermal, and biomass – rose by 9.6% to a record 1,162,090 GWh, driven by surging generation from solar (+28%). More on renewables in a moment (dotted red line).
Nuclear power generation inched up 0.4% to 784,781 GWh (double green line).
Generation from petroleum liquids & petroleum coke jumped by 26% to a minuscule 19,258 GWh (dotted purple):
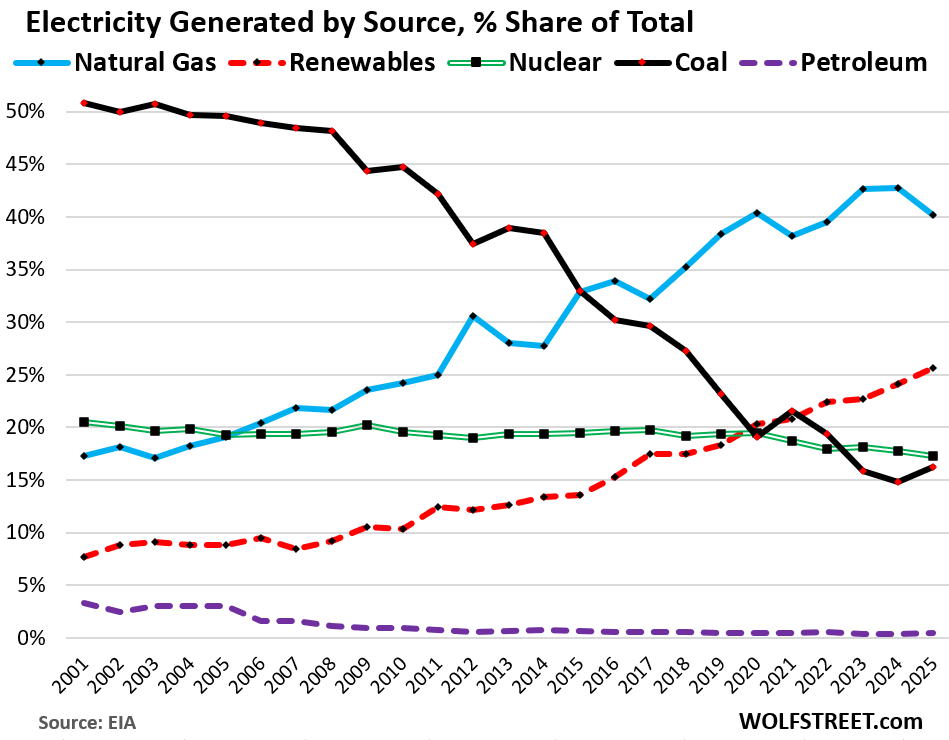
The % share of electricity generated by source:
The share of natural gas as source for power generation dipped to 40.2% of total power generation, from the record in the prior year, and about double its share in 2006. Natural gas had surpassed nuclear in 2006 and coal in 2016 (blue in the chart below).
Coal’s share rose to 16.3% of total power generation, from the record low share in the prior year (black).
The share of all renewables combined increased to a record 25.7% of total power generation (red). More on them in a moment.
The share of nuclear power generation edge down to 17.3%, continuing its long slide.
The share of petroleum and petroleum coke edged up to 0.4%, having nearly vanished as source of power generation (purple).
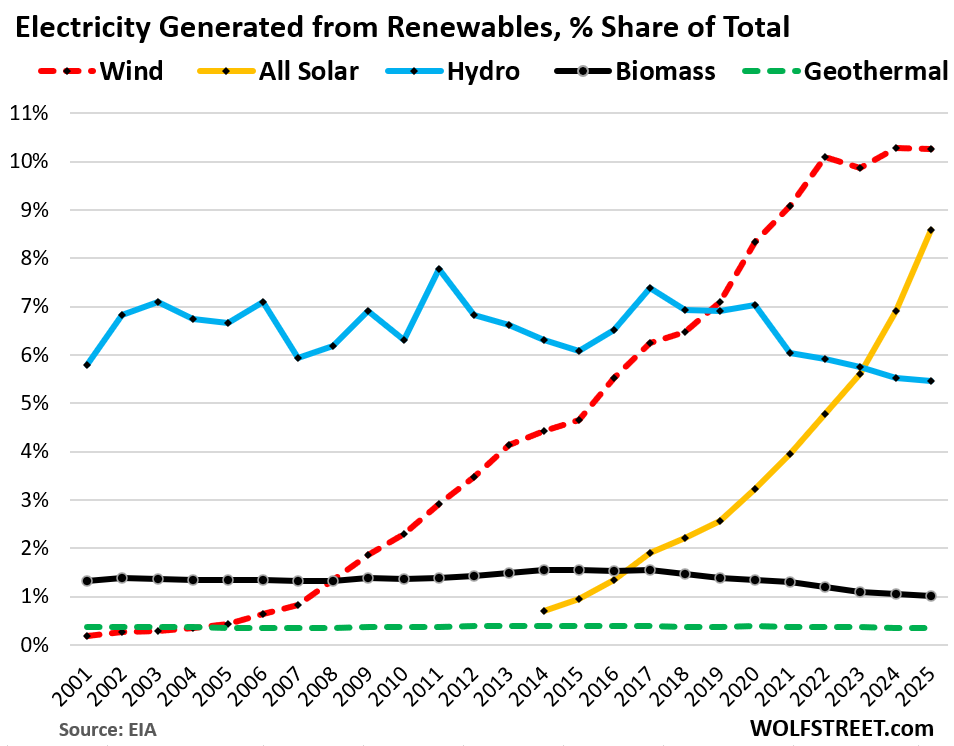
Power generation from renewables.
Wind power generation rose by 2.8% in 2025, to a record 464,391 GWh. Its share of total power generation remained at 10.3% (dotted red in the chart below).
The Big 5 states for utility-scale wind-power generation in 2024:
- Texas: 124,940 GWh
- Iowa: 44,310 GWh
- Oklahoma: 38,630 GWh
- Kansas: 30,320 GWh
- Illinois: 24,430 GWh
Solar power generation – utility scale and rooftop solar – surged 28.0% to 388,820 GWh. Its share of total power generation surged to 8.6% (yellow).
The share of wind and solar combined rose to 18.8% of total power production in the US.
Power generation from small-scale solar – such as rooftop systems on homes, retail stores, parking garages – jumped by 11.0% to 93,147 GWh, having more than doubled since 2020. The share of small-scale solar rose to 2.1% of total power generated.
The Big 5 states for utility-scale solar-power generation in 2024 (excludes rooftop solar):
- California: 79,544 GWh
- Texas: 44,506 GWh
- Florida: 23,302 GWh
- Arizona: 16,237 GWh
- Nevada: 14,524 GWh
Hydropower generation rose by 1.7% to 247,023 GWh. Its share remained at 5.5% of total power generation (blue).
Biomass power generation declined by 0.5% to 46,187 GWh, and its share declined to 1.0% of total power generated. Biomass includes wood and wood-derived fuels, landfill gas, and other waste biomass (black).
Geothermal power generation ticked up 1.7% to 15,669 GWh, for a minuscule share of 0.3% of total power generated. Most geothermal plants were built in the 1970s in California, but there are now renewed efforts underway to harness this power source, which provides reliable steady power generation (green).
All hands on deck! To deal with the sudden surge in demand.
Power plant retirements are put on hold. Due to the surge in demand for electricity, which is expected to ramp up further over the next few years, owners and operators have delayed planned retirements of power plants.
In 2025, owners and operators originally planned to retire 12.3 GW of capacity, of which 66% were coal-fired plants, 21% were natural-gas-fired plants, and 13% were petroleum-fired plants. But they ended up retiring only 4.6 GW of capacity in 2025, the least since 2008, under pressure from this sudden surge in demand and following emergency orders from the Department of Energy to extend the operations of several coal-fired plants. The EIA expects retirement delays to continue in 2026.
There were also major delays in retirements for 2025 that had been decided previously. For example, in 2022, the retirement of California’s last nuclear power plant, Diablo Canyon, scheduled for 2025, was moved to 2030, with potential operation extensions to 2045.
Power plant construction ramps up: In 2025, power plant developers and operators added 53 GW of new utility-scale power generating capacity to the grid, according to the EIA.
In 2026, they plan to add 86 GW of new utility-scale power generating capacity to the grid. If they actually succeed in getting these plants online, it would amount to a record addition. Solar power capacity accounts for over half of that addition.
Enjoy reading WOLF STREET and want to support it? You can donate. I appreciate it immensely. Click on the mug to find out how:

![]()
I have heard that AI data base are scheduled to build dedicated small nuclear plants. Where some this fit into the power production/consumption picture?
That’s not going to happen for many many years. It takes a very very long time to build a nuclear power plant, even a small one.
What is happening are natural-gas fired power generators are being installed at data centers. Several suppliers of them are now using retired jet engines as the base unit. That’s much faster to ramp up. Big diesel generators are also being installed. Look at Caterpillar’s stock [CAT].
Those gas turbines have essentially doubled and tripled in price over the last few years. It is nuts
In Texas many data centers are co-locating with solar or wind farms, either existing or new.
“Wind power has also become more cost-efficient than coal. With renewables, the “fuel” is free”
Hard to believe — is that with subsidies?
It’s been true for years. Solar is cheaper too. Existing natural gas plants are still slightly cheaper, but the moment you need to build a new one or do extensive maintenance, wind and solar win.
But there’s lots of folks out there that want you to think otherwise for political or economic reasons….
Everything is subsidized. The most subsidized of all by far is nuclear power. Nothing comes even close.
Great charts wolf,
Is there a way to understand power demand by source? Splitting EVs from data centers would be interesting.
EV electric usage is still very small, less than 1% of total electricity usage nationwide.
FYI: Here’s a link to Holtec’s restart of the Palisades Nuke plant. We live avoit ten miles south of Covert, MI.
https://www.enr.com/articles/62386-tasks-delay-restart-of-palisades-nuclear-site-until-possibly-late-march
I’m curious about the future impact the sunset (haha..) of the residential solar tax credit. Residential solar was a much larger percentage of this power generation than I expected.
I do know there are ways around it to capitalize on the commercial credit still existing, and also think the credit expiration may be a good way to apply pressure/trim the fat in current solar installation costs. Even with that, the credit expiration will have an impact. As a homeowner with a pretty chunky south facing roof, I am keeping an eye on this topic. Oh how I wish solar tiles took off, they look so much better than those brackets!
The credit is still around. They’ll just call them “leases” instead.
Rooftop solar took off in California when it was heavily subsidized. And then crashed when the subsidies were removed. In 2023, residential rooftop solar added 1,944 MW of capacity. In 2024, it dropped to 1,029 MW, and in 2025, despite predictions it would go up, it dropped a little bit more to 1,003 MW. Yes, there are work-arounds, but absent increased subsidies, 1,000 MW a year of additional residential roof-top solar capacity per year seems about right for the next couple of years.
Utility-scale solar in Texas will show the largest growth.