The PCE price index gets pushed down far less by the doctored housing index than CPI does because housing weighs half as much in PCE.
By Wolf Richter for WOLF STREET.
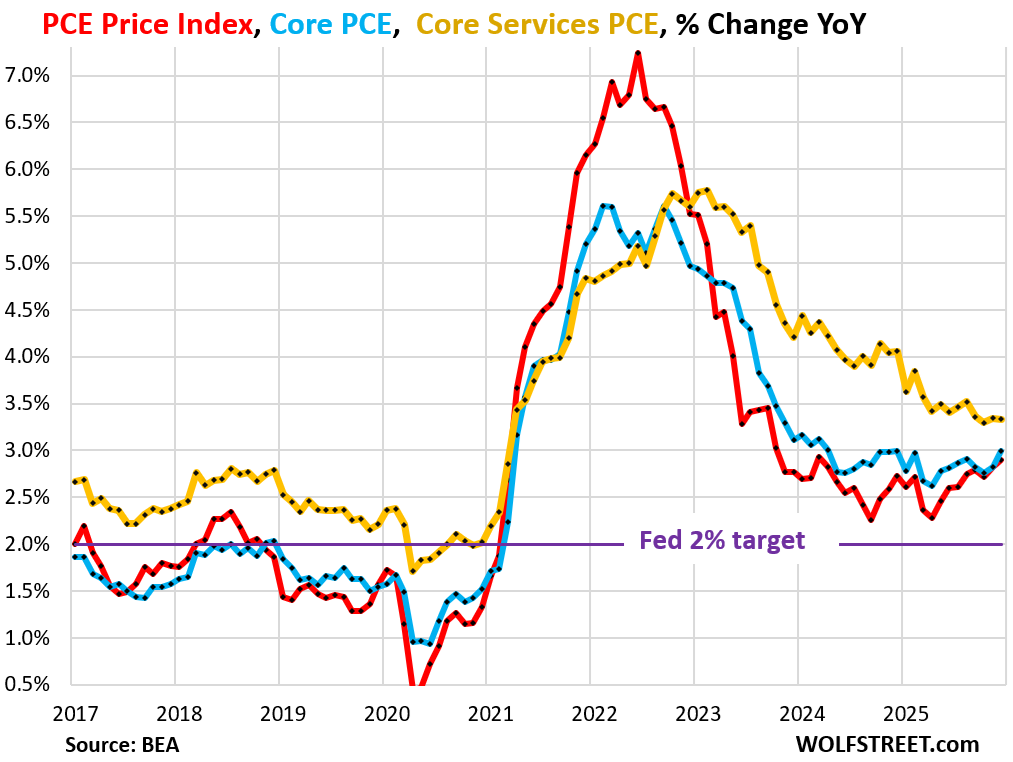
The PCE price index, the inflation measure that the Fed favors as its yardstick for its 2% inflation target, accelerated to +2.9% year-over-year in December, the most inflation in nearly two years, according to delayed data released by the BEA today (red in the chart). It started accelerating in April. On a monthly basis, it jumped by 0.36% (4.4% annualized). The six-month average accelerated to 3.0%, the worst since June 2024.
The core PCE Price index, which excludes food and energy components, accelerated to +3.0% year-over-year in December, the worst since April 2024 (blue in the chart). It also started accelerating in April. On a monthly basis, it also jumped by 0.36% (4.4% annualized).
The Fed’s target is 2% for these measures (purple line), not 3%. But they’re now at 3% on a rising trend.
The core services PCE price index increased by 3.3% year-over-year, same as in the prior two months (yellow in the chart). Month-to-month, it jumped by 0.33% (4.0% annualized). The six-month average accelerated to 3.5%, the worst since March 2025.
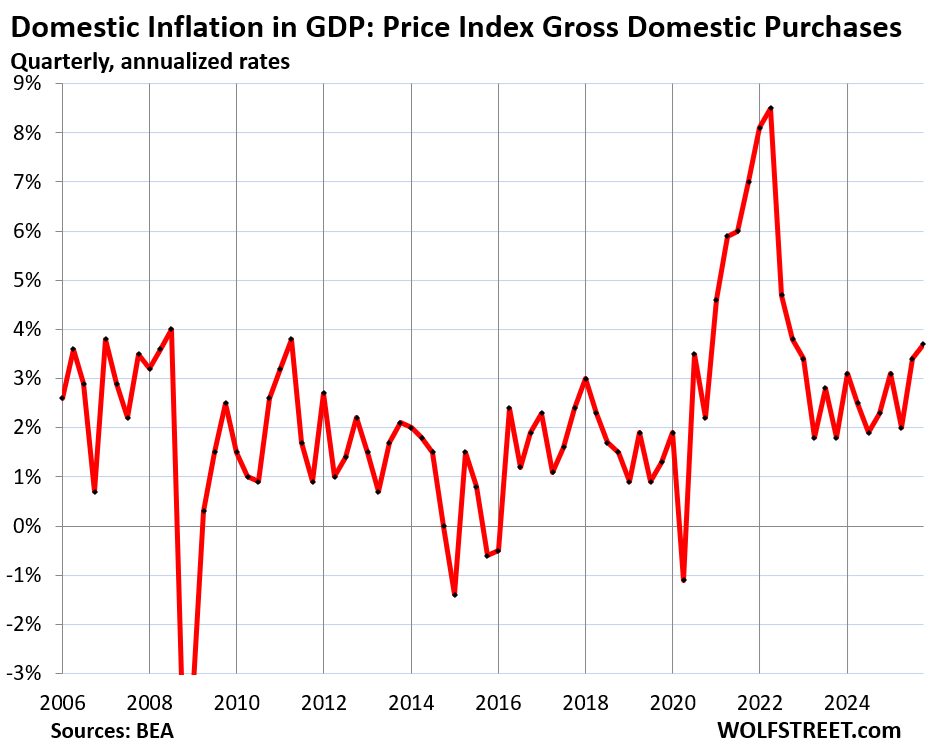
GDP inflation rose by 3.7% in Q4 – that was part of the huge trove of GDP data released today by the BEA, along with the PCE price index. GDP measures spending and investments by consumers, businesses, and governments in the overall US economy. The inflation adjustments for “real” GDP amounted to 3.7% annualized in Q4.
This hot reading is in part due to business and government spending categories where inflation has been higher than in consumer-facing prices. This 3.7% is the inflation rate for the overall economy, not just consumer spending.
The Price Index for Gross Domestic Purchases, which reflects inflation adjustments in GDP except for imports, so domestic inflation, accelerated to 3.7% in Q4, the worst in three years.
But wait… CPI has been cooling for months.
The US uses several different price indices, all sharing some data but cover different parts of the economy, and with different weights on each subcategory, and the methodologies differ.
The PCE price index and the GDP deflators above are released by the BEA; the PCE price index reflects consumer-facing inflation and the GDP deflators reflect much broader inflation in the overall economy.
The Consumer Price Index (CPI), released by the Bureau of Labor Statistics, reflects consumer-facing inflation.
On a year-over-year basis, core CPI started decelerating in September and overall CPI in October, just as the PCE price index components were taking off. So what gives?
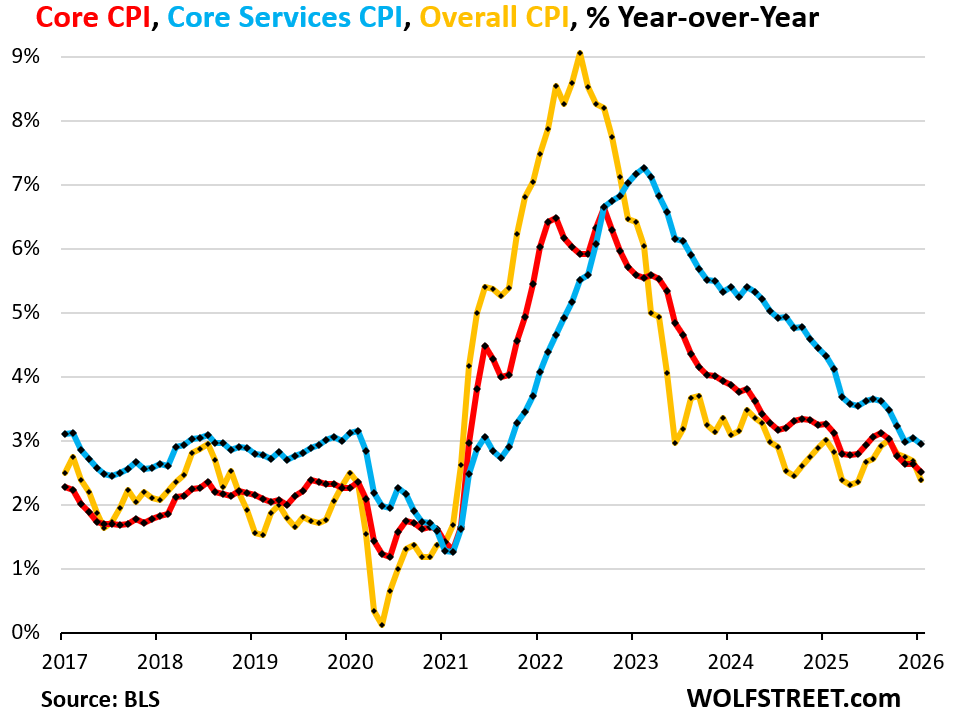
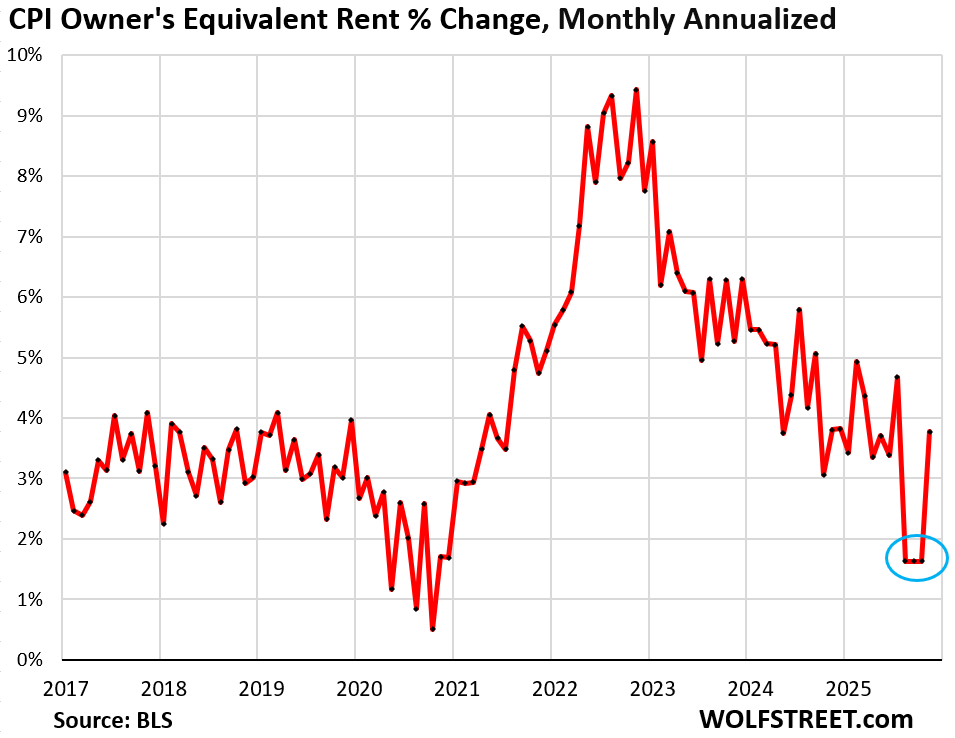
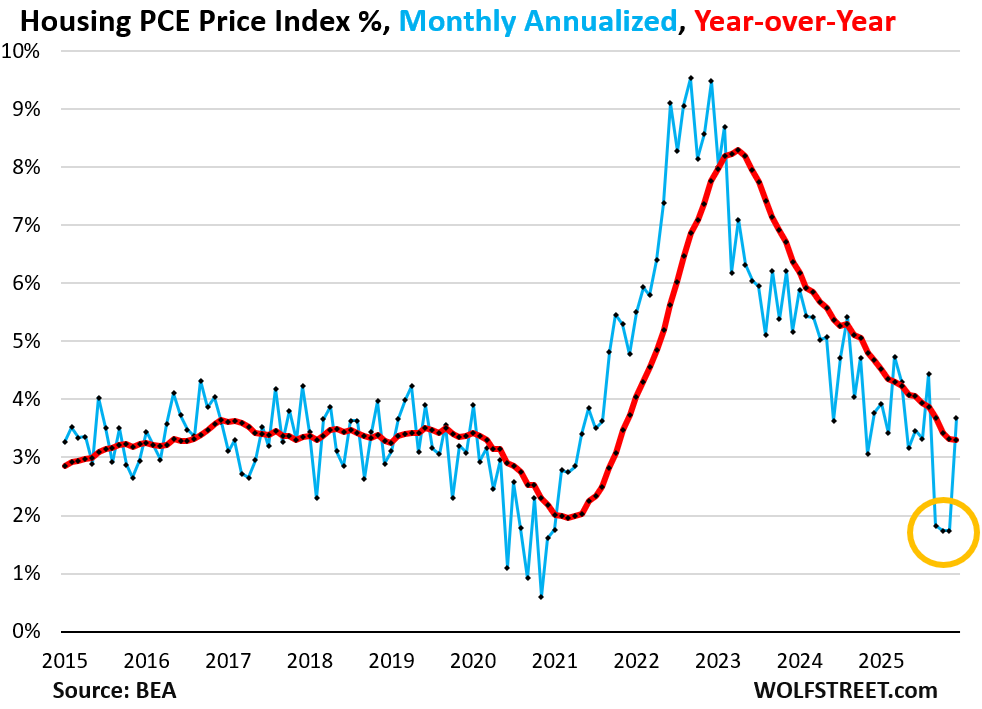
The major factor that drove that deceleration was the outlier deceleration in the CPI housing components, particularly Owners’ Equivalent of Rent (OER), a massive component that weighs 26% in overall CPI: Over a three-month period – September, October, and November – the clearly doctored ultra-low OER figures pushed down services CPI, core CPI, and overall CPI due to its massive weight, and those three months will continue to push down year-over-year readings until they fall out of the 12-month timeframe in the fall (my discussion here):
There are many differences between the PCE price index and CPI. One of them is that housing indices have much smaller weights in the PCE Price index.
The PCE price index also uses the rent data and the OER data from the same surveys as the CPI, but combined, rent and OER weigh about 17% in PCE while they weigh about 35% in CPI.
So the doctored OER data also pushed down the PCE price index and the overall index for housing inflation. But because it has much lower weight in the PCE index, the effect of the doctored OER is not nearly as much.
The chart of the overall housing PCE price index shows those three doctored months – September, October, and November – that will carry forward, lowering the index values for all times by that amount. This will continue to push down the year-over-year percentage changes until those three months fall out of the 12-month timeframe later this year.
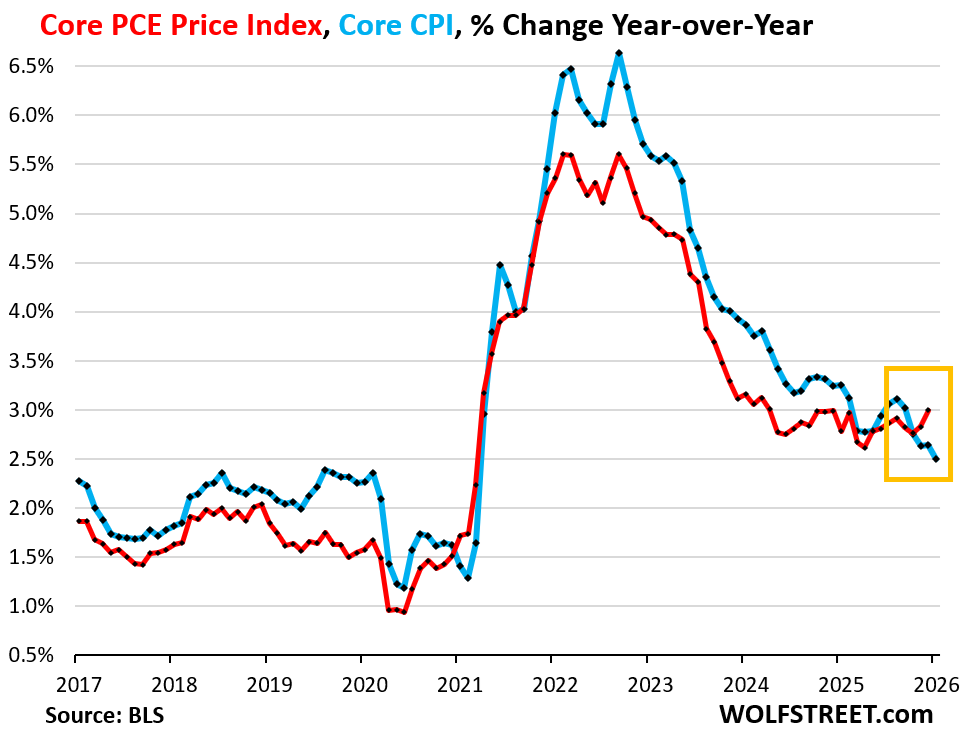
The PCE price index is suddenly higher than CPI.
Normally, the PCE price index shows lower inflation readings that CPI. That is one of the reasons the Fed prefers the PCE price index for its 2.0% inflation target.
But now they have gone in opposite directions, with the PCE price index and the core PCE price index accelerating and being substantially higher than CPI and core CPI respectively.
The chart shows the year-over-year change of the core PCE price index in red and of core CPI in blue. Note the divergence:
In addition, goods prices…
The PCE index for durable goods rose by 2.1% year-over-year, still pulling down the overall PCE price index, but less so than they did before.
Prices of motor vehicles, parts, and accessories, the largest category of durable goods, rose by just 1.2% year-over-year, with price drops in some categories and increases in others. Prices are still below where they had been in mid-2022.
Prices of recreational goods and vehicles, including consumer electronics, TVs, etc., have wobbled lower for years, but the memory chip shortage due to demand from AI servers have caused prices of computers and other electronics to rise recently. Still, the index is up by only 1.8% year-over-year.
But prices have been rising again in furnishings and durable household equipment, after the 30-months long plunge from mid-2022. Year-over-year, the PCE price index for furnishings and durable household equipment rose by 4.0%.
The PCE price index for food & nonalcoholic beverages purchased in stores for off-premise consumption jumped in December by 0.41% (+5.1% annualized), which pushed the year-over-year increase to 2.1%, having about doubled from 2024.
The Fed needs to pay attention.
The hot overall inflation data in the GDP release today (3.7%) and the accelerating consumer-facing inflation in the PCE price index today (2.9% and 3.0%) indicate that inflation is rumbling throughout the economy and is bubbling to the surface at the consumer end.
There is a lot of stimulus in the economy – government deficit spending, tax cuts for companies and individuals, massive corporate investments in anything related to AI, and too-low interest rates and spreads. Under these combined conditions, inflation isn’t going to sleep.
The Fed is relying – thankfully this time – on the PCE price index as its yardstick. In the minutes of the last Fed meeting, which preceded today’s inflation data, the topic of rate hikes already cropped up for the first time in a while:
“Several participants indicated that they would have supported a two-sided description of the Committee’s future interest rate decisions, reflecting the possibility that upward adjustments to the target range for the federal funds rate could be appropriate if inflation remains at above-target levels.”
In case you missed it: Hot Inflation & Plunge in Federal Government Spending Slam Real GDP. But Trade Deficit Least Bad in 2 Years
Enjoy reading WOLF STREET and want to support it? You can donate. I appreciate it immensely. Click on the mug to find out how:

![]()
Thanks, Wolf. Now please, get some rest!
🤣 fixin to
I love this stuff Wolf, you know why? Because you give me a glimpse into the future. Its nice to know ahead of time what the talking heads choose not to tell.