But their massive capital gains, realized and unrealized, are not included here.
By Wolf Richter for WOLF STREET.
Americans’ personal income – which rose 4.3% year-over-year in November to an annual rate of $26.4 trillion – came from their wages and salaries, from their small businesses and farms, from their rental properties, from dividends and interest income, and from transfer receipts from the government, such as Social Security benefits paid to retirees. And we’re going to look at that in detail.
But the massive capital gains are not included in this income, neither on homes nor on investments, which is a huge factor in the US:
About 65% of households own their own home, about 62% own stocks, a significant part holds precious metals and cryptos. But the massive capital gains – realized or unrealized – over the past many years are not counted here as income.
Stock ownership is widespread: 87% of households with more than $100,000 in income own stocks, according to Gallup. So is that the upper crust?
The median household income for married-couple families in the US was $120,217 in 2024, per the Census Bureau. “Median” means that 50% of all married couple-households made over $120,217 in income in 2024, and 50% made less than $120,217.
So, well over 50% of married-couple households earn more than the $100,000 threshold for the 87% stock ownership category.
For nonfamily households – a person living alone or unrelated people living together – the median household income was $49,848 in 2024, according to the Census Bureau. And the overall median household income was $81,604 in 2024.
Among households with incomes between $50,000 and $100,000, 71% are invested in stocks.
Even among the lower-income households (less than $50,000), 28% hold stocks, according to Gallup.
And it starts early: Among young people (18-29 years old), 44% are invested in stocks. Gallup did not provide data on holdings of cryptos, and young people are deeply into them. And Gallup didn’t provide data on precious metals either.
All these investments – real estate, stocks, cryptos, precious metals – had huge price gains over the past 10 years, leading to massive realized and unrealized capital gains, but they’re not included in the income figures here.
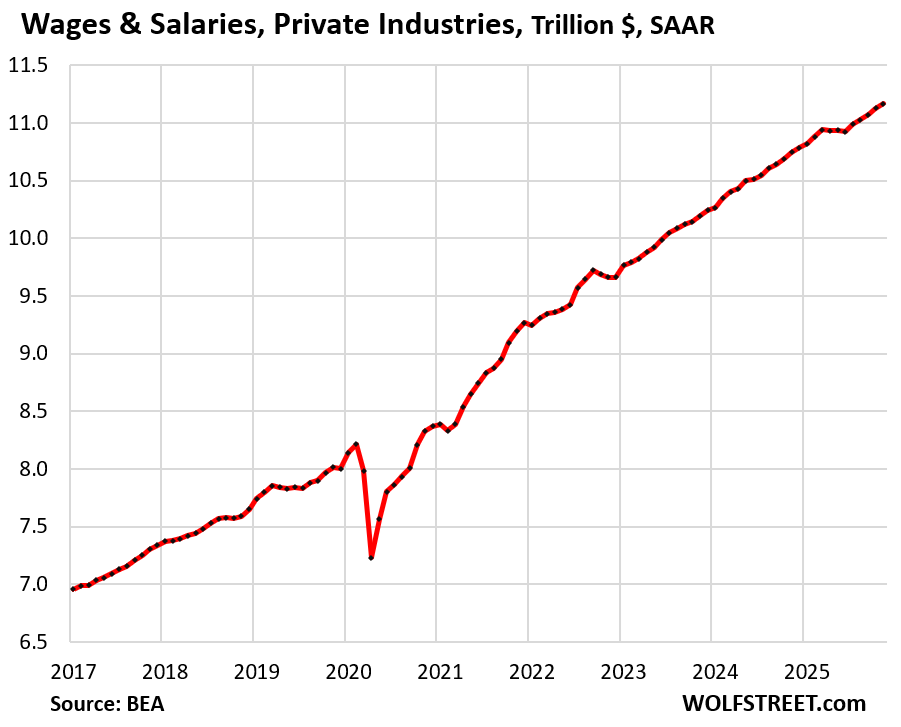
Wages & salaries in private-sector industries rose by 3.9% year-over-year to an annual rate of $11.2 trillion, according to data from the Bureau of Economic Analysis.
They accounted for about 39.2% of pre-tax personal income.
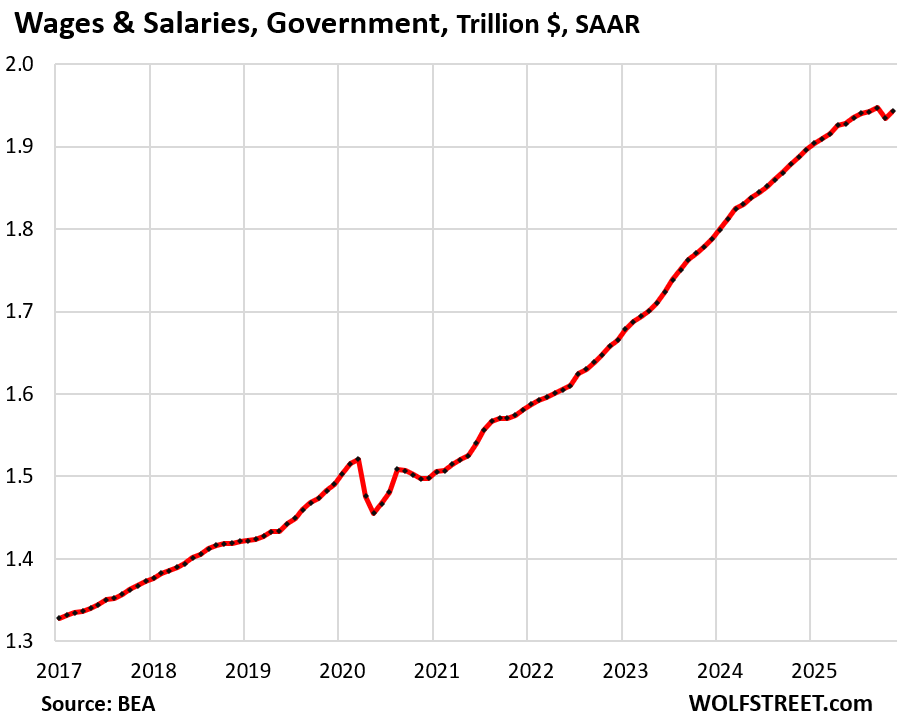
Wages & salaries in government rose by 3.0% year-over-year to an annual rate of $1.94 trillion in November.
In October, there was a drop in income as employment at the federal government plunged by 179,000 jobs, largely the result of workers who’d volunteered to exit earlier in 2025 but who, as part of their severance package, had continued to receive salaries through September 30.
So the uptick in income in November from October did not set a new record, but was below the September record.
Government wages & salaries accounted for 6.8% of pre-tax personal income.
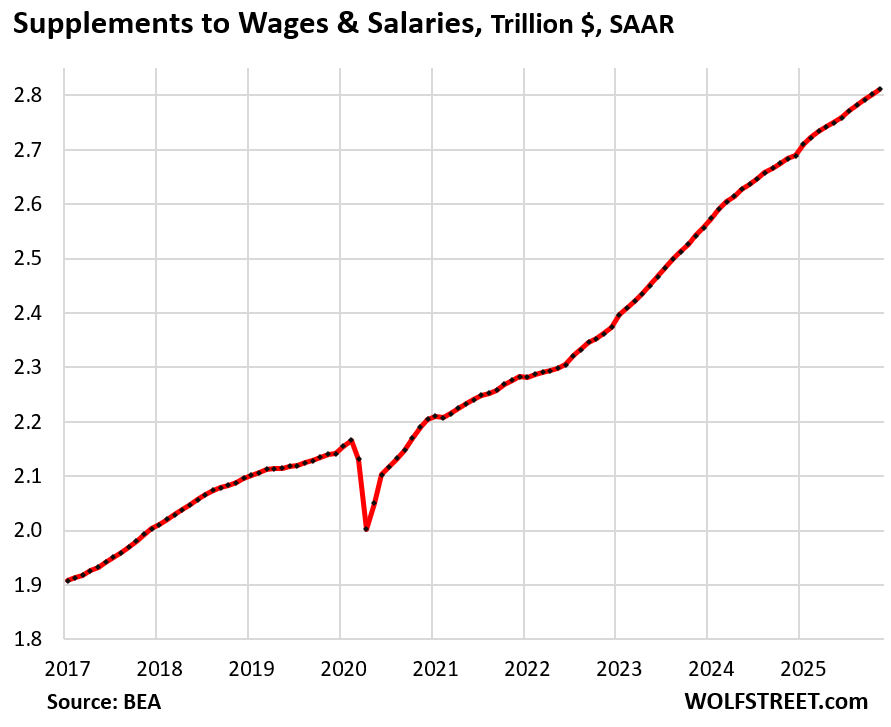
Supplements to wages & salaries rose by 4.8% to an annual rate of $2.8 trillion in November. These are the amounts employers paid for their employees in two categories:
- $1.89 trillion: Employer contributions to 401(k)s, retirement funds, and pension and insurance funds.
- $0.92 trillion: Employer contributions to Social Security, and other government social insurance.
Supplement to wages & salaries accounted for 9.9% of pre-tax personal income.
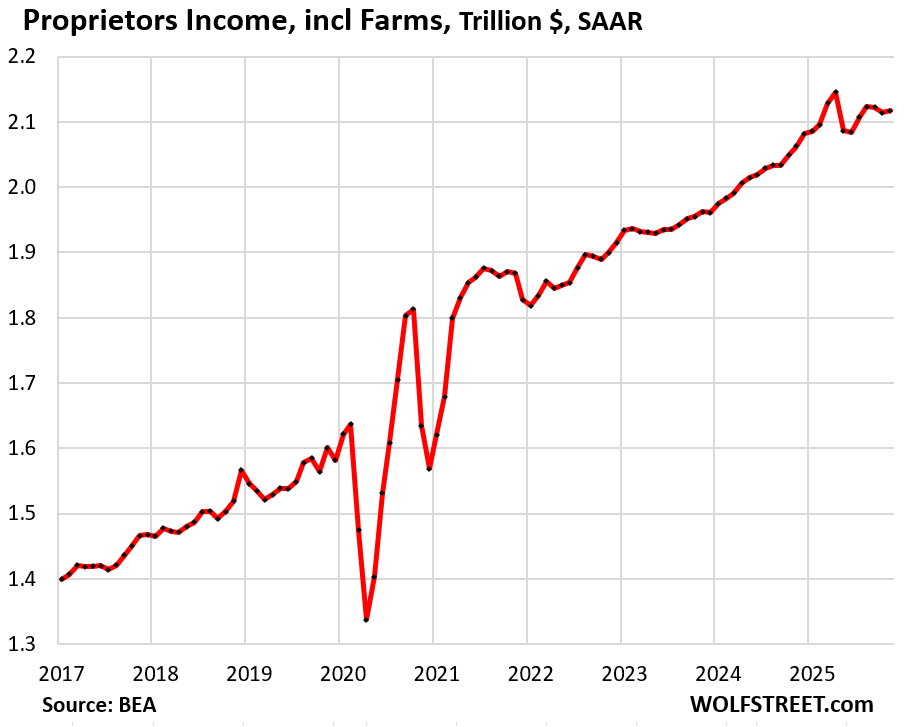
Proprietors’ income from personally owned small businesses and farms rose by 2.6% year-over-year to an annual rate of $2.12 trillion, nearly all of it from businesses ($2.05 trillion annual rate), and very little from farms ($68 billion annual rate).
It accounted for 7.4% of pre-tax personal income.
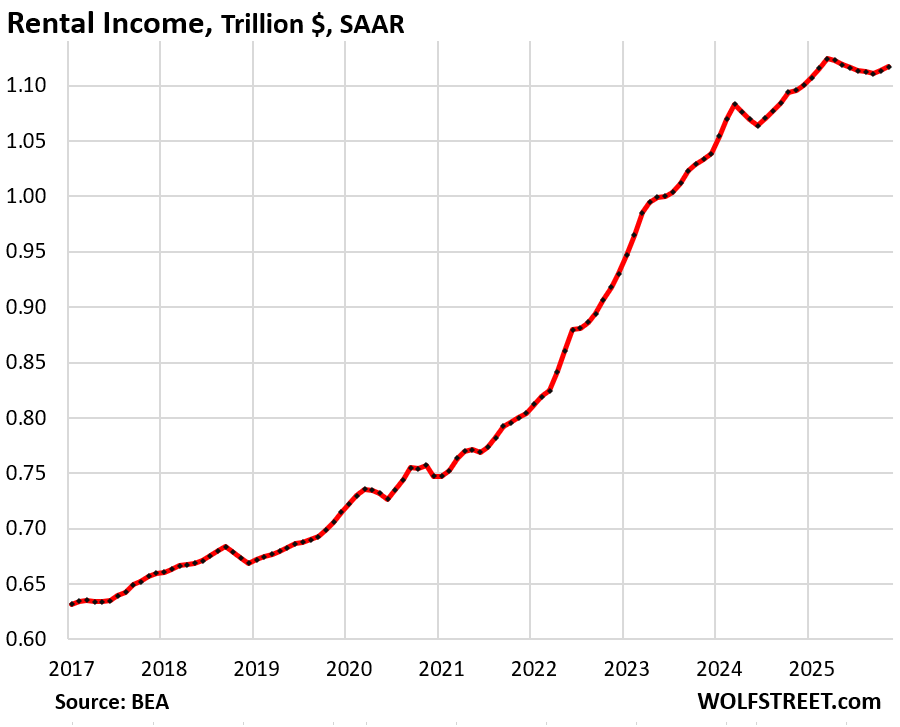
Rental income from personally owned rental properties rose by 2.0% year-over-year to $1.11 trillion.
Roughly 11 million single-family homes are owned by mom-and-pop landlords (1-9 units), and many condos are owned by mom-and-pop landlords, either for long-term rentals or short-term vacation rentals. And these mom-and-pop landlords often have a day job, and managing their rental properties, which is at least a part-time job, puts them into the category of the infamous “multiple jobholders.”
Rental income accounted for 3.9% of pre-tax personal income.
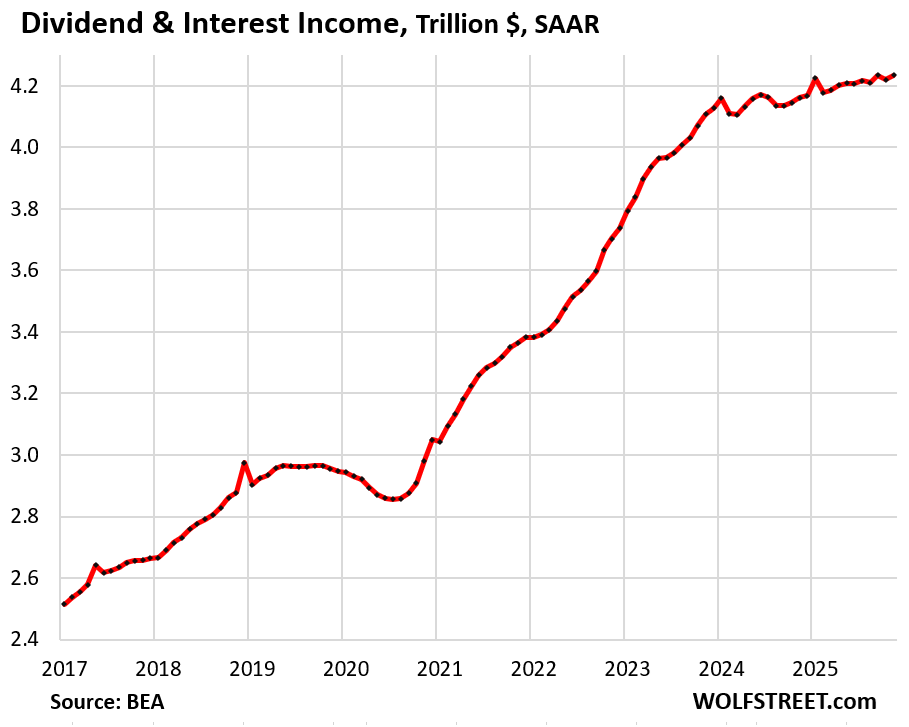
Dividend and interest income rose by 1.7% year-over-year to an annual rate of $4.23 trillion.
Americans hold lots of bonds, money market funds, CDs, savings accounts, etc. Households have $4.8 trillion stashed in money market funds alone; there are $3.5 trillion in CDs outstanding. We discussed that pile of interest-earning investments here.
In addition, dividend income from stocks is substantial. While capital gains from stocks are not counted as income here, dividends from stocks are counted.
Income from dividends and interest accounted for 14.9% of pre-tax personal income.
Personal transfer receipts rose by 8.8% year-over-year to an annualized rate of $5.06 trillion. This includes Social Security benefits paid to retirees, Medicare and Medicaid benefits paid to healthcare providers, unemployment insurance, VA benefits, etc.
- Social Security benefits: $1.58 trillion
- Medicare: $1.27 trillion
- Medicaid: $1.07 trillion
- Unemployment insurance: $0.04 trillion
- Veterans’ benefits: $0.31 trillion
- All other: $0.69 trillion
The year-over-year increase was in part driven by the rapidly growing number of boomers receiving Social Security benefits and by an expansion earlier in 2025 of who receives Social Security benefits, which included a one-time payment of catch-up benefits in April, which caused Social Security benefit payments to surge in 2025.
Personal transfer receipts accounted for 17.8% of pre-tax personal income.
The massive spikes during the pandemic were the annualized rates of the stimulus programs, forgivable PPP loans, etc. Annualized rates roughly multiply a monthly figure by 12, and seasonally adjust it, so when unique things happen, such as a one-time stimulus payment, it is also multiplied out as if it would occur every month for 12 months in a row to produce an annual rate, and then over the next few months when those one-time payments no longer occur, it all collapses again. I have loudly but vainly complained about annual rates during the pandemic, when they were producing these grotesque results in a lot of economic reporting:
![]()
Enjoy reading WOLF STREET and want to support it? You can donate. I appreciate it immensely. Click on the mug to find out how:

![]()
Why are stock dividends counted but capital gains from stocks not counted?
Where would that be counted?
Capital gains are not counted in personal income; they’re not counted in GDP either. Nor are losses. When money from capital gains gets spent on goods and services or invested in fixed assets, then it’s counted in consumer spending and GDP.
It must be unrealized gains
Ok, thanks.
Kind of confusing, because it is taxed if you sell it for a gain.
By the way, bear with me, I am still learning…haha
One would think realized capital gains would be included in a metric somewhere, even if not in this particular metric. I know the IRS thinks that I must pay income tax on any capital gains from stock sales.
They’re not included in GDP either. None of the economic growth figures includes capital gains. And that’s how it should be. Once people spend those gains, then that spending is included.
Are annuities, pensions (private, military and civil service), and IRA & 401(k) withdrawals (RMDs) included in personal transfers, or are they too small to be counted?
Distributions from annuities and pensions are excluded from income on the logic that they’re a reduction of your assets you squirreled away previously, some with IRA or 401k distributions.
I was really surprised to learn 62% of households own stocks. I would have guessed half of that.
@Gabriel remember every “person” in every “household” does not own stock so the percentage of “people” that own stock will be lower.
Are we talking about realized gains ?