For the US overall, worst sales for any December on record. The housing market took a bad turn, from already low levels.
By Wolf Richter for WOLF STREET.
Pending home sales, which track the number of contracts signed in December, plunged by 9.3% seasonally adjusted from November, to the lowest level for any December on record in the data by the National Association of Realtors, which goes back to 2010. Compared to December 2010, during the Housing Bust, pending sales were down by 21.5%.
The market is now well into its fourth year of the collapse in transactions, and there has simply been no improvement.
Pending home sales compared to the Decembers in prior years (historic data via YCharts):
- 2024: -3.0% (year-over-year)
- 2023: -8.1%
- 2022: -5.9%
- 2021: -38.2%
- 2020: -43.2%
- 2019: -30.6%.
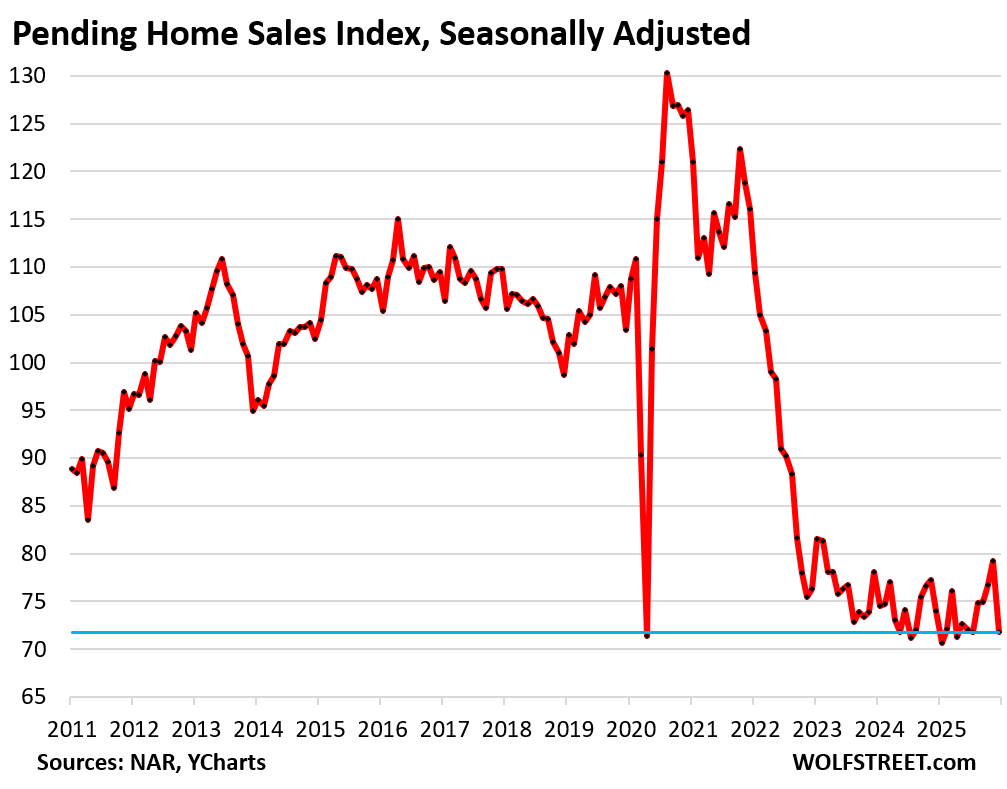
The metric of pending sales tracks contracts that were signed in December but that haven’t closed yet and could still get canceled because buyers cannot afford homeowner’s insurance, or cannot sell their own home, or for other reasons. The rate of cancellations has been running high in 2025.
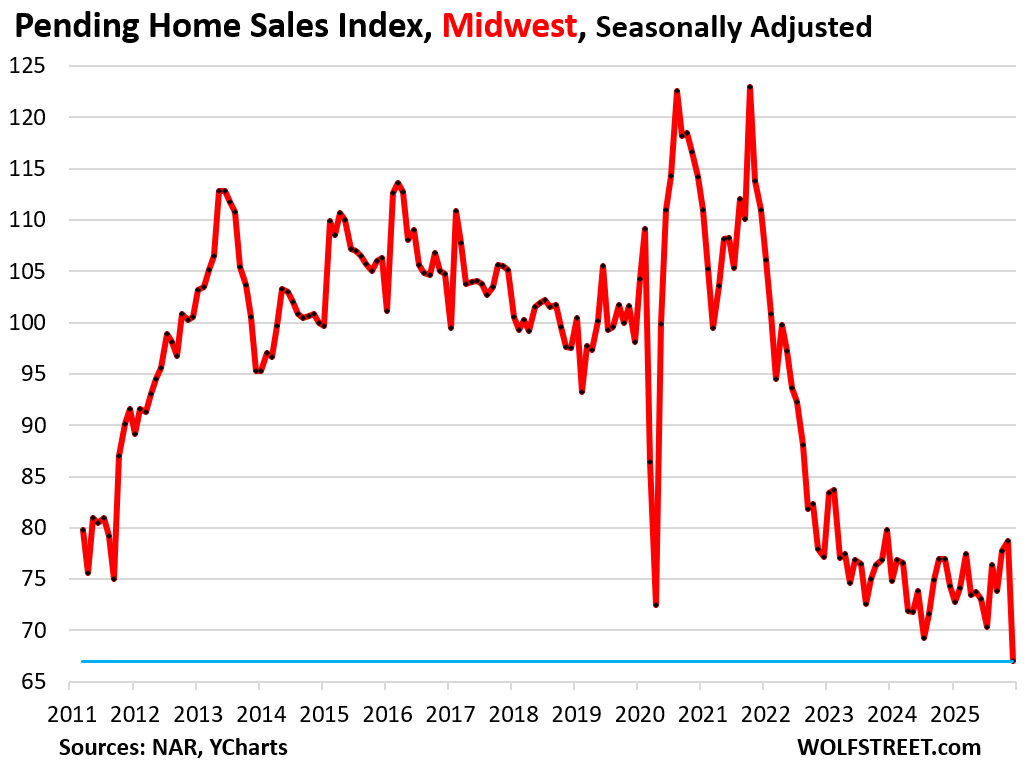
The December downturn in pending sales occurred in all four regions, from already low levels, but was particularly pronounced in the Midwest, where sales collapsed by 14.9% seasonally adjusted to a new record low.
Pending home sales by region.
A map of the four Census Regions is posted in the comments below.
In the Midwest, pending sales plunged by 14.9% seasonally adjusted in December from November and by 9.8% year-over-year, to a new record low level of sales in the data going back to 2010.
Compared to the Decembers of prior years:
- 2024: -9.8% (year-over-year)
- 2023: -16.0%
- 2022: -13.2%
- 2021: -39.6%
- 2020: -41.3%
- 2019: -31.7%.
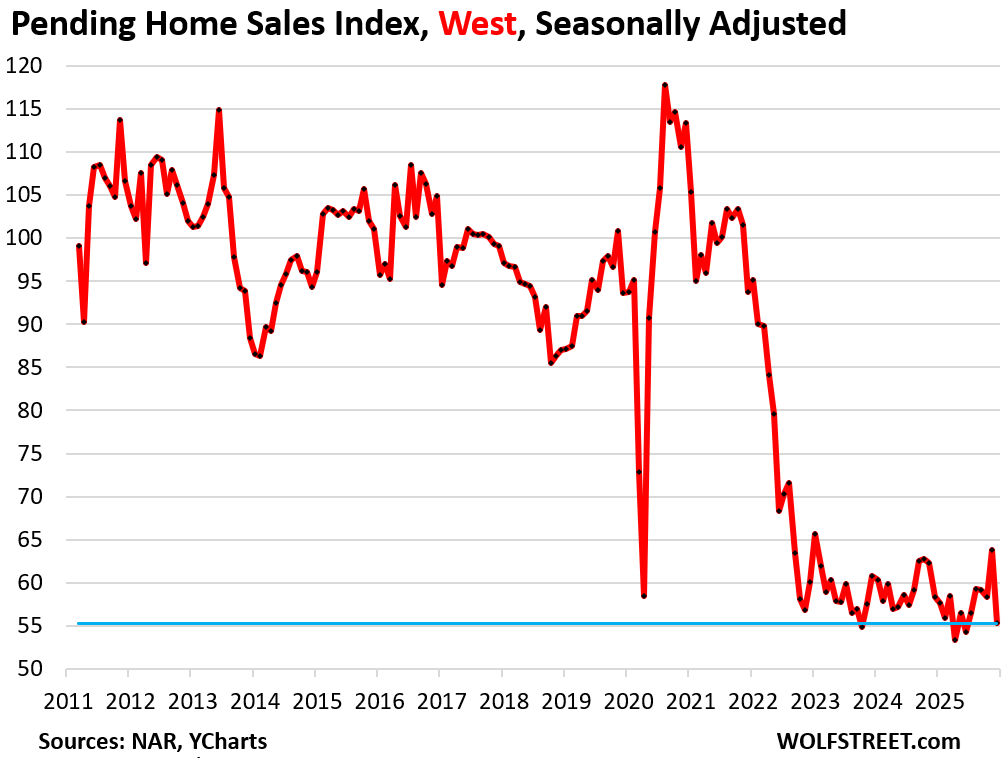
In the West, pending sales plunged by 13.3% in December from November, seasonally adjusted, to the worst level of sales for any December on record, and to the fourth-lowest level of sales for any month.
Compared to the Decembers of prior years:
- 2024: -5.1% (year-over-year)
- 2023: -9.0%
- 2022: -8.0%
- 2021: -41.0%
- 2020: -51.2%
- 2019: -40.9%.
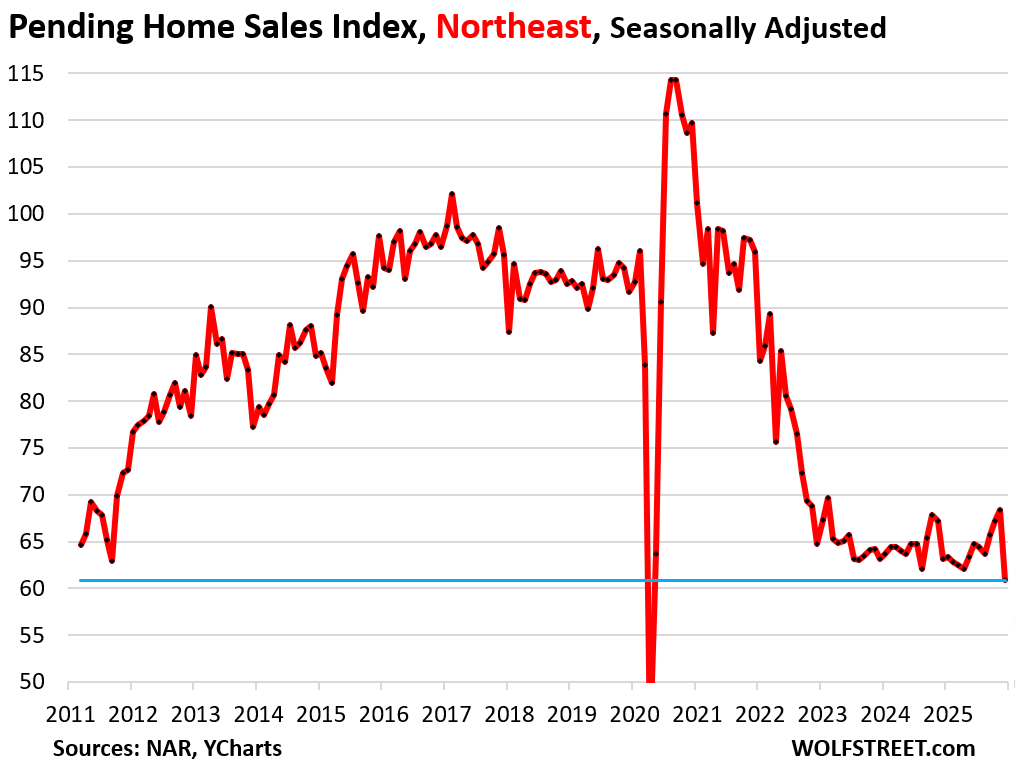
In the Northeast, pending sales plunged by 11.0% month-to-month, to the second-worst level of sales on record.
Compared to the Decembers of prior years:
- 2024: -3.6% (year-over-year)
- 2023: -3.5%
- 2022: -6.0%
- 2021: -36.5%
- 2020: -44.5%
- 2019: -33.9%.
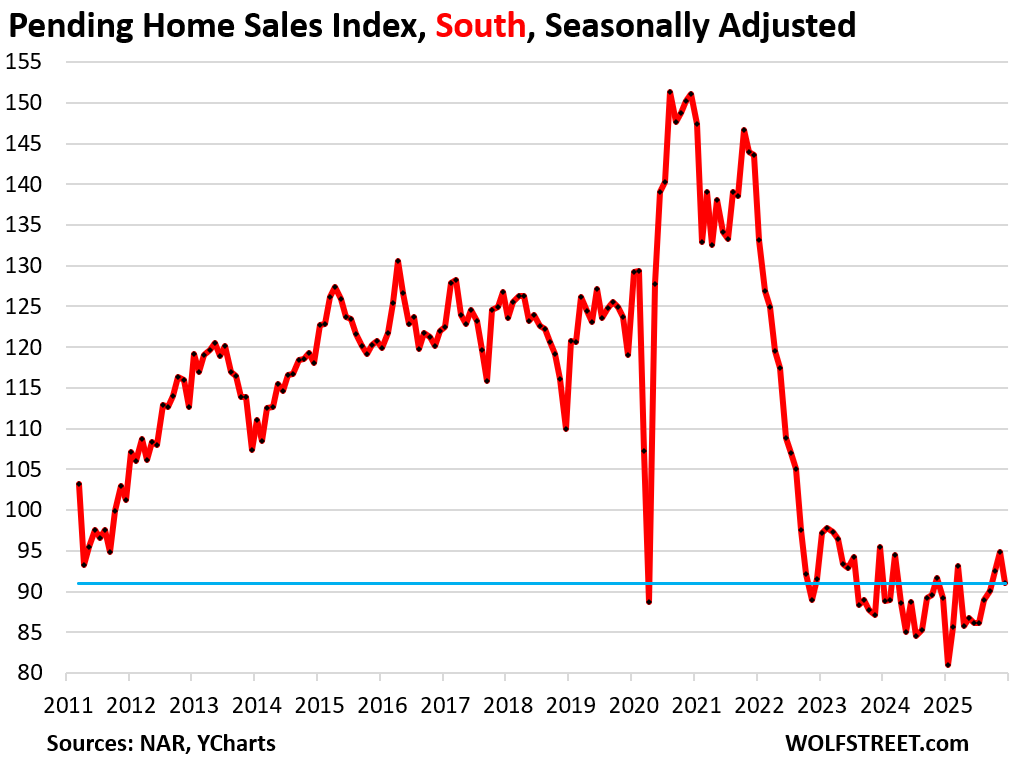
In the South, pending sales fell by 4.0% in December. Compared to the Decembers of prior years:
- 2024: +2.0% (year-over-year)
- 2023: -4.7%
- 2022: -0.7%
- 2021: -36.6%
- 2020: -39.8%
- 2019: -23.5%.
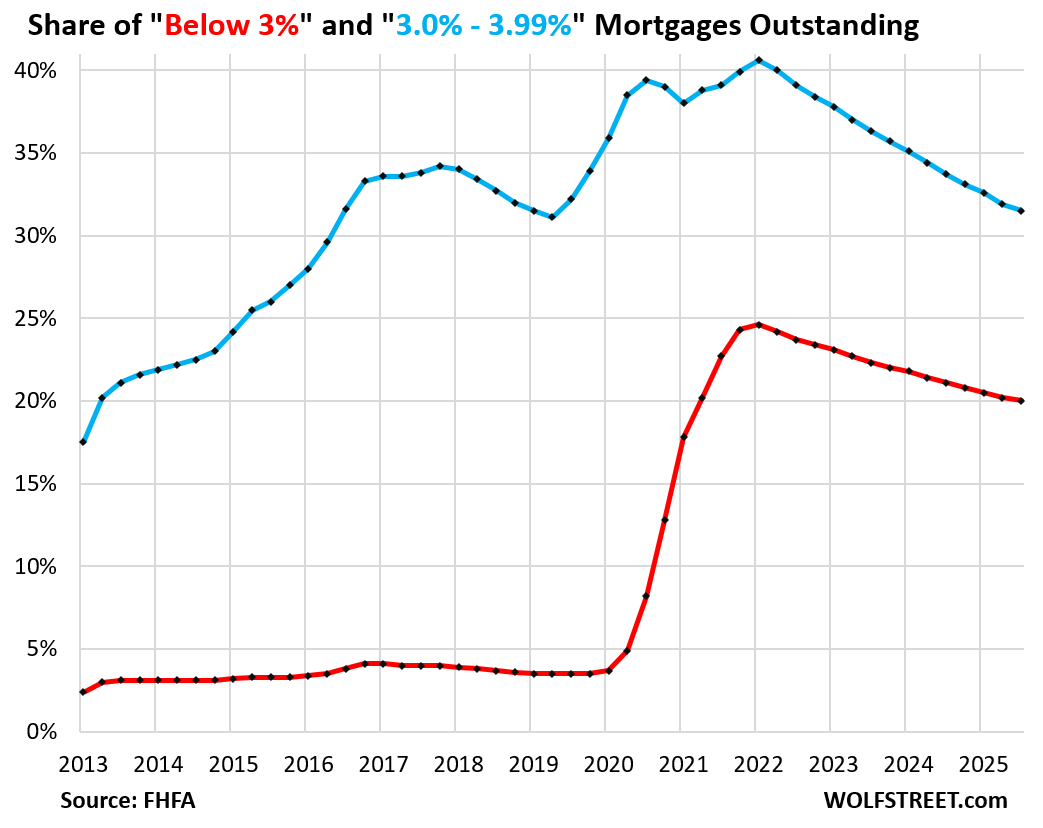
At fault are the ultra-low mortgage rates of 2020-2022 that ended up destroying the housing market in two ways: By causing prices to explode in a two-year time span, and by “locking in” homeowners with ultra-low mortgage rates who now cannot afford to move, which has destroyed the dynamics that come with a functioning housing market, such as mobility, where people are able to move.
The unwinding of the below-4% mortgage rates is occurring, and so the lock-in effect is gradually loosening as these mortgages get paid off nevertheless, but at a snail’s pace [“Locked-in” Homeowners Nevertheless Pay Off Below-4% Mortgages: their Share Drops to Lowest since Q4 2020
Enjoy reading WOLF STREET and want to support it? You can donate. I appreciate it immensely. Click on the mug to find out how:

![]()
The four Census Regions of the US:
To realtors who may be struggling to find work right now, try these helpful tips:
– cut back on avocado toast
– make your own coffee instead of buying Starbucks
– get a fifth or sixth job like DoorDash for spending cash
– sell some old NFTs you may be sitting on
The Ministry of Truth states “simulations prove the average meal costs $3”, so you should be able to feed yourself on $15 a day. If you find yourself spending more, you’re living a life of luxury with room for cutbacks.
Tough times ahead. It’s taken 4 years for a 4% mortgage to drop from 40% to 30% of all loans. I can’t imagine it being folks paying off their mortgage, rather locked into a smaller home, or cost burdened.
Good article. Curious to see how this trend will affect those with ARMS.
“Curious to see how this trend will affect those with ARMS.”
I have seen more in the northeast homes for sale for this time of year,some move/many sit,have seen in N.H. some better pricing to a degree,perhaps my time is coming.
I will say as a stacker of pm’s am not sure whether to celebrate and party or cry and bunker down,luckily,both options available.
Me too but then I think better to live life and die than struggle to survive. We only have one life and that too limited time ( at least for old folks ).
Different strokes for different folks but I believe in ‘Die with Zero’.
Not bashing on the data or analysis which is always spot on. Appreciate you putting these together, Wolf. Honest question though, is December really meaningful for us since the “prime time” to sell/list is in the early Spring?
For markets like mine it is. When weather is in the 60s and 70s, people go outside more. Look at what happened in 24 with rates from Nov 23 to May of 24 to see what happened then. I’m not saying the rate of change will be similar, but ultimately rates increase through that time frame. Maybe this time is different?
The data is seasonally adjusted. The issues are about the same every December. And seasonal adjustments compensate for it. NAR, which is always painstakingly optimistic, also made downcast comments about the turn of events.
One month is never all that meaningful, it’s just one month, which is precisely why I give you the long-term charts so you can see long-term how that one month fits in.
Investors love holiday shopping. Banks sitting on foreclosures and people who really need to sell are the ones left, properties that after several months have to drop prices to move. Since it’s relative, YOY, it does matter. One thing the above data tells you is that even flippers are not jumping at the reduced winter prices. They’re not at the foreclosure auctions as much either.
The other negative affect and pandemic era distortion caused by the lack of listings listed above. The supply of homes for sale is held down, preventing normal supply and demand adjustments. People wanting to live in desirable neighborhoods will pay the high price. Prices there are frozen at high levels because of the shortage of listings. In less desirable neighborhoods, we’re seeing price plunges as people drop their prices to get bids on their distressed properties.
I live in Gulfport Florida part of St Petersburg. Homes and Condos between 100K and $450K are struggling. Over 90 days old in the listings. On the other Hand the New 42 Story in Downtown has all of the Condos starting at over 1 million with robust sales. There is another 50 plus storied building with units starting in the $750K and up range that are in progress and over 25% have agreements to purchase. Just an Observation
Why weren’t 100% of all units presold – to then be resold by these condo flippers usually before construction is completed? That’s how it used to be. Preconstruction sales were a big thing. They partially funded those developments. Where are those buyers? Why do developers STILL own those units?
Relief is coming. 50-100 basis cuts coming in a few weeks, combined with corresponding declines in mortgage rates. It’s all part of a grander plan! Plus with midterms coming up all those affordability promises definitely will happen. Time to crack a Modelo.
You still didn’t get the memo? In 2024, when the Fed cut by 100 basis points, mortgage rates rose by 100 basis points! The bond market said: ” Make my day.”
The Fed sets its overnight policy rates, the bond market sets long-term rates including those of MBS, which determine mortgage rates. If the bond market is worried about a lax Fed and worsening inflation, long-term rates go up, no matter what the Fed does on the front end.
Should have labeled my post pure sarcasm!
🤣👍
I thought that was a possibility because you assiduously checked off all the points, but here in the trenches, I think a lot comments are sarcasm, when they aren’t. So it’s always good to note, or deal with the fallout.
Wish charts went back to the turn of the century to offer greater perspective by including the lead up to, and the housing crash of the late 00s.
RTGDFA
Crazy. The housing bulls assured us sales would boom once 30 yr mortgages went back to a 5 handle. Wrong again bulls. Sales won’t boom until prices come down