Demand for electricity has surged, and so has the price.
By Wolf Richter for WOLF STREET.
Americans spend a lot of money on gasoline, and gasoline prices have plunged off the horrendous spike that peaked in mid-2022 and then zigzagged lower, but remain substantially higher than before the pandemic. The plunge in gasoline prices over these years was a substantial contributor to the cooling of overall CPI inflation.
But that’s not the case for the two other major energy costs that consumers pay for directly – electricity and natural gas piped to the home. Electricity costs have soared from record to record, and natural gas costs have risen substantially over the past 18 months.
The Consumer Price Index for electricity has surged by 6.7% year-over-year, and by 41% since January 2020. The price that households pay for electricity on their monthly bills – unlike the prices they pay for commodity-based fuels such as gasoline or natural gas – is not volatile. It’s largely set by regulated utilities that face no competition other than from rooftop solar installations. Monthly charges are a mix of fixed fees, service charges, and charges per kWh used. And they add up.
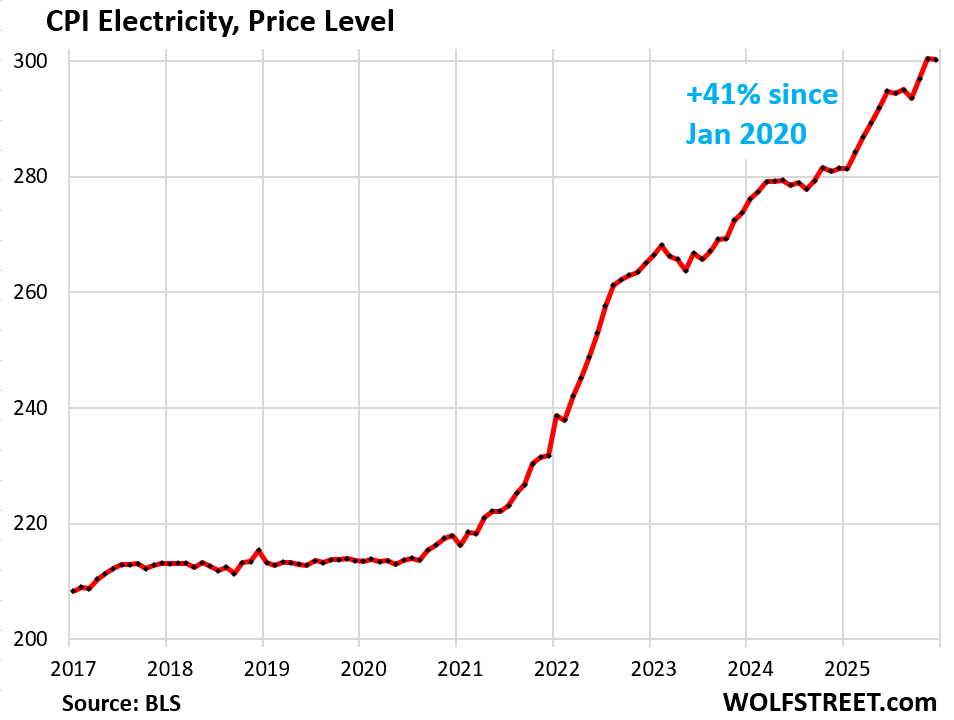
The surge in demand for electricity by AI data centers is now causing upward pricing pressures at some grid operators.
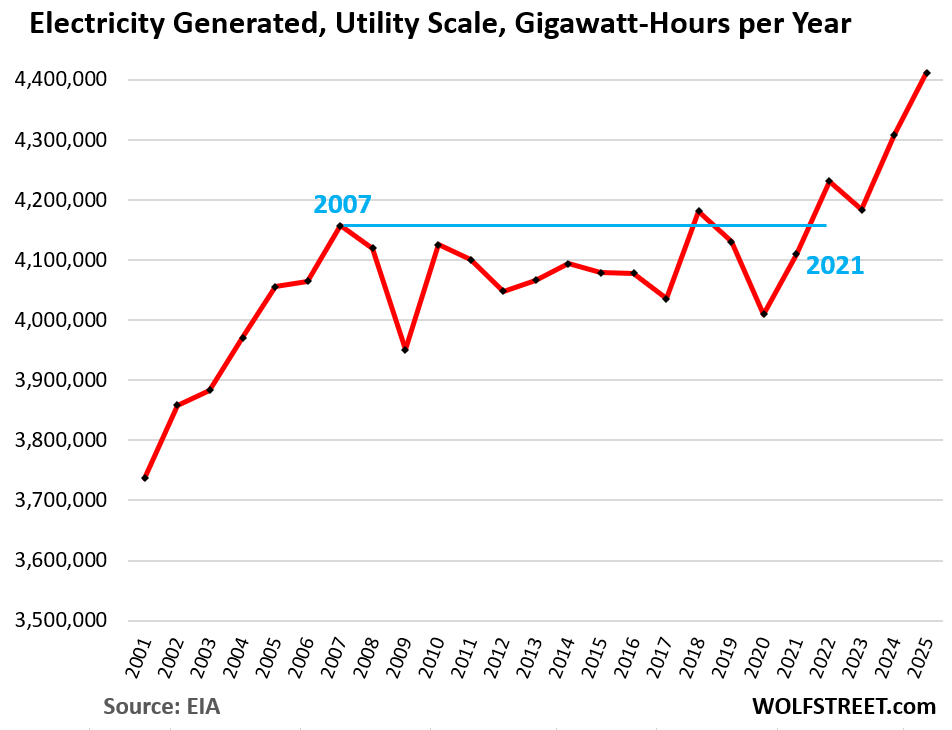
But that surge in demand is only a recent factor, largely in 2024 and 2025; that’s when the quantity of electricity generated began to surge, after spending 15 years in stagnation.
The chart below shows net generation of electricity in gigawatt-hours by utility-scale power generators (excludes rooftop solar). Per EIA data, generation in 2025 through October rose by 2.4% year-over-year. November and December 2025 are estimates. In 2024 and 2025 combined, net generation rose by 5.4%.
The AI-infrastructure buildout has only recently taken off, with many data centers not yet completed or not yet connected to the grid, and many more data centers being planned. The EIA estimates that demand for electricity will continue to surge in 2026 and 2027.
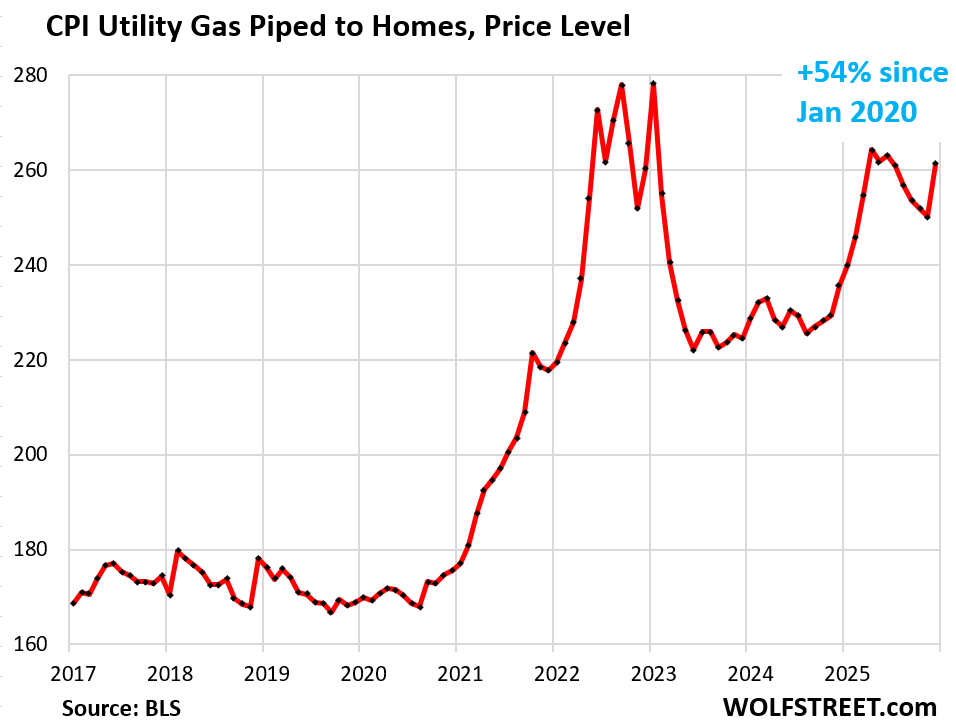
The CPI for natural gas piped to the home has surged by 10.8% year-over-year and by 54% since 2020.
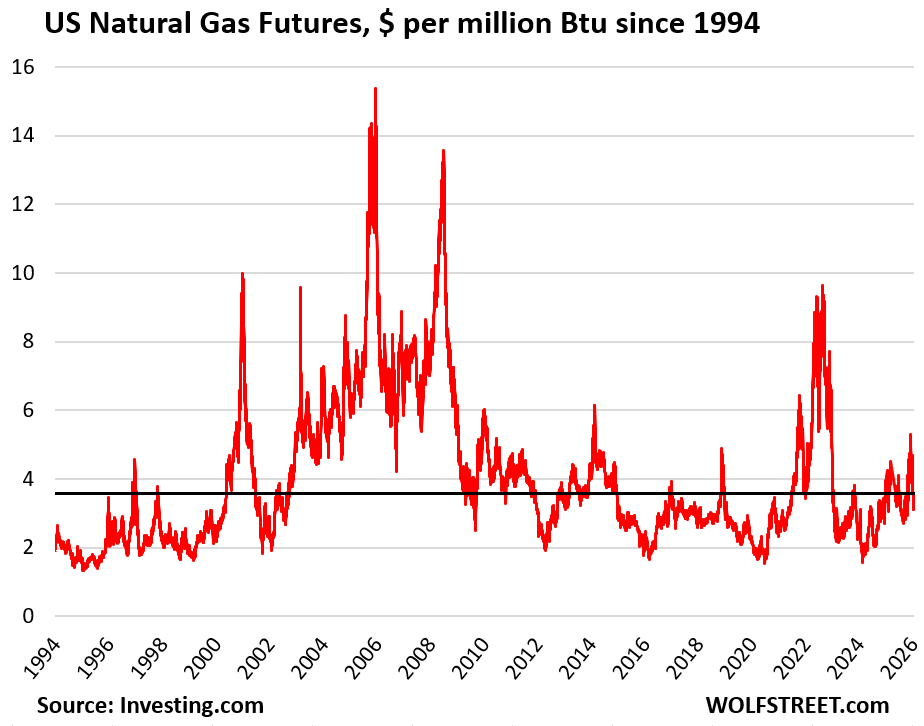
The US has been the largest natural gas producer in the world for over a decade. Surging production triggered a natural gas glut around 2009 that caused the price of natural gas futures to collapse; and except for brief spikes, it remained low, most of the time between $2 and $4 per million Btu., despite the surge in natural gas exports, and increased demand from power generators (replacing coal) and industrial companies.
The price has recently fallen back into that range (currently $3.57 per million Btu). But that’s not the price that households pay their utilities.
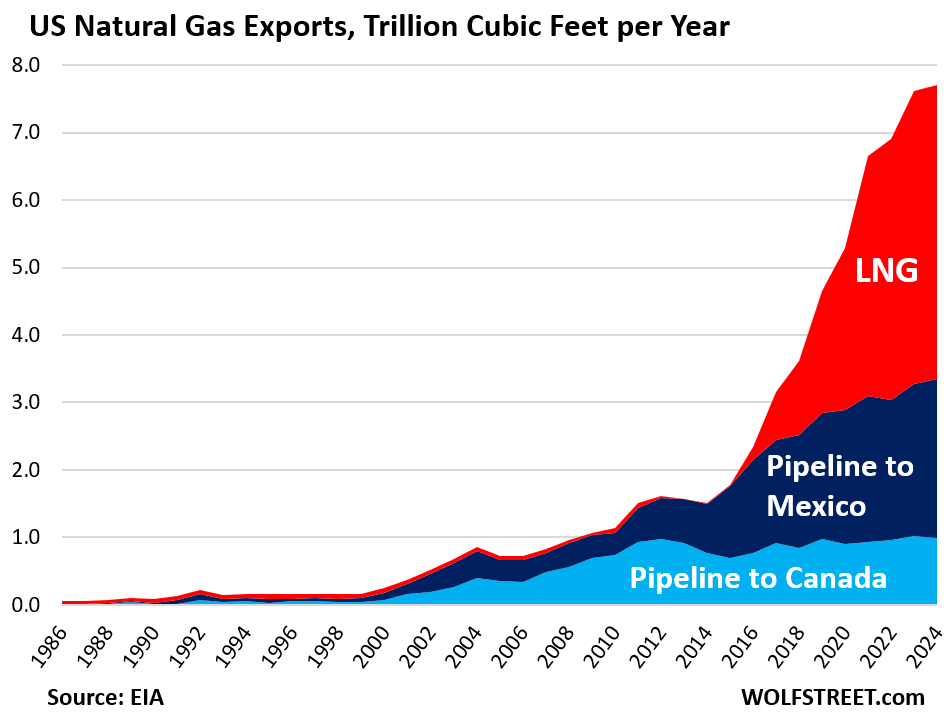
Exports via pipeline and since 2016 via LNG have created lots of new demand. The US has become the largest LNG exporter in the world, and new export terminals have been coming on line every year. The US also exports large and growing quantities of natural gas to Mexico via pipeline. It also has a bilateral natural gas trade with Canada, importing more from Canada than exporting to Canada as some regions in both countries are not well connected via pipelines to their producing regions, such as New England, which gets most of its natural gas from Canada.
Growing exports, growing demand by power plants, and growing use by industrial users and as feedstock in the huge US petrochemical industry are piling a lot of demand on US natural gas production. So far, production growth has been able to keep up.
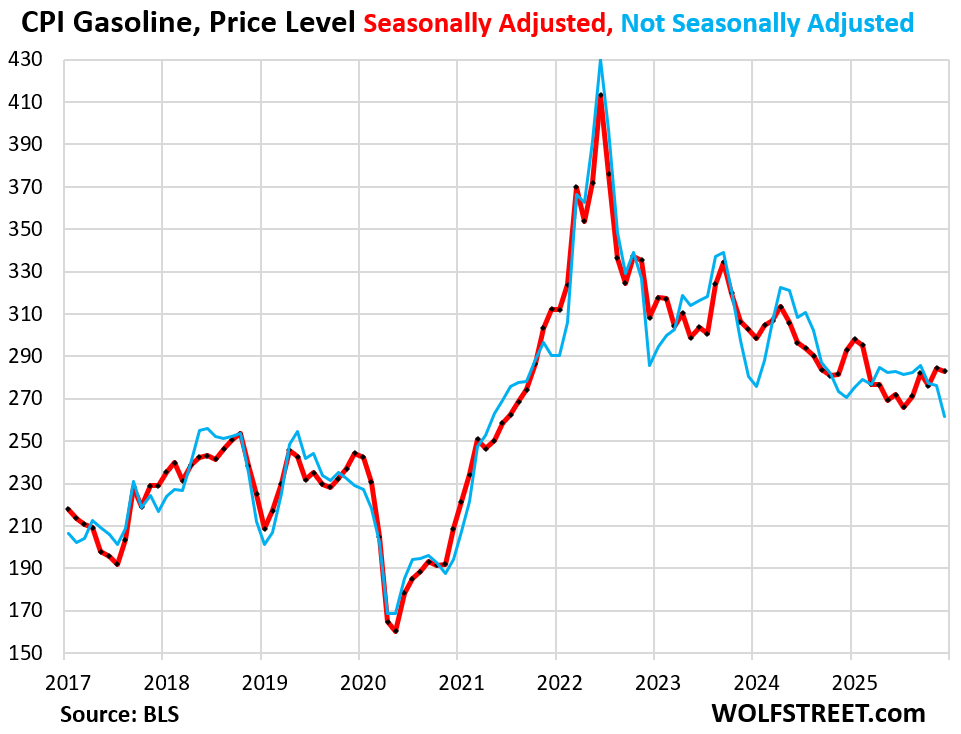
The price of gasoline has plunged off the peak of the spike in mid-2022. The average price for the US fell below $3 a gallon in mid-December and by the weekly measure on January 12 had dropped to $2.91, according to EIA data. But that’s the average. In some states prices are a lot lower already; for example, Texans paid on average $2.45 per gallon and Coloradans $2.40, while Californians paid over $4.00 a gallon (the state is not connected via pipeline to other US oil producing regions).
The CPI for gasoline reflects the national average. In December, on a not-seasonally adjusted basis, it dropped to the lowest since April 2021, and was down 3.4% year-over-year (blue line).
Winter is usually the seasonal low-point, with driving season over the summer forming the high point. And the recent drops in the price were less than normal during this time of the year. So an a seasonally adjusted basis, gasoline had ticked up in the fall (red line).
This large drop in the price of gasoline since mid-2022 helped push down overall CPI.
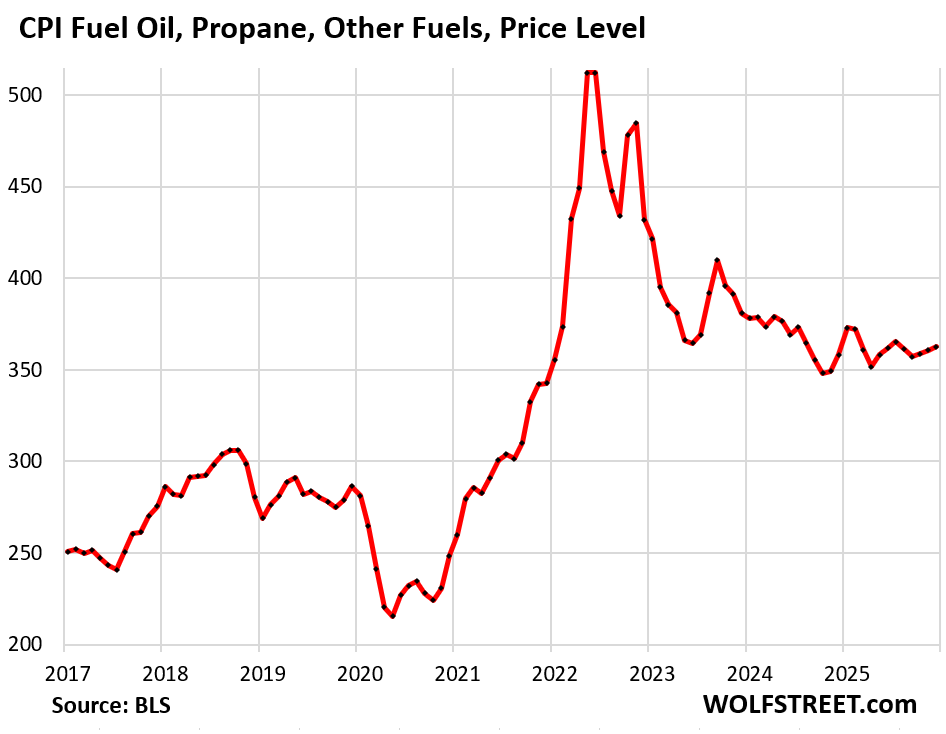
The CPI for “Other fuels” (fuel oil, propane, kerosene, firewood, etc.) had spiked by 63% from January 2020 through mid-2022, and then gave up a portion of that spike. It remains 29% higher than in January 2020. Year-over-year, the index is up 1.2%:
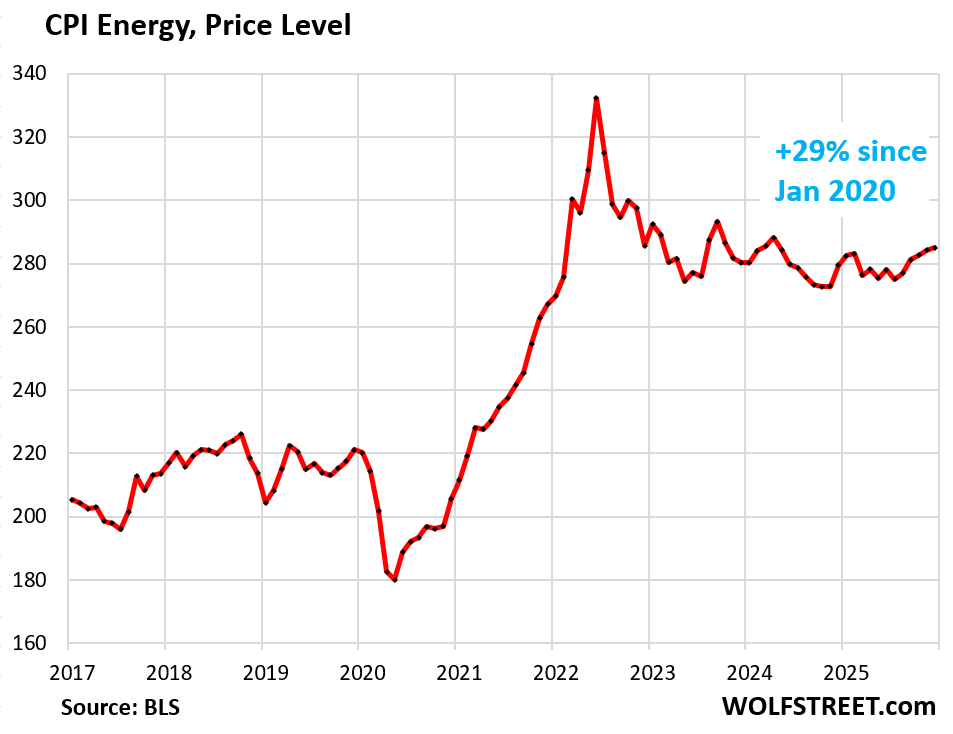
All combined, the overall energy CPI that tracks the above categories of energy that consumers pay for directly has flattened out for the past three years at very high levels, with falling gasoline prices (accounting for nearly half of the overall energy CPI) roughly balancing out the rise of electricity prices.
Inflation is the rate of change of prices. And the rate of change of energy prices has cooled, due to the drop in gasoline prices. In December, the energy CPI was up by 2% from a year ago. But it remains high, up by 29% from January 2020.
Enjoy reading WOLF STREET and want to support it? You can donate. I appreciate it immensely. Click on the mug to find out how:

![]()
Wolf,
Any thoughts on large scale solar farms as viable energy sources to help with the burgeoning electrical demands? Current administration not keen on solar and wind, but with the tidal wave of demand surging, any and all options are necessary. Comments?
With data through 2024. Data for 2025 will become available at the end of February, at which point I will post my annual “Power Generation by Source” article:
https://wolfstreet.com/2025/02/27/demand-for-electricity-takes-off-us-power-generation-by-source-in-2024-natural-gas-coal-nuclear-wind-hydro-solar-geothermal-biomass-petroleum/
The entire power generation industry understands that meeting demand requires an “all of the above” portfolio of power generators. All forms of power generation have advantages and disadvantages, and there are no free lunches when it comes to energy.
Thank you.
The problem with solar is storage. Costly and often dangerous.
A Guy,
The majority of storage is now a very profitable arbitrage business, buying electricity during low demand times of the day, at a low price, and selling the electricity during peak demand at peak prices of the day. These arbitrage profits have created a boom in battery storage installation. And in the process the help balance the load and have other benefits.
https://wolfstreet.com/2025/09/22/price-arbitrage-buy-low-sell-high-dominates-the-use-of-utility-scale-battery-systems/
Far behind price arbitrage, the other big uses of battery capacity were in that order: frequency regulation, excess wind and solar generation, system peak shaving, load management, co-located renewable firming (pairing wind and solar with battery systems at the same site), and others.
Let’s give some props to Wolf, who has written on everything we can ask about.
Interesting discussion here.
IMHO – I think it’s all going to be about fission and fusion.
One of the fusion R&D projects is publicly traded RNWF.
Good point, and much more about fission, as fusion is decades away — if ever — as we continue to hear unrealistic stories about it, just like we had heard about viability of super conduction in the past. I remember a time magazine front cover in the late 80s hyping up super conduction as if it was going to be viable just around the corner.
What I’ve heard is there is nothing that can compete with coal/Petro in terms of power generation other than fission. Each energy source has its own drawbacks of course and one has to peel back the curtain (on subsidies and smoke & mirrors) to understand the big picture.
Energy independence needs to be at the individual level. Electric poles are ugly. The oil industry owns DC. It’s why the admin slowed DOE’s roll.
Green energy and their subsidy/carbon credit scheme has eaten their own children. I have solar and battery storage at home and I can tell you it is way over regulated, burdensome, and a cash scheme for the energy company. All voted in to lie by the Illinois government.
If we can get that back to an open market, not on taxpayer dime. Then we could some progress.
Even with all the solar farms and rooftop solar cells in the best areas, solar only makes up 8% of total USA energy generation. It helps, but we need all sources of energy, and favoring one at the expense of others causes massive price distortions.
The highest price component for solar panels was silver before the price of silver rocketed. Now, it’s pretty much hopeless to use silver, so they will have to use other base metals that 1) corrode faster, and 2) conduct much less.
Uh….,they could pay more for said silver for a quality product.
The fact that I am a in hand metals stacker has nothing to do with my statement!
Are some solar panels coated with PFAS?
The highest price of solar installation is labour. The panels itslef are dirt cheap.
Solar at 8 percent is still pretty impressive considering that we pay about 4x what Australians and Chinese pay for rooftop solar. And the cost of home scale batteries have been dropping in cost by about 5-10 percent per year for several years, and with the amount of r&d going on, look like they will continue to do so. These declining cost economics are not matched by any other source of energy that I am aware of.
The price of installed rooftop solar in the US has been nearly static for decades. That price has been stuck because of subsidies and the carbon credit nonsense. The only way to get the 80 to 90% discount and solar is to install it yourself which is a pain in the ass and most states to work around the regulatory shenanigans of the utility company.
The US is far from having all the best areas for solar covered. Even in Alaska, solar has the potential for at least 8%.
I cant attest to large solar farms. However, I did invest in solar for my house. It was as much of a hobby spend as an actual investment. But I have 11kw of solar capacity installed along with 17KWH in battery storage.
I live in a state with reasonable electricity rates, so at the outset the investment made little sense – all though tax credits paid for 20% of it. The Payback period is about the same as the expected useful life of the installed components – panels, inverter, battery, electronics.
The state also has a reasonable net metering policy, so net net, my electricity bill averages $25/month – which is the Utilities base charge to cover infrastructure costs. The main plus has been that while there have been 10%/year rate increases over the last 3 years, I am insulated from them.
Again, I’d never say it made economic sense, but it has been a fun learning experience and I do now enjoy a degree of insulation from issues of grid reliability and rate increases so net, net, I’m happy I did it.
A couple of summers ago, 2 big bulls in somebodies meadow were fighting it out over access to cows and knocked over a power pole electrocuting one of the bulls a starting a fire that took out one of the main transmission lines supplying our county.
The other bull kept the power company guys at bay for a couple of hours until the rancher could be contacted and came out to round him up.
The county was without power for 12 hours, but my system kept us going without a hitch even into darkness when the batteries took over. That was fun, but again, probably not worth the investment in ROI terms, but life is not ALL about ROI.
Americans and Canadians are really missing the boat when it comes to rooftop solar. Smallish 6.5 kw rooftop systems including panels, inverter and installation are available in Australia for under $5000. These are mostly Chinese components, and the government in Australia has been quite supportive.
Yep, we in the US are getting ripped off by protectionism, and because prices are high, people think solar isn’t a viable tech.
Worse in California, it’s also rampant corporation among the CPUC that is regulating the energy utilities. They blamed the increase in energy costs on solar and killed the whole industry 3ish years ago.
Big solar and should have probably donated more to the Gavin campaign fund.
I got my panels before Newsom wrecked solar so I’m cool without batteries, locked in rates
When we owned our single family home we took a look at solar panels. That was back in 2021 and the “payback” time was estimated to be 12 years.
Since we knew we’d be downsizing within 5 years it didn’t make sense to us. And what if prospective buyers didn’t want them?
The two biggest issues I see with solar panels are: 1) Night and 2) Weather such as hail storms which might wreck all the panels.
The power source – The Sun – is definitely free.
We had a little hail storm come through in June. It only lasted 15 or 20 minutes but it busted up every ones shingle roofs.
My neighbor had solar panels on his roof and they came out OK. but he still had to replace the shingles.
If your local utility is supportive you can sell excess power back to the grid. Helps pay for nighttime. And battery system prices are dropping rapidly so you can shift some of that excess daytime sunpower into the off hours.
Yes, an investment like this might not make sense if you want to sell the home in five years.
But when you calculated the payback, did you figure into it that electricity costs might spike by 50% over the first five years of the payback period, thereby shortening the payback period? That was not a likely scenario in early 2021. But it had that effect.
Here is a real world example.
My nephew had a 17 kw solar system with two 11.5 kw Powerwall batteries installed in Maryland at a cost of $76,200. The system went into service on Dec 21, 2024. He was able to take a $23,000 tax credit for his 2024 federal taxes. The Tesla software controlled system takes full advantage of the feedin arrangement with the local utility by feeding power to the grid 5 days a week at the highest time of day rates. I would like to add that this occurs whether the grid needs the power or not. In a no free money world the system was 18% short of generating enough electricity to pay for its self.
At what electricity rates? Those of 2023? Or those of 2028 and 2030 and 2035?
I bet that electricity would eventually go up in the long run when I put rooftop solar panels on my home. No battery system, just panels and sell excess power back to the grid.
I financed because the monthly finance bill along with selling power back was cheaper than my monthly power bill. So it made sense to me.
The problem is that when PG&E started raising electricity rates, they also lowered the rate at which they bought excess electricity back.
I woulda been right but they went and changed the rules….so turns out I was wrong.
Sold the house anyways… so it is a wash I suppose. Still annoying though.
I love your take on every subject you turn your focus upon. Thank you for sharing your expertise, knowledge and insight.
Lydia
Batteries…………….
6.5 kw roof top system would cost $20k in usa
No reason residential southern USA couldn’t be powered by solar like here in Australia. Problem is the Chinese own the scale and the entire sector including batteries. I’m not sure why North America is paying such ludicrous prices.
$5000! That would actually provide a decent ROI for my house. But we little Americans aren’t allowed to have good things anymore.
In India 6KW roof top solar set up costs ₹300,000 ($3500 max) with Govt subsidy
you van not get paid by exporting power in to the grid. my neigbours with li-ion expensive battery even charges his electric car and pays minimum electric bill. Iam considering too
Here in Australia I paid $2850USD in September for 6.6kW panels, inverter and installed. Chinese components and installed in 3 hours. Installers really complete here for jobs. I hear about North American solar system costs in the tens of thousands of dollars and you have to wonder why?
I saw rooftop solar water heaters all over rural Australia, too, especially in the Top End and places like Broome and Exmouth.
I saw those 30 years ago. There were essentially standard on SFH, esp. in the suburbs and further out. Thermal water heaters, not photovoltaic, to be clear. Given the sun in Australia, that’s been a no-brainer for a long time. I never understood why they’re not standard in the US Sunbelt (you can get them though).
Thermal solar was used widley in Germany, too. But photovoltaic got a looot better and cheaper.
Thermal solar has downsides:
– It is expensive. (it needs to be sealed and stay sealed). PV is mainly silicium wich is basically refined sand… Its dirt cheap with scale.
– Its expensive to install. Running insulated pipes from your roof to your heating unit and buffer is a lot more expensive than running a wire.
– It does not produce for demand. There is a lot of heat in Summer but not much in autum, spring and winter.
PV on the other hand is producing even in winter some electricity and can push excess electricity into the grid, save it via battery, save it via heat with a resitive heating element, use it to power a heat pump/ AC unit…
Its basically only worth it today for e.g. a public swimming pool where there is high heat demand year round. Or comparable industrial uses. Though often they would be more economically served with heat pumps and PV or a combined gas generator with heat scavencing.
Today I can get thermal heating panels for free. There are plenty of people who take theirs down to replace them with PV. Though the installation cost is higher than a complete PV system with installation.
Those are all over Africa. And they make total sense imho.
There is major market manipulation going on. The latest PJM capacity auction cleared every load zone at the capped price. These same players bid in much lower prices in previous years. They put in max bids cuz they could. Retirements of fossil plants combined supposed planned load growth created a phoney capacity shortage that the sharpies cashed in on.
It is not beyond the realm of possibilities that the supposed planned load growth is put into the interconnection queues with just this result planned.
As far as data centers they are some of the cheapest loads to service. They take deliveries at high voltages, and don’t cause the system problems like the old large industrial loads of yesteryears.
In comparison large scale electrification at the transportation, commercial and residential level requires upgrades all up and down the electric system.
Renewables cuz system problems requiring not only upgraded but new technologies to maintain stability and safety. (Not complaining here, it’s good work for utility engineers) All this drives up costs.
-Old retired utility engineers.
Anecdotal but, was talking with my civil engineer buddy that does infrastructure work last night. He travels all over and is in Wisconsin right now working on a new data center. Said there’s almost no commercial building going on other than data centers. Said the town folks were pissed and didn’t want it.
In a general sense, I usually don’t get fired up about paying bills and whatnot but since all these power utilities are essentially monopolies in their regions, regulators should look at increased rates for business vs consumer. When you think about it, the data center owners are also monopolies – Google, Apple, FB, et all. So screw it- just make the data centers pay through the nose.
Trump stated that the administration was going to make the data centers pay their fair share. Supposedly.
The Dept. of energy had a press release on the 16th regarding this. Though it seemed like it was only regarding the rust belt states.
By coincidence I paid my electric and gas bill this morning – the same day Wolf publishes this article on energy inflation. My one data point experience validates many of the points Wolf is making.
My January bill (combined gas and electric) was the fourth highest ever. Interestingly, 2009 was the record – 10% higher than my current bill. However, in 2009 I used 47% more electric and 14% more gas. This is in southeast Pennsylvania where PECO supplies my electric and gas.
Since 2020 the index for electric cost has gone up 41%. My cost per kilowatt hour has gone up 61%. The cost index for gas is up 54% and my cost per hundred cubic feet is up 48%. I must be getting a real deal on gas /s.
I am retired (since 2010) and on a fixed income – but not a pauper. I am still fully able to pay my bills. But, it does bring a focus on the popular issue of affordability. Pile on the increases in property taxes, insurance, medical costs, restaurant prices, other utilities like water, sewer, phone, internet, etc. You begin over time to get an appreciation of the issue of affordability.
My Dec electric bill (and prospectively Jan as well) increased by a substantial percentage. Then again, it has been a colder than normal winter. I live in an area that has huge solar farm blight for miles outside the main metropolitan area – Jacksonville.
China has a huge advantage in the energy aspect of AI. Chips is the only area it is trailing. It brings on 8X electricity more per year, leads the world in solar, and has 32 nuclear power plants under construction. No way the aging US infrastructure and disjointed ownership and slow policies have a shot at keeping up.
It does have dependencies on liquid natural gas and oil currently but has a strong plan to significantly reduce that by 2030 and further by 2045, according to their regular 5 year plan cycle.
Unfortunately the US is stuck with a system mostly built to benefit owners of the utilities rather than making proper investments (PG&E for example) and hard to see how regulators can make any significant difference. I have SMUD for electric while 15 minutes away people have PG&E. The rate I pay is literally 50% less. Almost like when you buy a house you not only need to look at schools in area but electricity providers.
Really hard to see any reasonable solution and the US would more likely split the big ones under the irrational idea price competition would drive down prices. Yeah, that won’t happen but people will vote for it.
Most people think energy assets are best privatized but that is contrary to the majority of those assets which are state owned.
China also imports and burns more coal than most countries.
It’s bigger than most countires…………..
Yes, energy transition is actually a thing and they don’t have LNG but lots of coal. They still have lower per capita CO2 emissions even when calculating that much of their energy usage is being the world’s manufacturer. Energy security is a thing in case you have missed the news recently.
My point however was that having plans and a stable government actually allow you to achieve those goals. The idea that central planning is bad is just fools ideas they plant in many schools. Walmart and Amazon are each larger than many countries economies and they have sophisticated planning system where it is almost impossible to see where they end and other pieces start(like delivery services).
Would be amazing what the US might be able to achieve with 5 year plans but our next administration simply tries to flip what the last one did. There is little progress under this and the only people who benefit are those that pay to elect the politicians.
And therein lies the rub: whose central planning?
I do believe your lament/argument covers our national politics and not the plusses and minuses of central planning.
And China continues to build a new coal power plant about 1 every two weeks. That’s for all of you climate activists. Indonesia and India are similarly burning mostly coal. So, we’ve pretty much been suckered by the green energy movement for the last 20 years but, continue the charade.
China is building out its wind and solar power generation far faster than coal. In Q1 last year, for the first time, China’s solar and wind energy capacity exceeded that of thermal energy — mostly coal and natural gas — and accounted for 40% of its total electricity capacity.
In terms of power generation, wind and solar generated 22% of the total power consumed in China in Q1 2025.
https://english.www.gov.cn/archive/statistics/202504/25/content_WS680b7b79c6d0868f4e8f2141.html
Too bad that high electricity use (and high-cost electricity) states such as CA and AZ took away net metering. This means that the power companies are no longer required to credit you for excess electricity you send out to the grid during the day, but they get to sell it to other non-solar customers for full price.
You get around this with a battery bank, which only doubles the cost of the system.
MitchV,
Here in SW Michigan the cost of a a 6kW roof mounted solar system with 32 kWh battery storage installed will cost something north of $50,000 US.
The AI estimated lifespan of a solar system’s major components is between 15-20 years.
The retail cost of electricity in SW Michigan is $.22/kWh.
A 22 kW Generac whole home backup standby generator cost $8200 US installed.
Old Beyond Caring,
You’re comparing apples and mothballs. Most rooftop solar systems are used to generate power whenever they can to reduce the cost paid to utilities (you don’t need a battery to do that though it’s helpful). But a back-up generator is used to generate power when the grid goes down, which is rarely. So now figure out the cost per kWh of the backup generator — including acquisition cost, maintenance cost, fuel, etc. — spread over the 20 kWh it might generate in a year, if any. In a good year, there might be zero usage…
My next home will have a backup generator(already own a few) and a small amount of solar for bare minimum water/ect.
I will also have a home made solar siphon heat system and as always,a good wood burning stove,that said,am a bit of a prepper type personality.
Agreed it is a comparable of apples to mothballs but out here in rural bumpkin land we’ve had two extended outages in the past ten years; one lasted forty-eight hours and the last one over three days.
Of course a back-up gen-set isn’t economic. That’s not the point. In our case it was a matter of first things, first and our priority is uninterrupted electrical power.
For us solar panels without battery backup is neither useful not economic. AEP won’t buy any extra power we generate. We do have an EV but off-peak power through a dedicated sub-meter is just $.08/kWh.
We are in the process of engineering a solar system but the price of the components is dropping while the efficiency and lifespans are increasing, factors that are still working in our favor.
Ultimately though we’ll get around to it, but not because of economic or environmental reasons but simply because we can.
‘ The retail cost of electricity in SW Michigan is $.22/kWh. ‘
In the UK, electricity generation was privatised which resulted in higher prices.
To try to protect consumers our government created OFGEM, a ‘consumer watchdog’ which attempts to control price rises.
Even with the much-publicised ‘OFGEM price cap’, UK domestic consumers are currently paying on average $0.37 per kWh.
Iran data centers: Perhaps these data centers should be relocated to Iran. Naval nuclear reactors are very small and can go decades without refueling because they use U235 at 90% enrichment levels, perfect to site deep underground next to the data center. Exactly the stuff the Iranians want to make.
Time to explore energy efficiency for AI data centers. This may include waste heat recovery which can be converted to electricity such as through the use of thermoelectric (Peltier) generators, Stirling engines, etc.
Data centers and “AI” are the greatest mis-allocation and mal-investment of capital and resources that the world has ever seen. It takes a tremendous amount of energy to produce good food. As energy cost skyrocket, so will food costs.
Hedge accordingly.
Anybody else pissed about this?
18 cents a KW here in NC (with tax included)
I cut down the heat when I leave and use an electric blanket.
I save prob $50-100 a month in the high energy seasons. Not much but it helps.
Some states are way higher than 18 cents a KW.
Pretty insane, retirees must be going bat shit
Apparently, too many people have been doing precisely this in PG&E’s area, which includes San Francisco and a big part of California, where electricity costs have soared. So PG&E has been increasing its fixed fees and charges, and it will further go down that road in March with a big change toward fixed fees and lower costs per kWh, and so people in SF, who don’t have AC and don’t need to heat all that much in the winter because they’d rather sit around in the cold than pay PG&E, and therefore haven’t used a lot of kWh, are going to face a substantial increase in costs. These utilities are gangster organizations. There should be no investor-owned monopolies because regulation doesn’t work when the regulators are in the pocket of the utility.
The average retail electricity price in California is around
30 to 34 cents per kilowatt-hour (¢/kWh) as of early 2026, significantly higher than the national average, with costs varying by utility (e.g., PG&E often higher than SoCal Edison) and usage, often leading to monthly bills from $150-$270+ for typical households.
My PG&E bill says $0.50 per kWh for peak use, and $0.47 for off-peak use.
Regulatory capture. Gotta love one of the pitfalls of capitalism.
I installed solar with battery last year even though costs were high. But guess what? It’s a fixed cost at the end of the day, and 90% of the year I don’t rely on the grid at all for my energy usage.
The weather forecast for where I live for Friday of this week is calling for a high of 10 BELOW and a low of 24 BELOW.
Wonder what that’s gonna do to my energy bills? :)
That depends on your standard of living. People living in an igloo probably won’t notice…
Yes, this is the affordability problem today. Your heating cost goes up and then you’re hit with your furnace running 24/7. Your electricity goes up and then you’re hit with a heat wave running your air conditioner 24/7. Your rent or real estate taxes go up and then your car breaks down and you get an eye popping mechanics bill. Your kids are getting older and bigger and so are your grocery bills. Your company or work is getting tight with raises. Been there.
The only one getting fatter is momma cass.
So, ‘aff-or-DA-bil-ity’ is not just a ‘Democrat hoax?’
Natural-gas futures are jumping 20%. It will be toughest test in a decade, one analyst says.
yes, but the price is still at only $3.88 per million Btu. Look at the chart above where that places this $3.88. It was higher 25 years ago.
So, if we price everything in natural gas (versus gold, for instance) the value of the US Dollar has risen substantially and there is no inflation!
From my perspective the biggest threat to natural gas prices right now is oil prices. The free gas produced from the major oil fields was practically given away in Texas and kept natural gas prices under control. If oil production starts dipping, that gas will dip with it.
CNBC: U.S. 10 Year Treasury US10Y 7:56 AM 1/20/2026
Yield | 10:56 AM EST 4.271% up +0.04
Treasury market faces worst day in 6 months after Trump threatens European allies with tariffs related to Greenland
10-year yield is up only 5 basis points. That’s nada. The market was closed yesterday. On Friday, it rose 5 basis points, and on Thursday it rose 4 basis points. After a while, it does add up.
From Karin Kirk for Yale Climate Connections: Shows that since 2008, the increase in Electricity Prices are increasing much more quickly for Residential users than for Commercial [includes Data Centres] users, and for Industrial users. Since 1997, the Residential increases have been about +8 cents per kwhr, but for Commercial users, the increase is about 5.5 cents per kwhr, and for Industrial users, about 4 cents per kwhr. So the U.S. Residential electricity user is paying far more for the same product than other users! And with the increase now and into the future of Data Centres, the amount of electricity will sky-rocket. Are U.S. Residential users going to continue to bear the highest cost burden of electricity?
When I lived in South Korea, 2010-2013, the apartment I lived in was charged $0.88/kWh (at the exchange rate at that time). There were floor-to-ceiling windows with no curtains or shades (company apartment) except in the bedrooms. The air conditioning system was an old Samsung system that didn’t work well. One August, with the a/c on 24/7, the apartment got to 90F by 5PM. The bill (paid for by the company) was $4000 that month. My employer, a large Korean company, still would not do anything for the windows. I thought about gluing up aluminum foil, but was worried that the hot glass might shatter. I was on the 34th floor.
No, you have it backwards!
We ALL benefit from better, cheaper EVERYTHING!
Because: AI and Data Centers!!!
They build their own infrastructure and the only emissions are: Roses! Wonderful smelling ROSES!
I asked Grok to calculate the average price of gasoline excluding California.
A price/volume analysis was done and the difference was $0.19/gal less for a US average gasoline price.
Why do you ask Grok about anything? No one forced you to. The answers you get are your own fault!
I was just curious to what impact California had on the national average for gasoline that everyone quotes. Now I know.
No, you don’t know. Grok may be hallucinating, just telling you whatever. And you have no idea.
Here are the actual averages by region, by major state, and even by major cities. Click on the “+See more” to see the details:
https://www.eia.gov/petroleum/gasdiesel/
11:33 AM 1/20/2026
Dow 48,455.26 -904.07 -1.83%
S&P 500 6,797.39 -142.62 -2.06%
Nasdaq 22,965.80 -549.59 -2.34%
VIX 20.48 +4.62 29.13%
Gold 4,770.10 +174.70 3.80%
Oil 60.28 +0.84 1.41%
The price of PV panels has fallen to $0.23 per Watt. That would be $2300 for a 10 kWp system only the panel costs.
Those prices are a global estimate via our world in data. But I just checked, and the second link of a local hardwarestore gives me a bundle of 36 panels for 0,23€/Watt. Damn. And its quite simple to DIY install them depending on the roof.
Today the parts for holding the panels on the roof are basicall more expensive.
The people in the comments show prices of over 50k for something like that.
Of course the installation is more expensive but come on. One day for mounting the panels, ( 2 people who know what they are doing). 1 Day installing the electrical panel (1 guy). Done. Say 30 hours of labour. At 150$/h that would be 4500 USD. +2500 USD panels + 3000 for the inverter +3000 USD other parts = 13 000 USD for the system. Ok, + 10k for the owner of the installation company. I’m still short 30k.
Ya’ll getting scammed.
These are the conversations all over SolarDIY reddit.
There’s a lot of variation on the scam: to get tied into a grid and metered in some areas is basically a lien on the house.
For other, simple systems, there’s a lot less strings.
My power co-op is very solar friendly (and so is the constituency), and have been building solar farms. I’m not sure how easy it is to tie to the grid (I have a condo and a shady roof), but I know people do it here.
I have a dream of developing solar, and being non-grid dependent. All I need is the land, some structures that demand power and a solar system!
“These utilities are gangster organizations. There should be no investor-owned monopolies because regulation doesn’t work when the regulators are in the pocket of the utility.”
🩷