Single-family home sales edged up in 2025, condo sales dropped further.
By Wolf Richter for WOLF STREET.
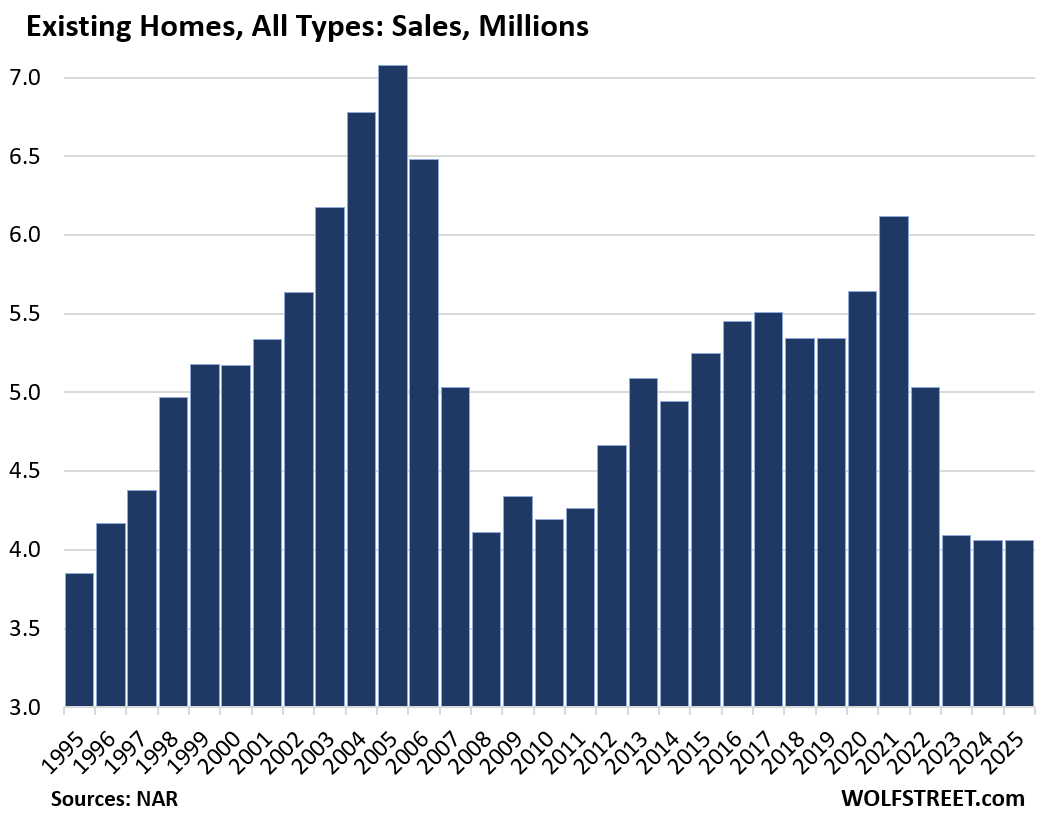
Annual sales of all types of existing homes declined by 0.2% in 2025, from the prior year, the fourth year in a row of declines, to 4.06 million homes, the lowest since 1995, with single-family home sales ticking up a hair, and condo and co-op sales dropping further.
Monthly sales that closed in December rose by 1.4% year-over-year, to a seasonally adjusted annual rate of 4.35 million homes, the best December since 2021, but still down by 29% from December 2021, according to the National Association of Realtors today.
For the past three years, home sales have run essentially at the same collapsed pace, down by 34% from the pandemic high of 2021 and down by 43% from the all-time high in 2005 (historic data via YCharts).
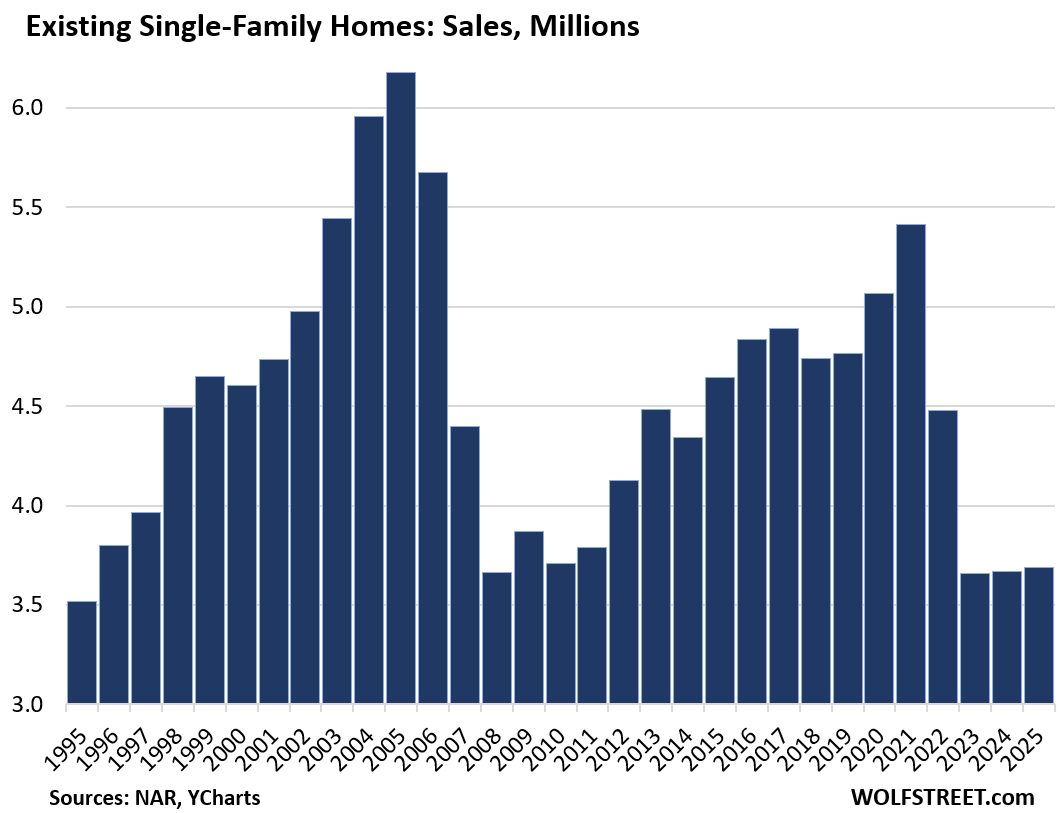
Single-family home sales in 2025 ticked up by 0.5% to 3.69 million homes. But that was still down by 32% from the pandemic high in 2021, and down by 40% from the all-time high in 2005.
Monthly sales that closed in December rose by 1.8% year-over-year to a seasonally adjusted annual rate of 3.95 million homes, the best December since 2021, but down by 27% from December 2021.
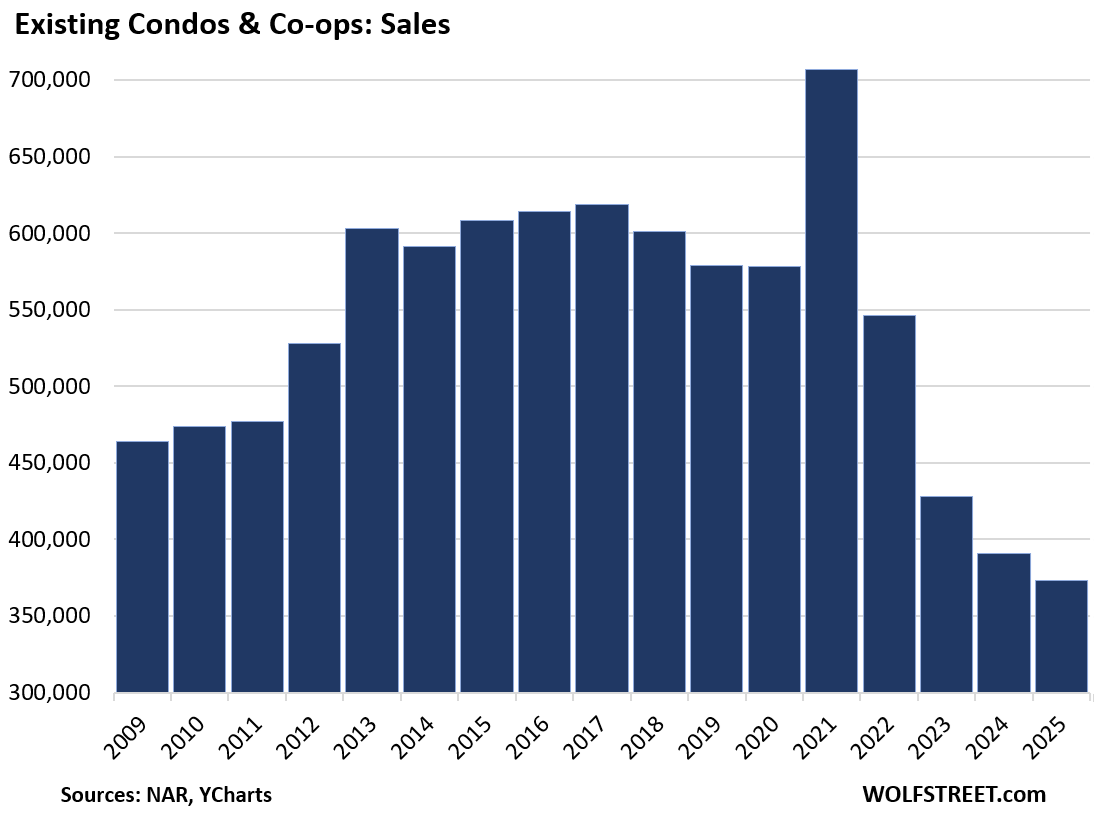
Condo and Co-op sales in 2025 fell by 4.6% to 373,000, the lowest in the data by NAR going back to 2009, down by 32% from the pandemic high in 2021, and down by 40% from the all-time high in 2021.
But the condo bubble of 2021, when sales exploded to 707,000 and prices exploded in many markets, is now sticking out like a sore thumb. Since then, condo prices have been careening down in many markets, and in some markets are down by 30% and more from their peaks in prior years.
Monthly condo sales that closed in December fell by 2.4% year-over-year to a seasonally adjusted annual rate of 400,000 condos, along with December 2023 the worst December on record, and down by 41% from December 2021.
Yanking their listings off the market over the holidays.
Supply of homes for sale always plunges in December as sellers yank their listings off the market over the holidays, only to relist them in the spring.
In November, supply of all homes combined had been the highest for any November in many years. But in December, sellers ran out of patience, and the yanking-fest was bigger than in some prior Decembers, especially with condos.
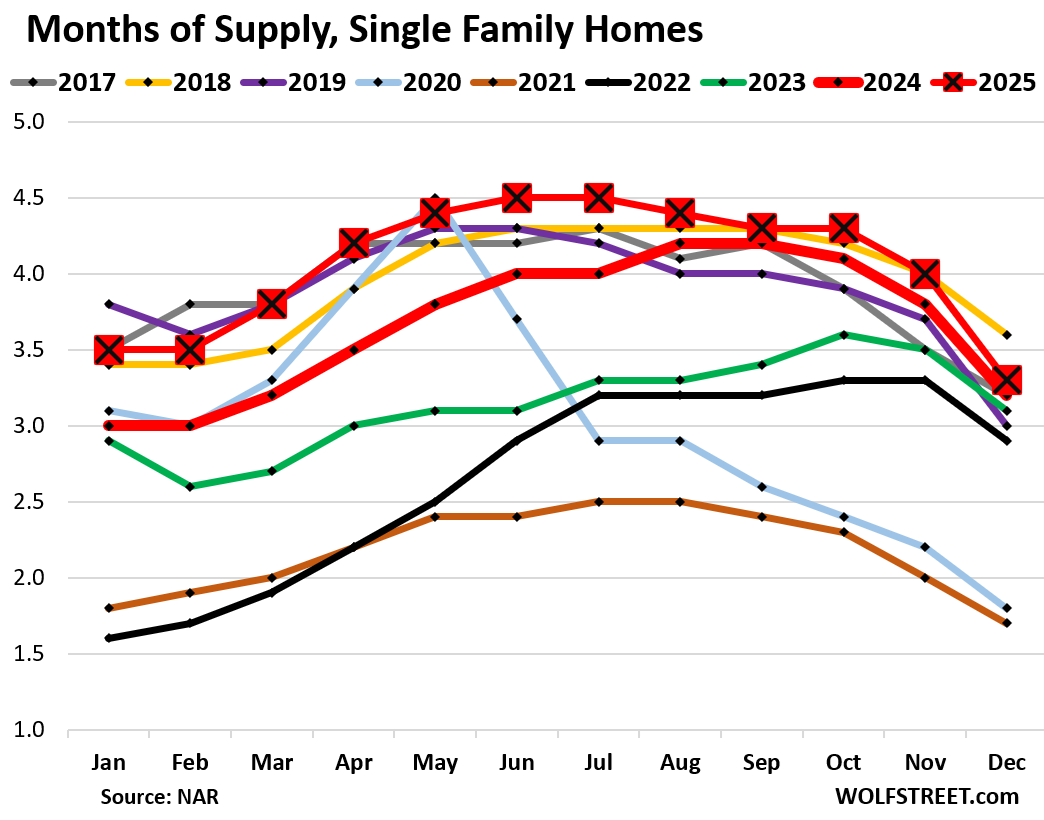
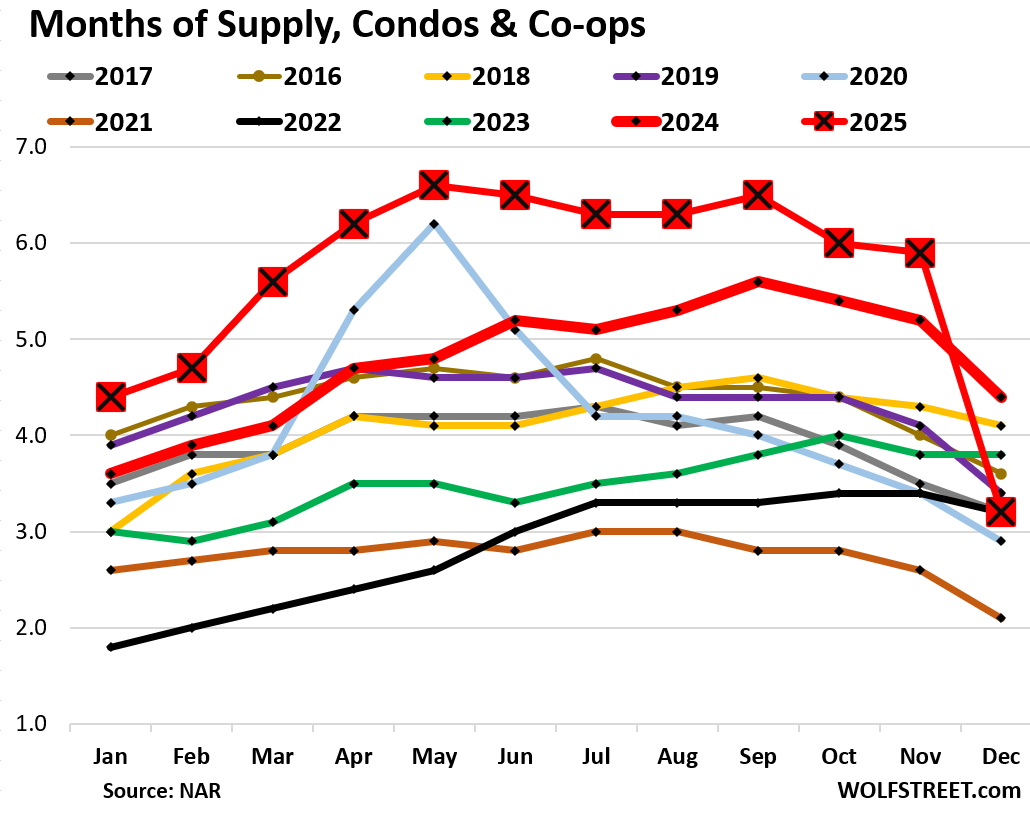
Supply of single-family homes fell to 3.3 months in December (red line with big squares in the chart below), a steep drop from November (4.0 months), which had been the highest for any November since 2018.
But even the sharply lower supply in December was still the highest for any December since 2018.
In terms of condos, sellers yanked their condos off the market at a stunning pace over the holidays, amid little demand and big haircuts on prices in many markets – to relist them in the spring.
Only 32,000 condos were sold in December, but inventory plunged by 79,000 condos, or by 42.5%, from the prior month. That’s the force of delisting over the holidays.
Supply — which is inventory divided by the sales rate — plunged to 3.2 months, from 5.6 months in November, which had been the highest for any November since 2011 during the Housing Bust.
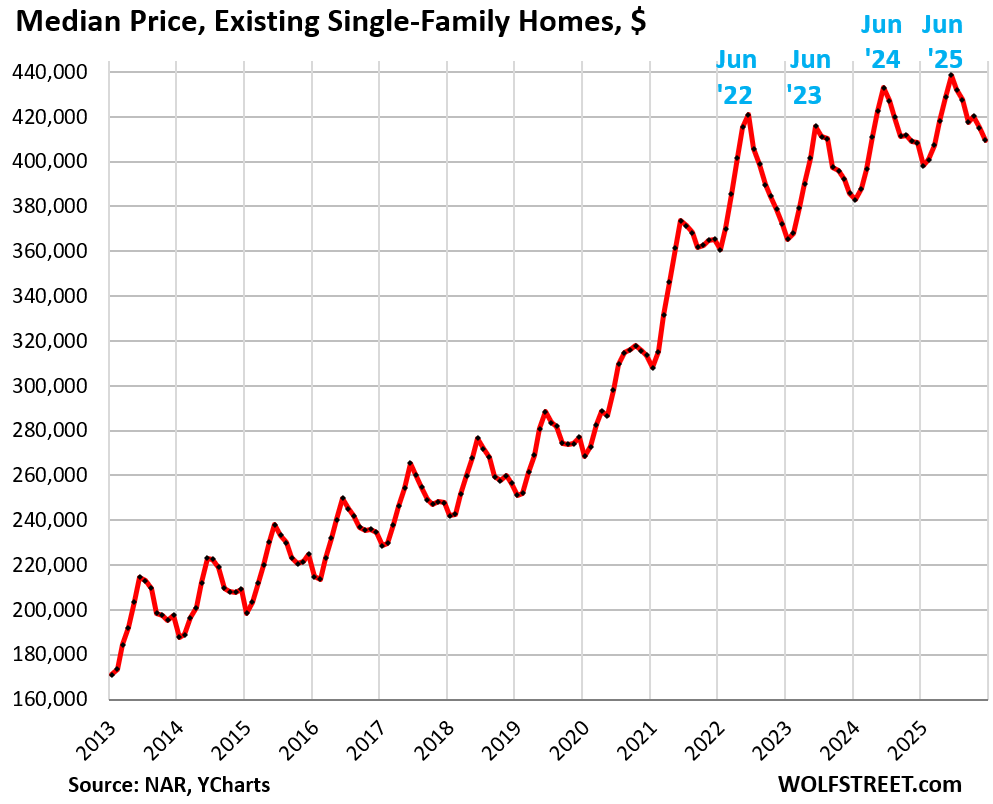
The national median price of single-family homes fell by 1.3% in December from November along seasonal patterns, to $409,500, just 0.2% above December 2024 ($408,500).
This national median price of single-family homes had exploded by 47% from June 2020 through June 2025, most of it during the two years of mid-2020 to mid-2022.
January or February usually marks the seasonal low each year, June the seasonal high. The index is not seasonally adjusted. The seasonal zigzag is a result of shifts in the mix of what is on the market and sells, which shifts the median price up or down.
But price dynamics differ dramatically from market to market, and the national median price is meaningless for specific markets. In some markets, home prices have fallen substantially, including by 24% in the Austin-Round Rock-San Marcos metro, the biggest drop in our lineup of 33 large and expensive housing markets. Conversely, the Milwaukee-Waukesha metro is the market with the biggest year-over-year gain (+4.1%) and record prices.
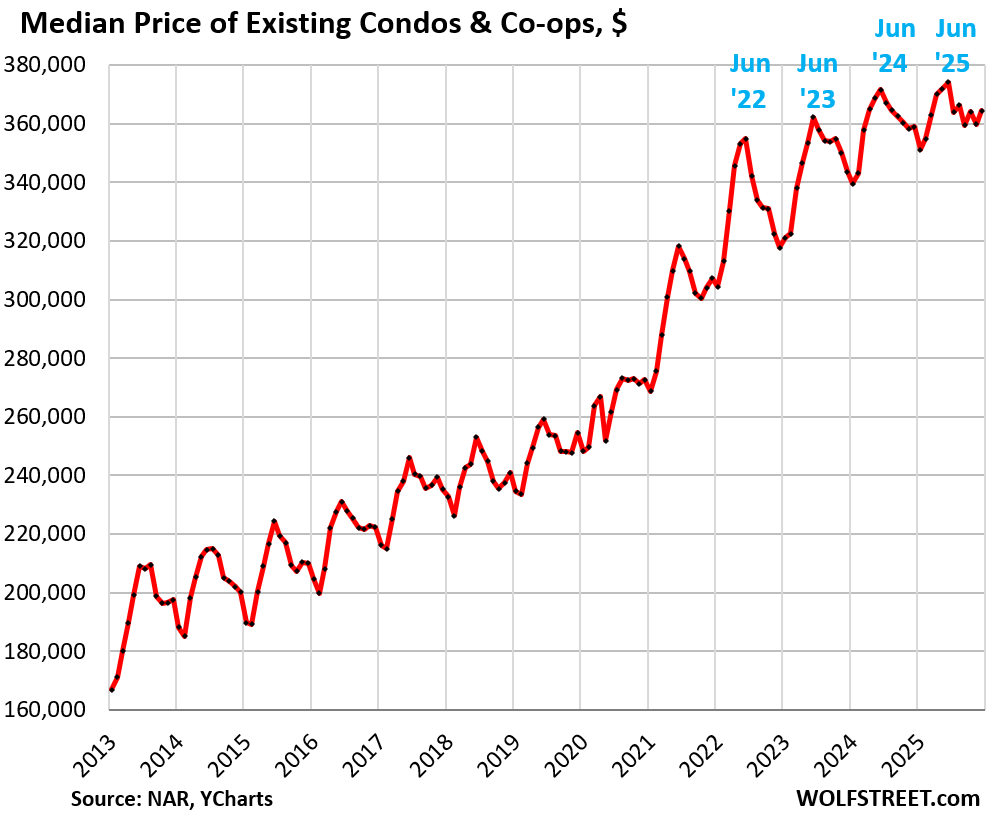
The national median price of condos and co-ops rose by 1.3% in December from November, on dismal sales volume that shifted the mix of what sold. Year-over-year, the median price was up by 1.5%.
This national median price of condos and co-ops had exploded by 43% from mid-2020 through mid-2025, most of it during the two years of mid-2020 to mid-2022.
Enjoy reading WOLF STREET and want to support it? You can donate. I appreciate it immensely. Click on the mug to find out how:

![]()
Good info Wolf.
Also – I like your graphic free headers that show up on social media when like is sent. Most websites include a graphic that just takes up too much space and crowds out other things. Thanks for presuming that we and our friend are literate and don’t need pictures to understand, in this semi-literate world !
Thanks WR for this report.
Prices are still too high and needs to come down a lot for homes to become.
This spring selling season would be interesting.
So, are Realtors aggressively advising suddenly to delist? Why such a sudden exodus right now? Is this mass consensual delusion by sellers, with a lot of deniability about what their homes units are actually worth?
Most sellers still want 2021 prices. They won’t budge on price unless they are forced to.
Even if the rates go down little bit, it won’t make any dent on affordability.
“Most seller still want 2021 prices”
The charts show that sellers can get higher than 2021 prices today – they show seasonal housing pricing is higher than previous years, not lower.
Seasonal highs in late spring are higher than previous years and seasonal lows in the winter are higher than in previous years – even for condos.
If they are selling the national median house.
At volume “0” prices can be anything (ask).
If you’re actually SELLING, well you have to meet the market (bid).
Mass delusion, coupled with aspersions from this administration that lower mortgage interest rates are just a few personnel changes away and happy high prices days will be here again.
I’m not counting on interest rates holding or being raised. I think the independence of the Fed is likely about to be shown the door.
If SCOTUS rules Trump can fire Lisa Cook, we’re done for. There are two doomsday scenario’s in my mind right now. An invasion of Greenland or firing Fed voting members. Either of those happen and I doubt many of us will have the slightest care in the world about the housing market 2 years from now.
What is the consequence of FED losing independence ?
World losing trust in USD ? I don’t think so. People are still buying US treasuries despite US Gov having USD 35+ trill in debt.
FED balance sheet going up for funding Gov and suppressing rates? It already happened in last few years.
Please, the response to the great financial fraud of 2008 should have clued you in as to the “independence” of the Fed.
Until the are actual consequences for bad behavior at ALL levels of society, things will continue to deteriorate.
Fed independence.
What about government independence or have we forgotten about Yellen’s sideways shuffle so quickly.
I wouldn’t worry too much about the Fed, they’ve been very capable of protecting the institution over the decades and many variable governments have been dealt with along the way.
Conversely, if Lisa Cook is found to have committed mortgage fraud and isn’t fired will that save the Fed?
Firing someone for breaking the law is the end of FED independence? Debate the case all you want but it is for with cause removal we become far too tribal in our views and forget the law or reality ….
Anthony Ace
Has Cook or Powell “broken the law”? The allegations against Cook have already partially been debunked in court, and the rest is going to get determined in court. So whether or not she broke the law is for the courts to decide, not you. In addition, the allegations refer to stuff before she ever became a Fed governor. in Powell’s case, the allegations are that he lied to Congress about the renovation details. There has been no proof offered whatsoever, just allegations. Even Trump has distanced himself from that.
Definitely not realtors. Mass delusion AND the belief that the POTUS will absolutely NOT do anything to harm Property owners and sellers no matter what he might say.
I am guessing you have made that statement since 2021 …
There just aren’t enough secure salaries that command these prices. I hope the sellers can afford these houses, because few buyers can.
The sunk cost fallacy is alive and kicking in the housing market. Owners have yet to realize the price they think the homes and condos are worth are disconnected from fundamentals. Unless rates drop below 4%, the sales will not increase without significantly lower prices (>25% drop). And in some places that may not be enough to offset insurance and HOA fees.
Spring is going to be a MAJOR DISAPPOINTMENT. Hoping prices will come up some? – THEY WON’T. The party is over! The fantasy valuation circus has ended. Any soft-landing scenario is off the table.
Many of you are making the assumption that sellers are somehow trying to trade the market, and by waiting they’ll get more. As if they’re trying to time when to sell their meme/bubble stock in a volatile market.
No. They’re trying to time their sale when there are more buyers, more liquidity, so they don’t have to sell in a very low liquidity market. There’s a subtle but important difference.
The biggest problem is not lack of buyers but extreme degree of unaffordibilty .
Buyers are out there waiting for homes to be affordable
If the rates go down and prices go up then unaffordability remains the same.
Something has to give in .
The low liquidity market is here to stay, do meet the market or wait. Non perfect have to sell houses are tough. The fix up workforce is running away, so updating is going to be a lot more. From what I have been seeing, post inspection is a brutal part now. So either price listed reflects reality, or is adjusted under contract.
The biggest problem is wages still are too low to support the mortgage payments for these prices. I see a lot of houses that the mortgage is twice the monthly rent. Um, no. The math doesn’t work. So, the prices start declining, until affordable to a lot more people in the local area.
Too much wealth is in housing that is needed to support the retired people. There is more dead assets in property and housing that are going to be repriced because of the low returns or losses.
In short, growth is over, and business models related to feeding an infinite demand of continually richer consumers looks feeble.
or they just keep not selling … market price correction has been fueled in the past from low equity and higher rates (2008 uprate ARM, etc) we could transition to a society that does not need to move every 6 years easily and stay at this home sales volume for 5+ years with little pricing growth this is more the tale of two economies the 30% doing well and the 70% affected by life choices …
How long are people willing to wait? If you must move or sell, no way to wait especially if you bought in 2022 or the peak of your market.
What you are saying is the premise of the sunk cost fallacy. It basically is when people hold onto investments because they aren’t willing to accept losses or reality with the market. I sold a property in 2023 against the advice of my brother and brother-in-law. Had I kept it and waited, I would lost money. Buyers know there’s a huge bubble and won’t pull the trigger unless it’s a good deal.
That is the thing you do not have to move America is by far the largest home volume sales country per capita because we have this love of “upward mobility” what if everyone just stays in their house? There is plenty of equity for most of the market and lower mortgage rates as well to survive a downturn … and capital keeps supporting some markets at these price levels … condos will be the only real issue due to rising insurance and maintenance
Sold my WSOMA loft in San Francisco in November 21. Price $925k. Just looked: Zestimate®$739,200; Redfin Estimate $726,925;Realtor Estimated value $706,751; and Trulia Estimate $739,200. We had planned to move so I can’t claim I’m a great market timer….
Now on the flip side, we bought in SW Oregon, the house has not appreciated substantially but hasn’t lost to the degree the loft has.
Your of course taking the worst case of the whole market condo style property in SF now do it Colorado Springs …
Colorado Springs, -10% from the peak in 2022:
Makes sense. All that is needed is for a few months of labor statistics to be interpreted as soft and 50 basis cuts could show up by April/June meetings. At some point this perpetual “meh” will need a change.
Or this is the new reality and we go back to sales volume pre 1995 as Americans no longer feel the need to move every 6 years on average as our entitlement and short attention spans fail us and we actually have to become neighbors again … this is the peak of itchy feet as 49% want to move but only 10% can … communities would be far better if people were forced to live with their actions instead of just selling and netting 30% equity as your “punishment”.
Mass delusion or not, sellers are in no hurry to sell. Apparently very few are in a forced sale position, hence the bubble remains and we still have aa shortage of homes (at least in popular to live in areas).
I am in so cal one of the most popular areas
Absolutely no shortage of homes
One can rent an example home for 6k per month but it would take 13k to own at current price and rates .
Once the psychology breaks .
All hell would break .
Those who panic first panic best .
Property taxes have a lot to do with that discrepancy. Plenty of those rentals have a tax basis from 30 years ago.
I am noticing the same thing in Orange County. Condo prices are way to high compared to rentals. Agents here are holding onto hope instead correctly advising clients. The only way to get the housing market to move is price drops of at least 25%. Lots of people will lose money but it was free money anyway, or so they thought.
I recall reading “those who panic first, panic best” in an article here some time ago. I am curious to see if sellers who adjust their price lower now and get a sale will be better or worse off than those who relist in spring. It does appear that we may get a deluge of listings in the spring.
You’ve heard it here first! I prophesy the 2025 high shown in the median price, single family home chart will prove to be a multi-year and perhaps, decades-long high. Look for a lower high in 2026 and lower low later in the year, reversing the uptrend. If the chart were converted to candlesticks, the ensuing trend reversal would even be more apparent!
LOL…
Japan enters the chat…
Townhomes on the east end of Panama City Beach Florida have been selling at 2021 price levels.
Combine this with the 30 year conventional rate dropping to around 6% to understand the noticeable increase in sales volume.
The same goes with townhome rents being set at 2021 levels.
How much do taxes increase on an uninhabited house? How many owners are claiming multiple houses as primary residence (eg, in different states)? Do state tax agencies check? Some stiff penalties might shake some houses loose.
In Florida, the county Property Appraiser’s Office checks. That used to be my father’s retirement job. Many states have agreements between each other to allow this to happen. About 2 decades ago, Florida required all “homesteaded” home owners to provide their SSN for this purpose. Even if you have only one house but are renting it out, you can lose your homestead property exemption (this was my father’s real job, finding renters). Similar to California, Florida has rules that annual property taxes on homesteaded homes can’t go up more than 3%/year. If you lose your exemption on a home you’ve owned for 20 years you can easily see your annual tax go from $2,000 to $12,000.
Hmmmmm…..,almost seems the property taxes are a huge problem.
My city approved a zoning change and site plan for a five story, big foot condominium across the street from where I live. The surrounding area is area is still zoned single family, two story. The developer applied in 2022 for the zoning change. Per a previous Wolf report on condo prices, the price peak here was in 2021. The city approved the building permit in May 2024, but the developer has not paid the $80,000 the city spent to evaluate the plan, so the city has held the permit. Despite not being paid, the city approved an extension of the zoning change. The residents are in full Nimby mode, but the city fathers are defiantly Yimby.
I suspect that the developer will have trouble getting financing, absent a valid permit. I unsuccessfully searched online for information specifically for how many condominium construction building permits are issued nationally. Condominium permits are included within the multi-unit rental category.
I did find a report with information including issued multi-family building permits. U.S. Home Construction Permits Declined 32% in Top 100 Metros [2025] https://homeabroadinc.com/research/home-building-statistics The article noted that “Building permits serve as a widely used leading indicator of future housing supply and comprise a key component of the Conference Board’s Leading Economic Index.”
Combined single family and multi-unit issued permits declined 32% between 2020 and 2025. There was a marked shift toward single family construction. Using July 2025 permit data, 61 metros had fewer total units permitted in 2025 versus 2020, with the decline driven mostly by 5+ unit projects. The article details both single family and multi-unit data for multiple metros. “Multifamily permits fell in 46 metros with a median drop of 71%.” The highest number of permit declines for 5+ units was for San Jose -Sunnydale-Santa Clara, CA, -1248 units (74%). San Francisco-Oakland-Hayward, CA came in at eighth. There was a -535 (89%) unit decline with only 67 permitted units in 2025. There were 602 units permitted in 2020. “Miami outpaced all metros with a total permit surge of 1787 units (160%), with its multifamily permits ballooning by 1,866 units.”
The article’s Data source was the U.S. Census Bureau Building Permits Survey covering the Top-100 metropolitan statistical areas by population.
Given this information, is it crazy that there would be a year over year drop in owner’s equivalent rent?
At this point, there is nothing in this data that predicts a year-over-year drop, meaning a negative yoy percentage. There hasn’t even been a month-to-month drop. For yoy to turn negative, we’d have to see a series of negative mom percentages.
“Sellers yanked their condos off the market at a stunning pace over the holidays, amid little demand and big haircuts on prices in many markets – to relist them in the spring.”
If you look at the charts, overall condo seasonal pricing is higher today than previous years.
Any big haircuts would have been very localized and not be a huge driver of the number of units taken off the overall market.
I would expect overall reduced demand to be the biggest factor in the number of condos taken off the market, much less the “haircuts”.
The sound of all those Realtor’s phones not ringing is sanity returning to the market.
Hopefully dropping a new edition in the “most Splendid Housing Bubbles in Canada” series today🤞
yes.
The covid era fomo buyers are trapped,
Winter,Spring, Summer or fall what difference does it make when trying sell an over paid for home ?
Just went under contract on a 2012-built house in NC for $350k. Before that we were trying to negotiate on a 1964-built house that a high-income couple (doc and engineer) bought over asking in 2021. Initially they tried to list at $100k more than they paid 4 years ago.
When we asked for disclosures, we found they had to put $48k into deferred maintenance (basement foundation wall was hinging, addition crawlspace was settling). They did the repairs the right way (the only reason we made a bid). We estimated in consulting with an inspector (sight unseen) that there was probably $60-70k of additional deferred maintenance (roof, sewer lateral, HVAC, decking, inevitable mold remediation) before a cent would go towards aesthetic enhancements (where there’s actual RoI to future buyers!).
We couldn’t agree on price and walked at $440k. Maybe they get lucky, maybe they have to come down to $400k if they carry through another selling season.
Meanwhile the sellers we are under contract with had a 2012 CB and were getting a $100+k paycheck despite replacing the flooring and carpet. They priced initially strongly to market, did a price cut, and then agreed to more cuts from us (~96% List-to-Sale). It was a multi-generational home and I don’t get the insinuation they were high income like the other sellers (who can afford the carrying costs, evidently).
tl;dr — Motivated sellers with good cost basis will keep pulling this market down against migrating HCoL buyers at the top end. I’ll sleep very well at night knowing I bought at 2021 median existing prices in a market that only a few years ago was one of the hottest in the country: 1.08 list-to-sale peak in 2021 according to Redfin’s data portal
The hottest fall fastest if you bought it in 2019 how much would it be … still too much equity and low rates floating around for any meaningful adjustment we might just see a country that goes from moving every 6 years to more of an international average of 15 years and this is our sales volume and price for years
I can imagine that the 10-20% of big-shot real estate agents are taking a massive pay cut but still doing well, and the remaining 80% are just barely surviving. Treading water to stay alive.
A 50% across the board price reduction in housing would reverse the real estate agents’ fortunes.
In the next block, there is a former real estate agent. She had a magnetic sign on her car.
Then I noticed there was missing paint where that sign had been. Looked to me like that sign was yanked off in a fit of pique.
The trend I see in my area is there are two types of builders.
1) New home builders that are building houses that only the top 20% income earners can afford. They are building the 2000 to 3500 sq ft, 4 bd, 3 car garage homes
2) New home builders building smaller 2 and 3 bedroom, 1300 to 1500 sq ft homes that the 60% to 80% percentile of income owners could afford but these builders are not selling these new homes. They are only making these homes rentals and keeping the entire new subdivision as a rental community.
“ Yank Listings off the Market”
Hello agent, my name is Hank. I wanna yank my home from the market. Home values are about to tank. I’m gonna take every drop of equity before it gets repo’d by the bank. This isn’t a prank. This has driven me to drank.
For all this, I have the fed to thank.
Those first two charts are amazing!!! Because I read WolfStreet regularly I was aware that the housing market was having problems matching buyers and seller since COVID… but I had no idea that the last three years of home sales were lower than the four years of the GFC!!! In 2009 to 2011 there weren’t sufficient buyers… now there aren’t sufficient sellers.
“but I had no idea that the last three years of home sales were lower than the four years of the GFC!!! ”
Historical charts really are amazing and useful aren’t they.
Of course, the underlying dynamics yielding the numbers can still be debated – for instance, I think it is the lack of *buyers* (who can afford these huge prices) that is causing the low volumes…not lack of sellers…not anymore.
Today, we have sufficient buyers and sellers but buyers are not able to afford these homes at current rate and prices hence the crash in sales volume.
A lot of realtor says that if rates go down, prices would spike up. I wonder in that case unaffordability remains the same since rates have gone down but prices have gone up.
Interesting chart of foreclosures rate in each US state:
Appears that ”The Free State of Florida” leads again!
/sarc
Good lordy. Foreclosures are HISTORICALLY LOW. But the Daily Mail effing clickbait purveyor, which you dragged into here (link deleted), doesn’t know the data of foreclosures going back 20 years, and and just throw this ANNUAL number out there, in this HUGE housing market. Did they show you a chart??? NO!
I report actual foreclosures with 20-year charts on a quarterly basis so you don’t have to drag this clickbait BS into here. Here is the last one — these are quarterly, not annual:
https://wolfstreet.com/2025/11/07/here-come-the-helocs-mortgages-housing-debt-to-income-ratio-serious-delinquencies-and-foreclosures-in-q3-2025/
As a general rule, if you see something in the Daily Mail, wipe your butt with it.
You’re right of course, and I apologize for dragging the toilet paper into Wolf’s Wonder of which I am a huge fan…
I was focused on the relations between the states rather than the overall picture to the point of distraction is my only, feeble, excuse…
Especially about FL leading USA once again, though perhaps not in a metric the politicians appreciate, eh
And this is why so many and several in this thread who have been priced out are talking doom and gloom a simple course correction of going from home owners moving every 6 years (the highest in the world) to 15 years (closer to the international average) keeps this this market pricing overall (some areas up some down many in the medium) down even more (we are at around 12 years I believe 24,25) and this is our new normal and maybe neighbors actually get to know each other again … like we did before the 90s started changing everything …
Here in pricey So Cal I’m seeing new listings for “re-done” homes (i.e., old crappy house that a flipper bought and prettied up so cosmetically it looks like a new house but god knows what problems are lurking behind the walls) where the buyer purchased 1 to 2 years ago and overpaid and now they are trying to sell it for even more than they paid for it (presumably to cover agent fees). Those are around $2.5M for under 2000 sq foot houses that in another part of the country would be starter homes. Then lots of listings where builder bought the old crappy house for $1.8M a year or two ago, tore it down, and built the giant 3500 to 4500 sq foot house on the lot. Those are all listed for $3.5M to $5M+. Lots to choose from if you can afford those prices. But even in So Cal, how many people can really afford those prices?
At this point I’m thinking the only hope for ever purchasing a house is if/when the stock market eventually crashes and it takes the housing market down with it. But by that point my kid may be off to college and I may not even want the house anymore. Oh well.
Lipstick on a pig type of flipper remodeling has really ruined many cute starter homes in 🍊 county. Open the door to a Mediterranean style home (exterior) you see a depressing cape cod style color inside (interior). Greed is human nature. But cross the line, being overly greedy is a disease that distort taste (for style) & judgement & drag is the rational buyers into this nonsense rather than race. 🤨🤔
Wolf,
Thanks a bunch for including that “existing sales” chart going all the way back to 1995.
As everybody knows, one of my favorite hobby horses is that while home *prices* may appear relatively stable, changes in the *volume* of home sales at those price levels may predict future price changes – ie, the evaporation of buyers/transactions at a given interest rate/price point portends future price declines as inventory naturally gets added to the market but additional buyers don’t.
Charts like that one going back to 1995 are *so* useful because they can be overlaid with interest rate movements to illustrate the above point.
Thanks again – I’m sure it is a fair amount of work generating all these charts day in and day out, and too seldom acknowledged.
I have been posting these annual charts every year for years. I have quite a few of them: existing home sales, new home sales, auto sales, factory construction spending, housing starts (single-fam and multi-fam), etc. I post them once a year when the December data is published. I have been doing that for years. So cut these charts out and stick them on the fridge because you will see them only once a year because they don’t ever change, and next year, they’ll still be the same, except for one additional column.
But monthly charts that go back this far obscure what is happening in the current time period, which is mostly what this site is about — not ancient history. So again, cut out the historic data and stick it on your fridge so that it’ll get you through the year.
Or we just go back and stay back to pre 1995 sales volume as Americans lead the world moving every 6 years this volume is at around 12 years we could go back to the international average of around 15 and maybe we all become neighbors again who have to act human vs just selling your home when you yell at your neighbor …
This is where the housing market is headed – home sales will continue to stagnate to the point of a near-total seizure. It will be at that point that sellers have a major panic attack, and home prices will fall like the Roadrunner falling off a cliff. This isn’t a market, it’s a monstrosity.
A country cannot function without a functioning housing market.