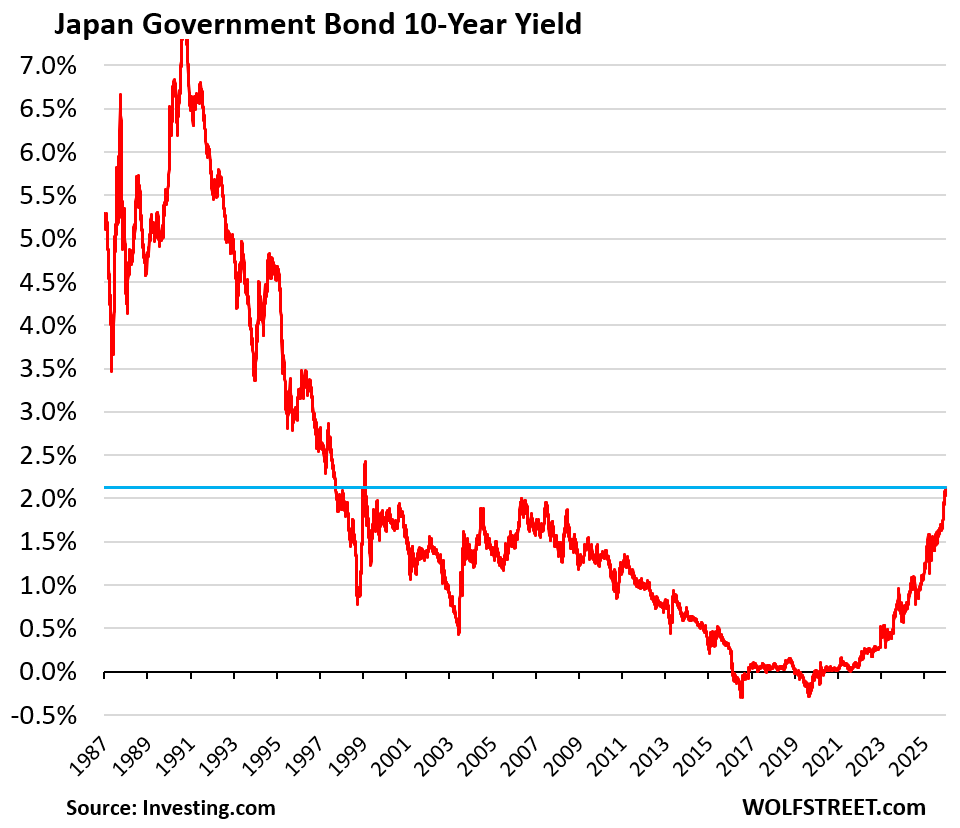
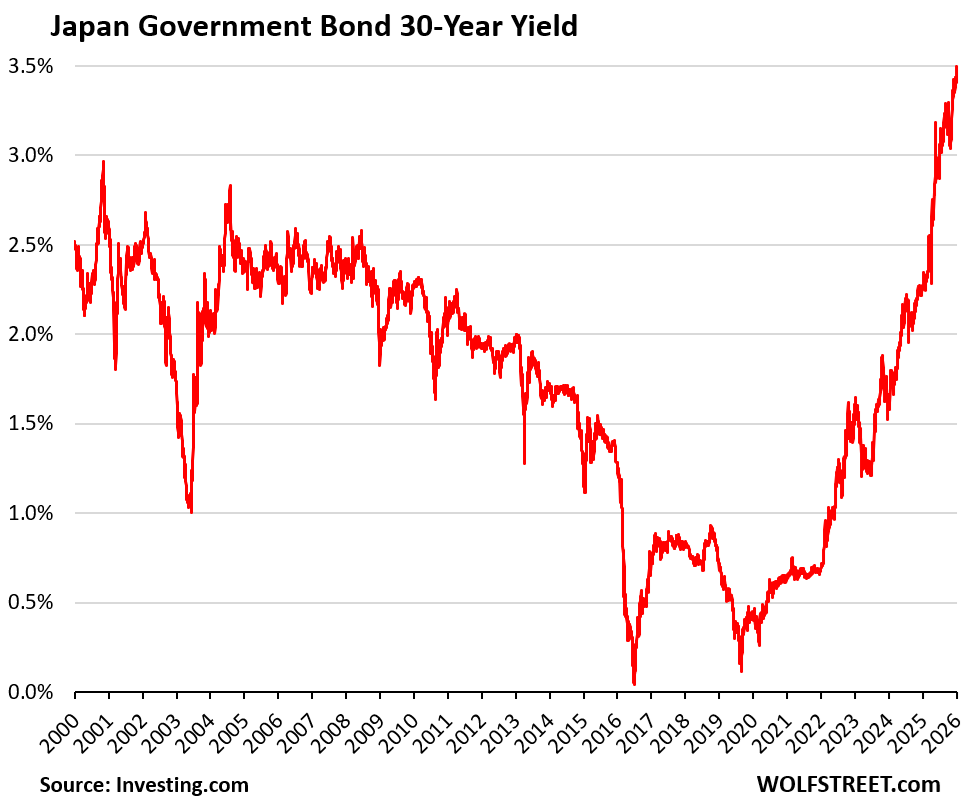
Japanese Government Bond 10-year yield rose to 20-year high of 2.13%, 30-year yield hit 3.50%.
By Wolf Richter for WOLF STREET.
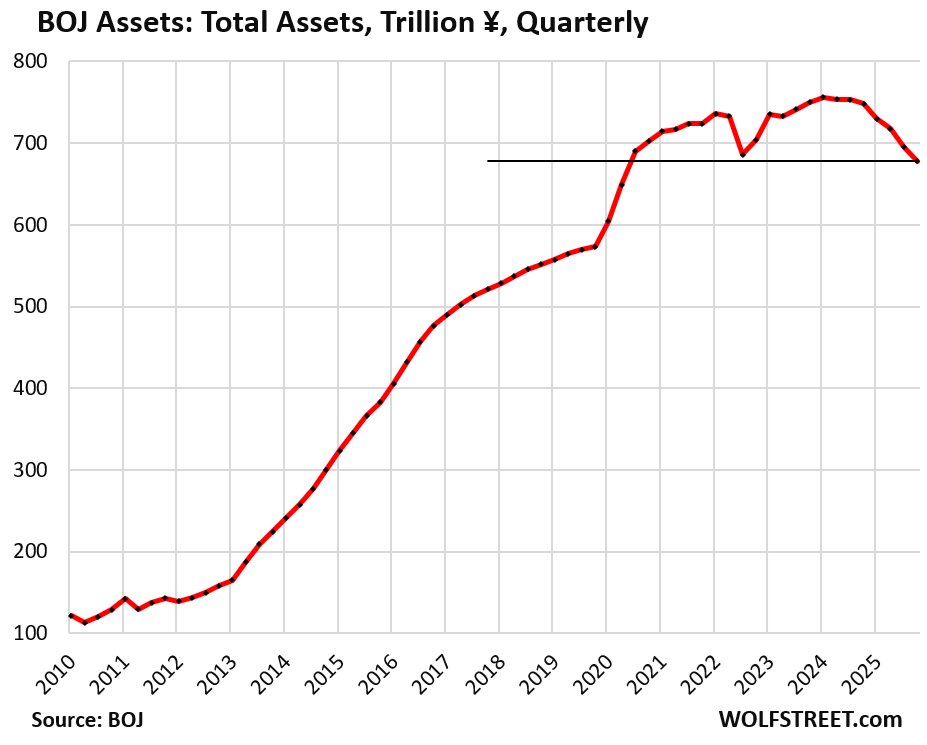
In the quarter through December, total assets on the Bank of Japan balance sheet fell by ¥18.0 trillion (-$115 billion) from the prior quarter, and by ¥70.2 trillion year-over-year, according to the BOJ’s balance sheet data today.
Total assets, now down to ¥677.8 trillion ($4.33 trillion), are at the lowest level since Q2 2020, and down by ¥78.6 trillion (-$502 billion), or by 10.4%, from the peak in the quarter through March 2024.
Back during the QE era, the BOJ conducted QE in several forms:
- Buying Japanese government securities (now 80% of total assets).
- Lending to banks and other entities (loans are now 11% of total assets).
- Buying stock-market traded equity ETFs and Japanese REITS (now 5.6% of total assets)
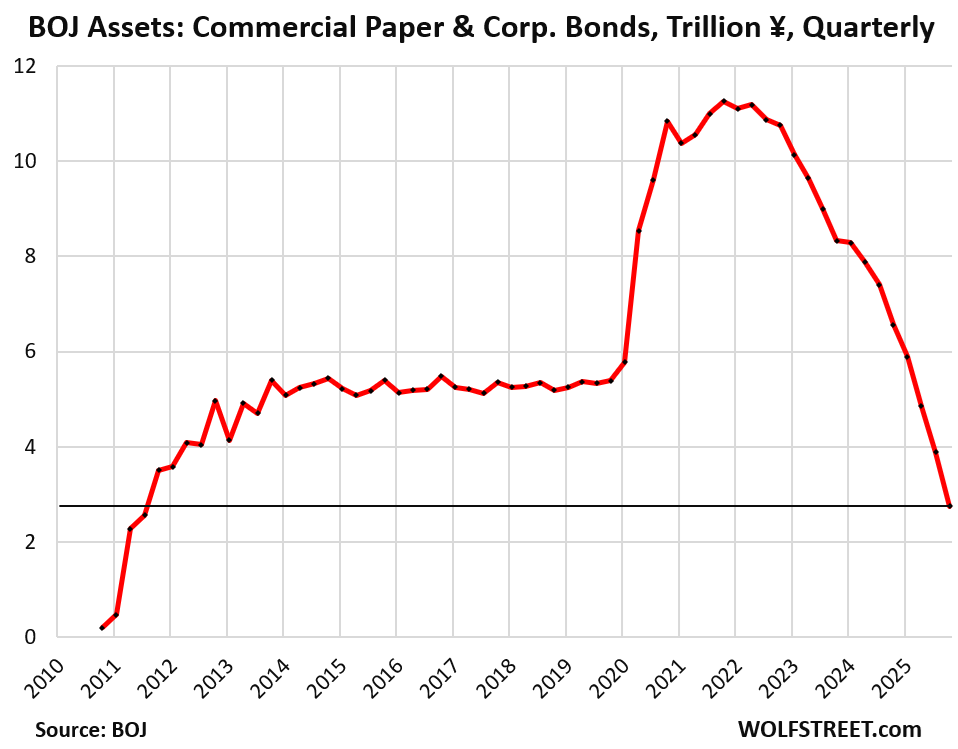
- Buying commercial paper and corporate bonds (now down to just 0.4% of total assets).
- Bank stocks purchased in 2000 and 2009/2010 (now zero, sold the last ones in the quarter through September 2025).
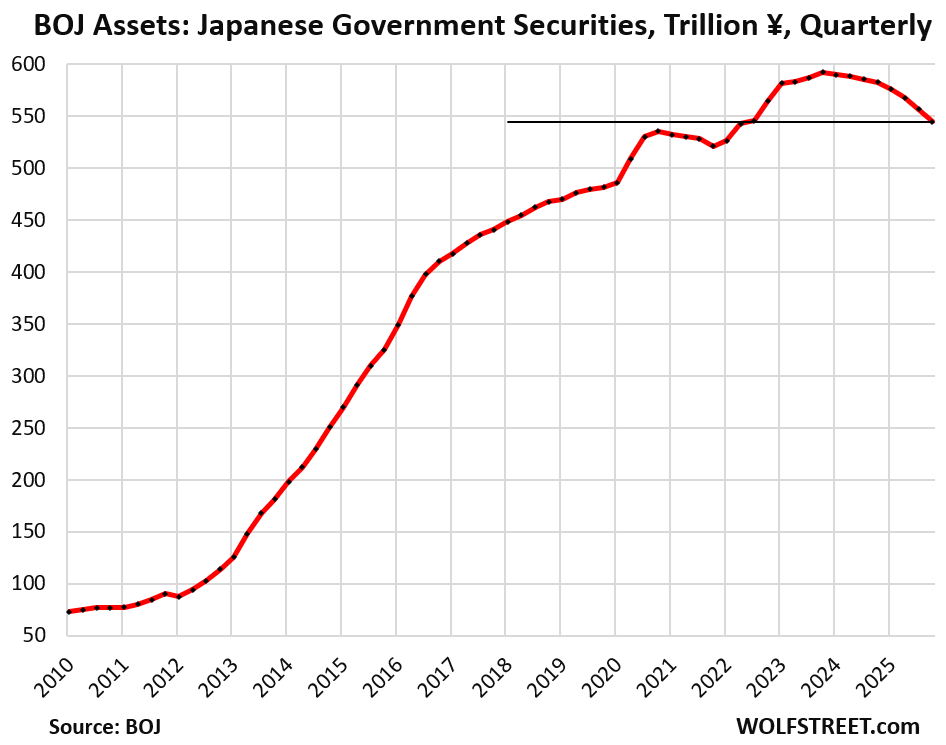
Japanese government securities declined by ¥12.4 trillion in the quarter through December (-$79 billion), the biggest quarterly drop since QT started in early 2024.
At ¥544 trillion ($3.47 trillion), they’re at the lowest level since the quarter through June 2022.
All of them are now Japanese Government Bonds (JGBs); the last Treasury bills matured off the balance sheet in the quarter and were not replaced.
Since the peak in the December 2023 quarter, holdings of Japanese government securities have dropped by ¥47.9 trillion (-8.1%).
The BOJ’s holdings of Japanese government securities move in three-month cycles due to the timing of when long-term bonds mature and when they’re replaced with newly issued bonds of the same type. So I use the BOJ’s quarterly data in my balance sheet updates here, which iron out the three-month cycles.
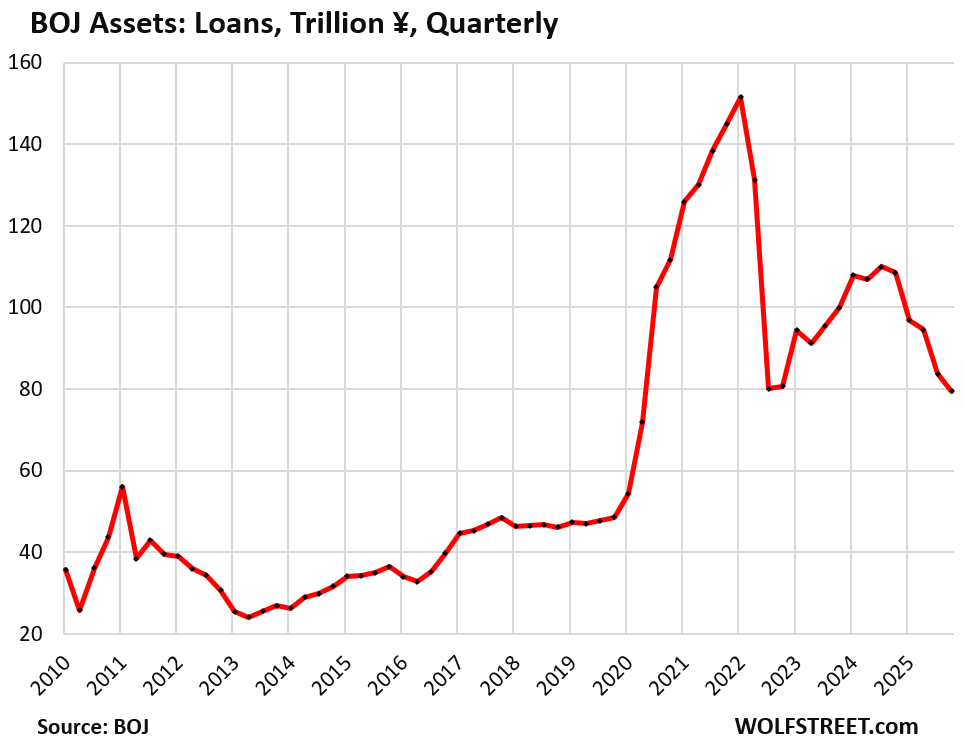
Loans declined by ¥4.3 trillion in the quarter, and by ¥29 trillion year-over-year, to ¥79.5 trillion ($507 billion).
Since the peak in Q1 2022, the outstanding loan balance has fallen by ¥72.0 trillion, or by 48%.
These loans now account for 11% of the BOJ’s total assets. The BOJ provided loans to banks and other entities under several programs, including the pandemic-era loans that caused the total amount of loans outstanding to more than triple in two years:
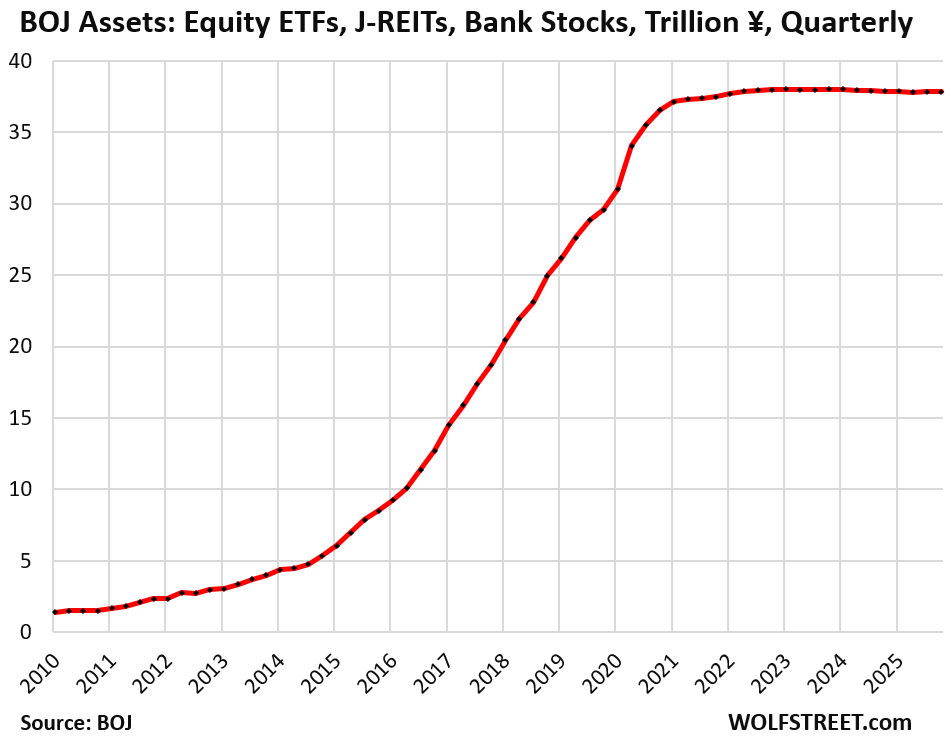
BOJ’s equity ETFs, Japanese REITs, and bank stocks.
The BOJ stopped buying ETFs and J-REITs in Q4 2023 when its holdings at acquisition cost reached ¥37.8 trillion ($241 billion).
Unlike bonds and loans that come off the balance sheet when they mature, equity ETFs, Japanese REITs, and bank stocks don’t mature; the BOJ has to sell them outright to shed them.
The BOJ sold off its last bank stocks in the September quarter. It had purchased them in the early 2000s and again in 2009-2010. In 2016, the BOJ started selling them at a slow pace over a 10-year time span. This process can be a guideline for how the BOJ will sell its ETFs and Japanese REITs: very slowly.
The BOJ is preparing to sell its ETFs and J-REITs, it said at its September meeting. The sales haven’t started yet. The initial pace will be glacial: ETFs at a pace of ¥330 billion a year ($2.2 billion) and J-REITs at a pace of ¥5 billion per year ($33 million).
But that pace is faster than it seems: The BOJ has carried ETFs and J-REITs at acquisition cost and has not marked them up to market, though market prices have soared since it started buying them in 2012. Since January 2012, the Nikkei 225 has soared by 500%! But that pace of ETF sales is at acquisition cost, while market prices of some of the ETF shares the BOJ will be selling may have tripled or quadrupled since it started buying them in 2012, and the market value of those sales would be far higher than the stated value at acquisition cost.
Equity ETFs and J-REITs were always only a small part of the BOJ’s QE operations, but the hype around those purchases in the US QE-promoting financial media was huge. Combined, they currently account for only 5.6% of the BOJ’s total assets.
Commercial paper and corporate bonds fell by ¥1.0 trillion in the quarter to just ¥2.75 trillion ($18 billion), the lowest since 2011.
Since the peak at the end of 2021, they have plunged by 76% as they matured.
They were always just a tiny part of the BOJ’s QE operations, at their peak accounting for only 2.2% of the BOJ’s total assets. They’re now down to just 0.4%.
JGB yields are slowly being freed from the BOJ, which stepped away from QE and yield-curve control, started shedding its holdings and hiking its policy rates. At its December meeting, it hiked again by 25 basis points to a still ridiculously low 0.75%, and is talking about further rate hikes – but at a glacial pace. In a sign of how long the Japanese monetary experiment has lasted, that ridiculously low policy rate of 0.75% is the highest since 1995!
The 10-year yield of JGBs rose to 2.13% today, the highest since February 1999, continuing the rise that had commenced in late 2019.
But the 10-year yield is still very low, and substantially below the rate of inflation, which has been running at around 3%.
To take some upward pressure off long-term yields, the BOJ said it would slow the pace of QT somewhat in the next fiscal year, which starts on April 1.
And the 30-year JGB yield rose to 3.50% today.
Enjoy reading WOLF STREET and want to support it? You can donate. I appreciate it immensely. Click on the mug to find out how:

![]()
Wolf, please write another article about how this impacts carry trade in the near and long term. Could this be the catalyst that deflates the US-asset bubble in a few years?
I did most recently on Dec 22:
https://wolfstreet.com/2025/12/22/yen-carry-trade-at-risk-japans-10-year-jgb-yield-hits-25-year-high-yield-curve-steepens-finance-ministry-verbally-props-up-yen/
The bubble will collapse when confidence in the Fed’s ability to stop it goes away. That’s all there is to it. All of the analysts are projecting S&P targets for end of 2026 based on momentum, and nothing on valuation.
1:04 PM 1/6/2026
Dow 49,462.08 +484.90 0.99%
S&P 500 6,944.82 +42.77 0.62%
Nasdaq 23,547.17 +151.35 0.65%
VIX 14.75 -0.15 -1.01%
Gold 4,505.00 +53.50 1.20%
Oil 56.98 -1.34 -2.30%
Not just in the U.S., but markets around the world. We’re in a global asset mania, that is in part due to debasement of currencies, and in part due to pure mania.
The “pure mania,” is endemic. There’s a burgeoning adult generation that has never seen a “down day,” that wasn’t a dip to be bought!
The rolling-crisis state of the world has been in progress since before the dot-com. After the “lost decade” in tech stocks the plan has been the wealth effect. They didn’t have that concept codified in ‘08, but used that crisis to “perfect” the bubble machine. (As seen in nothing but “V” shaped “recoveries”).
Ever since? No bubble, no crash, only smooth sailing. The GFC is only a myth to the average 18-25 year old.
Right, that’s exactly it. Everyone believes the Fed and Congress will do whatever it takes to maintain the bubble. Therefore, they buy no matter what. You keep that up, and it becomes a feedback loop.
Gravity pulls them together. US30U – Japan 30Y: 4.86 – 3.5 = 1.38%.
US10 – Japan 10Y: 4.18 – 3.0 = 1.18%. For both the lowest spread in decades.
Which is occurring at the same time both term spreads and credit spreads are compressing across the industrialized world. First they compress. Then they exhale / explode. It’s always been that way when risk has been underpriced.
Might as well buy Brazilian Real bonds and hope the 14% yield leaves us something after inflation.
Correct!
This is NOT contained.
Even with the lower spreads, it seems to have no effect on JPY.
Buying a Japanese bond while yields are shooting upward seems like grabbing a falling knife. I guess others agree, which is why the knife is falling!
I still wonder at what point could bond losses cause bank failures in Japan – like we saw in 2023, some months after bond yields spiked in the US?
I also wonder if this is the Minsky Moment when Japan’s indebtedness catches up with it, and a debt spiral starts.
Coming to the U.S. bond market soon…
“slowly then all at once”
LOL.
Japan is an economic hot mess coming.
-China is blowing past Japan’s life blood in quality manufacturing (like quality, lower cost). This is probably the greatest threat to Japan, economically.
-Japan has a ~230% debt to GDP ratio. Most debt is owned internally by BOJ and Japanese.
-Japanese demographics are some of the worst in the world and their culture does not support immigration in any meaningful way.
-Japan has no natural resources to speak of must import all its energy and other raw materials.
-The US is very likely going to be changing its past military support of Japan and eastern and western spheres of influence become more separated. That is, it is entirely possible that the US will slowly withdraw from the ridiculous position of telling China what it can and can’t do with Taiwan.
-The Japanese are extremely resourceful people. The country isn’t going away, but its past dominance/role in Asia will end and likely very soon.
Immigration is not the solution to a problem (assuming it is one) or a declining population. The solution is to make conditions, both economic and cultural, more hospitable to having children.
I don’t understand currency trading but bought FXY as a hedge against loss in the dollars buying power. Part of my rationale is that BOJ is likely to continue QT while USA is likely to continue QE. I’m afraid the positive feedback nature of news feed algorithms has made me a permabear and this was not a good move. Please confirm my suspicion that I’m an idiot
I will confirm that you (or I for that matter?) don’t understand Forex/ currency trading.
The DXY is the dollar index, which measures the USD against a basket of currencies, primarily the Euro, and also including the Yen.
This has nothing to do with the dollar’s “purchasing power” domestically, which is measured by inflation (CPI). It’s a good indicator of where to go on vacation: the USD strength a few years back made Europe “cheap.” Japan has been in that position for a few years.
Next: the USA is NOT doing QE. The US has been doing QT in a big way, until the end of last year (per Wolf Street… and Fed minutes etc).
Finally: a bet on Yen Strength should be nothing more than a swing trade IMO (it may be at a turning point?). Strong support for USD:JPY in the 140 zone, resistance at 160, currently about 156.7 (and maybe a local top?).
This is NOT trading, investment or financial advice in ANY way shape or form! Best of luck!
Great synopsis of the DXY. I will only add that it is a basket of currencies from countries (or trade zones) that all seem to be taking turns printing their currencies for their own oligarchs. When one country is printing, it’s a good time to visit. In the end, it’s the average wage/salary earner everywhere that gets screwed.
For me, as an American, the bigger picture is the fact that America is not acting in a responsible manner and therefore risk (or our own credit worthiness) is being repriced globally. While I do not think this means an end to the Federal Reserve Note (FRN) any time soon, it most definitely will accelerate the development of trade mechanism that operate outside of the FRN-based system. History is very clear on really only one thing. People around the globe like and need to trade goods and services, and when goods and services stop crossing borders, troops will. At the end of the day Nature (math, physics, and demographics) always wins and capital and talent go where they are respected.
Wolf, can you clarify this? Japan is often described as being in worse fiscal shape than the U.S., but my understanding is that in 2024 Japan collected about 75 trillion yen in tax revenue and paid roughly 10 trillion yen in interest on its debt. That implies only about 13% of revenue goes to interest, which is not bad?
Most of Japan’s longer-term debt, issued years ago, has interest rates close to 0%. The average interest rate on Japanese government debt = 0.8% (pink line in the chart from the MOF). Plus, the BOJ holds over half of that debt, and remits its income from those holdings back to the government. That’s the result of decades of QE and one decade of YCC. Now Japan has 3% inflation.
The average US Treasury rate = 3.3%
This chart still boogles the mind. Everyone knows it is not sustainable, yet no one talks about how it turns out…
It would be interesting to see a chart over the same time period showing the price of gold in yen.
Interesting times.
Wolf: I’m so glad that you cover this with your usual brand of data, thanks.
Could you help me wrap my head around what exactly is going on with the JPY/USD pair? Plenty of sources out there say it’s artificially high due to the carry trade and that the natural exchange rate should be somewhere in the 130 range, but then the same people have also been saying the rate should come down now for a couple years. They probably also bought the line that inflation was transitory (ha).
The carry trade well predates the rise in exchange rates, so while its collapse would definitely affect things it’s not the primary cause. The Fed vs. BOJ rate delta is steadily closing, and yet exchange rates remain in the high 150s, even moving up this morning. Many here mention how the JPY price of gold has skyrocketed recently.
Now, I know the new PM’s economic policy is one factor keeping the pair high as it makes the market bearish on BOJ rate hikes, which should still happen, just maybe a bit slower.
I’m used to the exchange rate more in the 30-year ranges of 100-120 and thought this whole 150-160 business would blow over in a couple years. The 130s still sounds like a reasonable direction over the medium term. What indications do you see on whether that’s still true, or if something has fundamentally changed now that Japanese inflation is back in play? Are bonds/central bank rates central to the discussion, or is there something else to watch?
Is the exchange rate swing the last few years more about Japan or the US, or maybe some 3rd party global factors?