Strong consumer spending growth (despite Sour Mood), big improvement of trade deficit, and government spending growth after two quarters of declines.
By Wolf Richter for WOLF STREET.
Today’s GDP report, delayed by the government shutdown, was the “initial” report for the third quarter. Data collection for it occurred before the government shutdown. It replaces the “advance estimate,” which got canceled due to the shutdown at the time, and the “second estimate” (originally scheduled for November 26). So this release is essentially the “second estimate” and includes the revisions that would have been part of the second estimate.
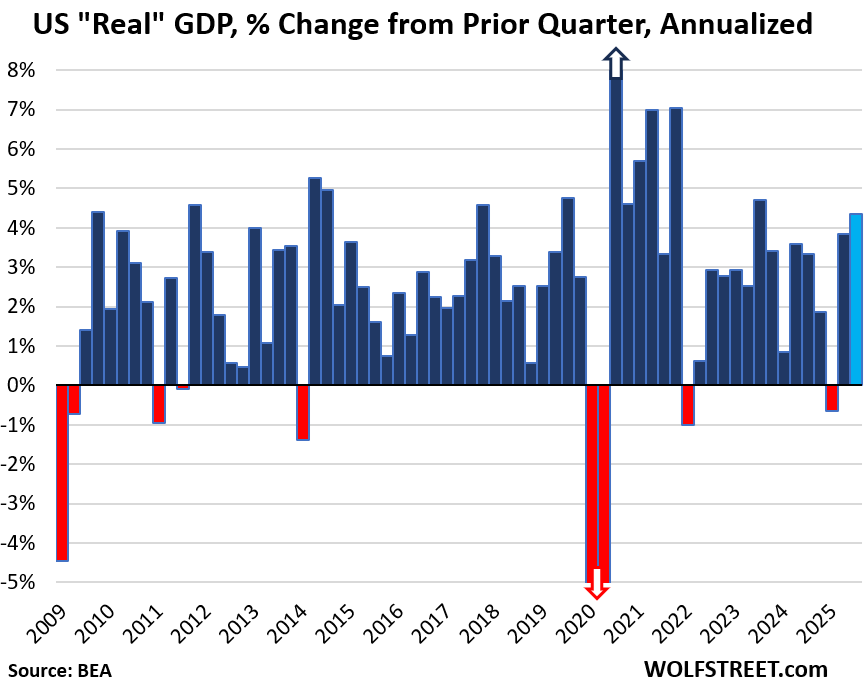
And WHOOSH went the economy in Q3. Gross Domestic Product, the broadest measure of the economy, grew by an annual rate of 4.3% in Q3, adjusted for inflation, after the 3.8% growth in Q2, and the -0.7% decline in Q1, according to the Bureau of Economic Analysis today.
By comparison, in the years between the Great Recession and the pandemic (so excluding recessions), average quarter-to-quarter GDP growth was 2.5% annual rate. The average 20-year quarter-to-quarter GDP growth, including recessions, was 2.2% annual rate.
The decline in Q1 had been driven by an explosion of imports due to tariff frontrunning. Imports deduct from GDP; exports add to GDP. But that frontrunning of tariffs in Q1 and other trade shifts due to tariffs caused a dramatic improvement of the trade deficit in Q2 and Q3, from the horrible levels of Q1, contributing substantially to the high growth rates in both quarters.
Consumers also pitched in and spent hand over fist, despite their allegedly very sour mood as depicted by these silly consumer sentiment surveys. Consumer spending, adjusted for inflation jumped by 3.5%, the highest since the red-hot quarters last year.
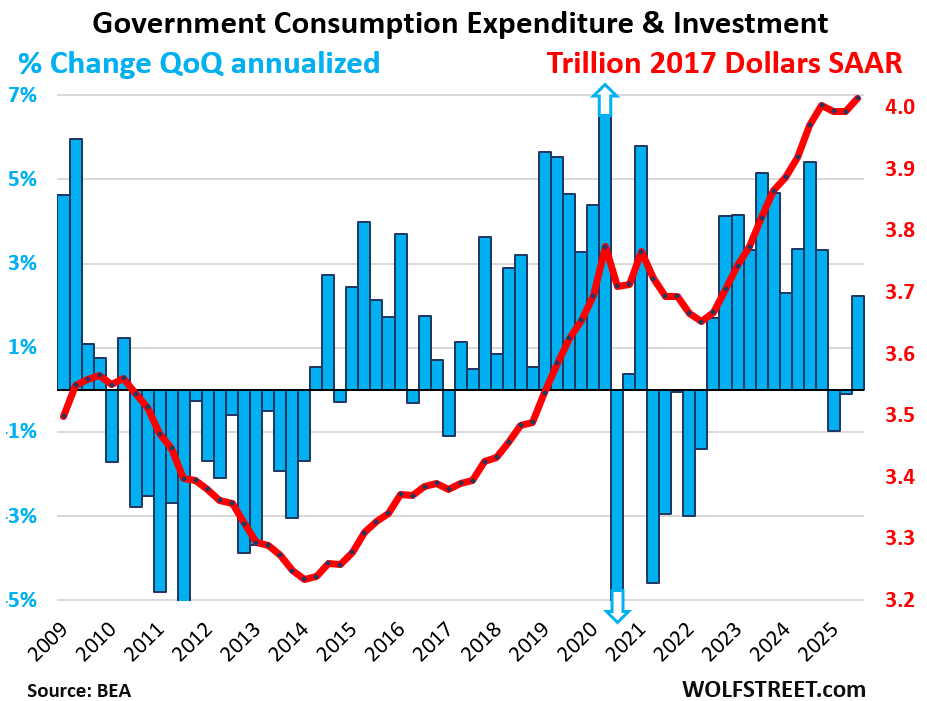
Government consumption expenditure and investment (federal, state, and local) also rose, after two quarters of declines.
But Gross private domestic investment deducted 3 basis points from GDP growth, with fixed investment adding only 19 basis points (as residential fixed investment continued its plunge, while other fixed investment rose), and with change in private inventories deducting 22 basis points from GDP growth. So this time, no help from the investment department.
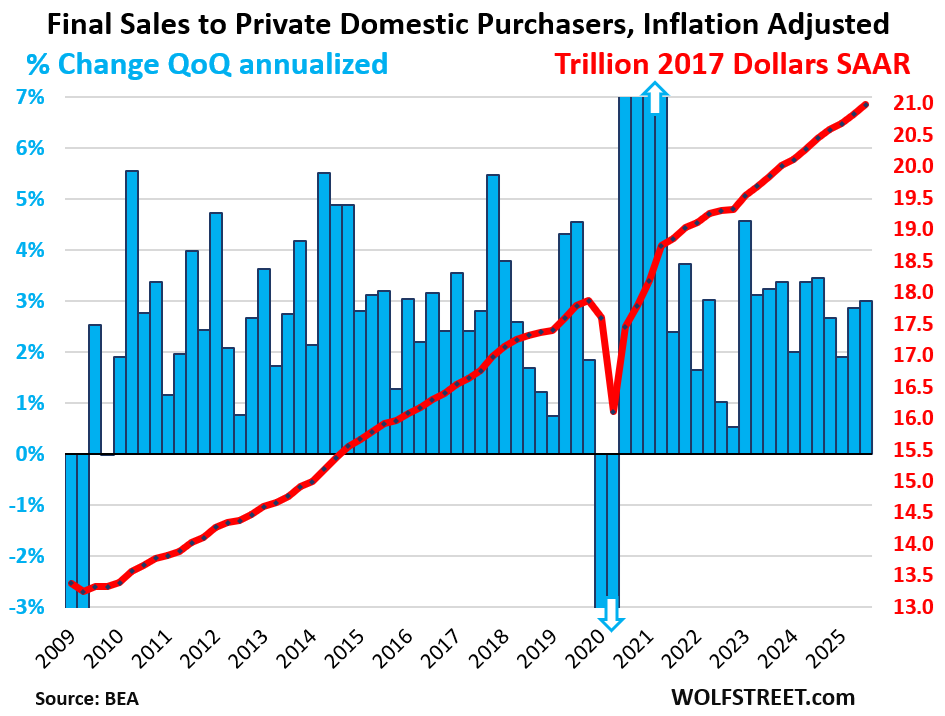
The core of the private US economy, “Final sales to private domestic purchasers,” excludes the above complications of exports, imports, government spending, and changes in inventories. This measure rose by an annual rate of 3.0% in Q3, adjusted for inflation, the best growth rate since Q4 2023. So at the core, the US economy continues to hum along at solid growth rates.
Here is overall GDP growth, adjusted for inflation.
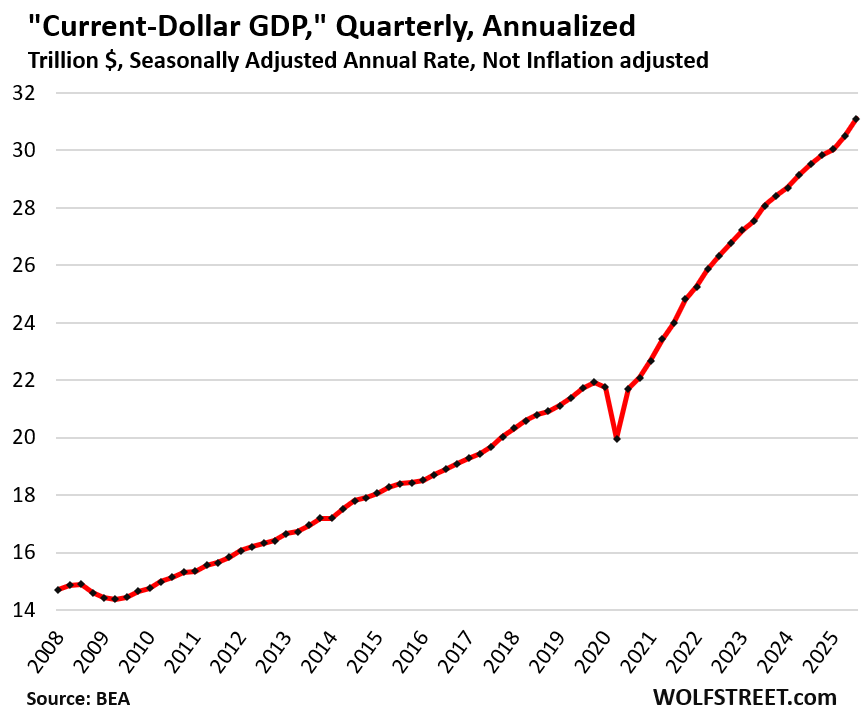
Not adjusted for inflation, “current-dollar GDP” grew by an annual rate of 8.2% to $31.1 trillion, after the 6.0% growth in Q2.
This “nominal GDP” represents the actual size of the US economy in current dollars and forms the basis for the Debt-to-GDP ratio and similar GDP-based ratios.
The chart shows current dollar GDP, expressed in seasonally adjusted annual rates. You can see the sharp acceleration over the past two quarters, following the dip in Q1:
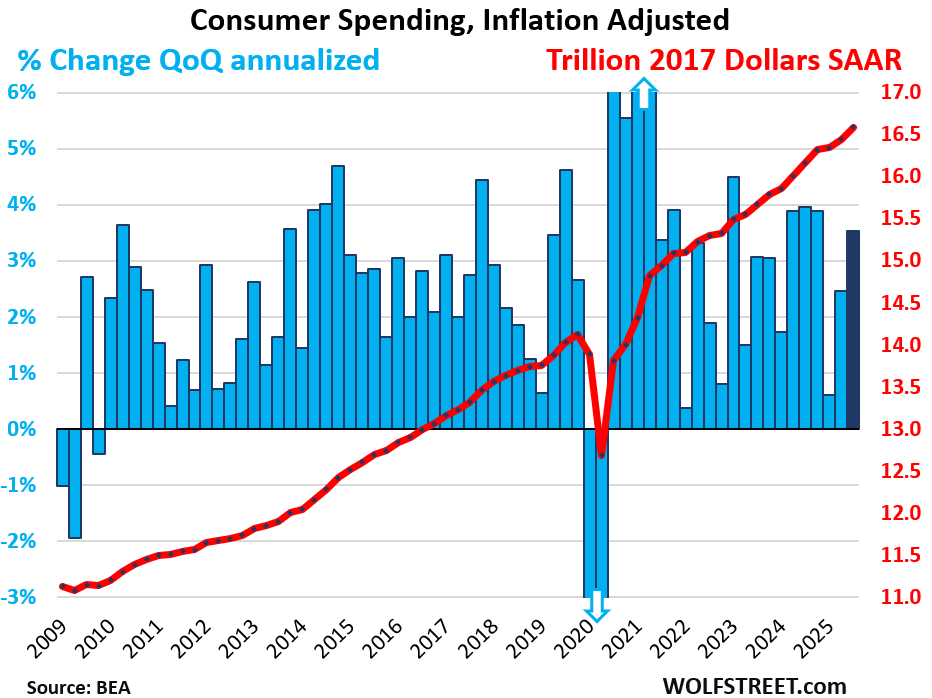
Consumer spending rose by an annual rate of 3.5% in Q3, adjusted for inflation, to $16.6 trillion. This growth rate added 2.39 percentage points to the GDP growth of 4.3%.
Consumer spending accounted for 69% of the US economy.
The spending growth was spread across goods and services:
- Services: +3.7%.
- Durable goods: +1.6%
- Nondurable goods: +3.9%.
The blue columns show the growth rates (left axis), the red line shows the dollars (right axis), all in seasonally adjusted annual rates (SAAR):
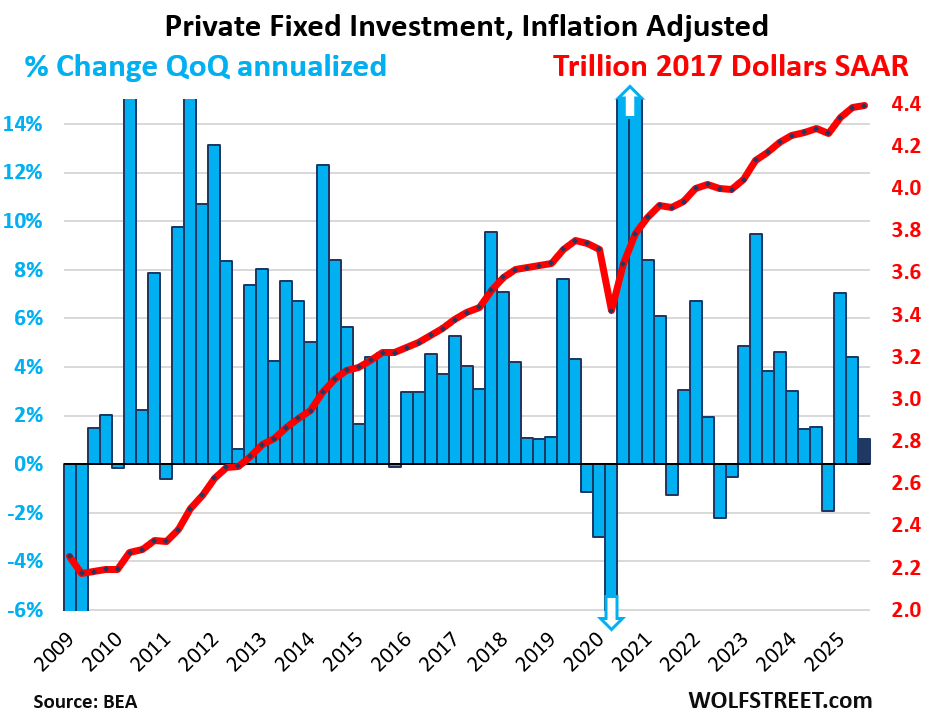
Private fixed investment, which excludes changes in inventory, rose by only 1.0% annualized and adjusted for inflation, after having jumped by 4.4% and 7.1% in the prior two quarters. Of which:
- Nonresidential fixed investments: +2.8%:
- Structures: -6.3%
- Equipment: +5.4%.
- Intellectual property products (software, movies, etc.): +5.4%.
- Residential fixed investment: -5.1%.
Private fixed investment accounted for 18% of the US economy.
Government consumption expenditures and gross investment rose by 2.2% annualized, adjusted for inflation, after two quarters of declines.
Federal government spending rose by 2.9% annualized, after two quarters of declines, on a jump in national defense spending, while nondefense spending continued to decline for the third quarter in a row:
- National defense: +5.8%
- Nondefense: -1.1%
The increase in federal government spending added 19 basis points to the 4.3% of total GDP growth.
This does not include interest payments, and it does not include transfer payments directly to consumers (the biggest part of which are Social Security payments), which are counted in GDP when consumers and businesses spend these funds or invest them in fixed investments.
State and local government spending rose by 1.8%, the slowest growth rate since Q4 2022.
Combined, federal, state, and local government consumption and investment accounted for 17% of the US economy.
The majority (61%) of government spending came from state and local governments. Federal government spending accounted for 39% of total government spending.
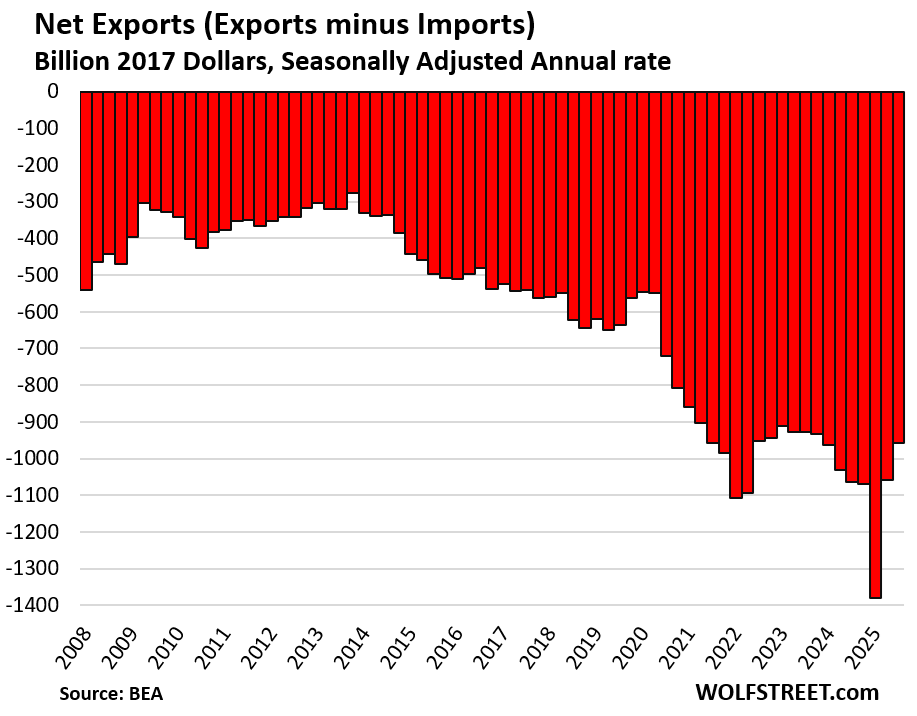
The Trade Deficit improves.
Imports dropped by 4.7% in Q3, to $3.66 trillion annualized after having already plunged by 29% in Q2, more than undoing the entire historic tariff-frontrunning spike in Q1. Imports are a negative in GDP, and when imports drop, they improve GDP.
- Imports of goods: -7.5% to $2.93 trillion
- Imports of services: +6.3% (includes US tourists spending overseas) to $721 billion.
Exports jumped by 8.8% in Q3 from Q2, to $2.70 trillion. Exports are a positive in GDP.
- Exports of goods: +7.4% to $1.77 trillion.
- Exports of services: +11.2% to $933 billion (includes foreign tourists spending in the US).
“Net exports” (exports minus imports) improved further to an inflation-adjusted trade deficit of $957 billion, the least bad trade deficit since Q4 2023, and a level first seen in Q3 2021.
The core of the private US economy: “Final sales to private domestic purchasers,” included in the GDP report today, is a measure of the private US economy. It excludes exports, imports, government consumption expenditures, government gross investment, and changes in inventories. It covers about 87% of GDP and represents the core of the private US economy.
Final sales to private domestic purchasers rose by an annual rate of 3.0% in Q3, the best growth rate since Q4 2024, to $21.0 trillion.
The Fed needs to watch out. The economy is running hot. This makes for two quarters back-to-back with hot economic growth, driven in part by strong consumer spending, despite all doom-and-gloom consumer sentiment surveys.
Maybe economic growth is slowing down in Q4, and maybe it will slow down next year, or whatever. But those are speculations. Consumers have surprised quarter after quarter. They’re making record amounts of money, and they’re spending it, and they’re saving some too. The trade shifts are now coming into focus. And the much-discussed decline in residential fixed investment is overcome by increases in other categories of fixed investments.
The last CPI inflation report was marred by missing data due to the government shutdown and gave misleading inflation figures. This is not an economy that needs a rescue through rate cuts. This is an economy that is a feeding ground for inflation.
Enjoy reading WOLF STREET and want to support it? You can donate. I appreciate it immensely. Click on the mug to find out how:

![]()
Thanks Mr wolf
I’m going to jump in and point out the absurd scenario that Wolf has documented trying as best he can, to avoid a biased interpretation of the state of the world.
The only solution is love. Merry Xmas
Yep. Time to pause the cuts for the foreseeable future.
I’m one to believe that cutting rates doesn’t really lead to employment growth..just fatter margins.
Exactly
The game, the misdirection narrative is that somehow lower rates…..already lower than historical norms….will some how reverse layoffs and improve employment for “Main Street”. But unemployment is still under 5%.
What is killing “Main Street” is the failure of the Fed to combat inflation.
Nearly everything is at all time highs and the Fed cuts. Its is remarkable.
And the deficit spending continues because the cost of borrowing is being sheltered by Fed gimmickry. IMO
The Fed aims at the “public bucket” but misses into the “elite bucket”. Darn. Almost every time.
That is the question that the every day American people are unaware of. They are focused on the job loss in America while our government shepherded the transfer of the American manufacturing base to the low cost labor force. A failed communist society facing the eternal choice:
To offer to build everything for a lot less than the idiot American patriot that still believes.
All the while, the so called Supreme Court have defined the only legal activity is fraud. Their misguided decision suggests that the President has a the rite of Kings to be immune from prosecution.
I agree to chill on the cuts and feel 3% is the new 2% anyways.
But Actually Rate Cuts Impact More Than Margins –
Labor / Employment
Banking & Financial Markets
Business / Corporate Finance
Households / Consumers
Housing / Real Estate
“…cutting rates doesn’t really lead to employment growth..just fatter margins…”
It’s all about straight up to the right asset price appreciation. Greedy assholes have destroyed the country for their precious “wealth effect.” There is no amount of money that is enough for them, and no level of poverty and misery among the masses that will stop them.
I’m convinced that billionaires are in this club where they are fighting to move up spots every year on the Forbes list. If one guy has $17 billion and another guy has $29 billion,, there isn’t much on Earth that the 29 guy can buy that the 17 guy can’t. So really they are just in competition with each other for a psychological effect of knowing “I’m gaining ground vs. my peers”. And that’s why it seems that no amount is ever enough for them.
Inflation percent used should be closer to 8% and not a single person will change my mind. I bet we see 15%-20% inflation within a year.
You chose to believe, regardless of actual fact, you live in bliss. Such is the world today, disregard what actually is, and chose to believe, yes, Virginia, there is a Santa Claus! Merry Christmas!
I sit down twice per year and figure out how much I have spent in the past 12 months. So I know what my inflation has been. Each person’s personal inflation rate is unique of course. I’ve been surprised that my own inflation tracks pretty closely with the BLS numbers. Usually within .1% either way.
It is easy to remember the ridiculous increases in auto and home insurance which has been 15 to 18% annually the last three years. Along with certain items purchased at the grocery store. Easy to not notice things that don’t change much or even go down slightly. Overall my inflation rate is no where close to 8% currently.
They just faked CPI, so you are not to blame for believing as you do. It’s the natural reaction of somebody who is being gaslit by a cabal of greedy mothertruckers who are rendering your once-great future into delicious profits for their bank accounts in the present. You will pay. You will pay dearly. They will laugh and live like kings.
In my opinion, the problem is not the percentages of price increases (except for housing, as OER is a terrible measure), but the weighting.
It only works if your spending is based on the “average” they assume.
U-Hal trucks are delivering Xmas stuff along with USPS, UPS,
AMZN, FedEx and WMT private guys with a camera. In Jan they will cannibalized each other. The middle class are buying in Dollar General. The rich sent Saks Fifths Ave to the recycle bin.
Last few years I’ve been a real Scrooge when it comes to spending.
I bet I get scrooge now, he prob had a hard upbringing. Finally got all his bills paid and out of debt, then he learned how good interest is for your bottom line!
Then every beggar on the high street comes a calling.
Bah Humbug I say!
😆 🎄
The positive I take from this is less likely to have rate cuts or at least fewer rates cut. If an economy was like a rising tide I would take away more positive from it. Not suggesting it is bad news by any means, just not particularly relevant in how I personally evaluate. To me it isn’t a contradiction to see a sour mood among consumers despite solid overall consumer spending and GDP.
Wolf, what about “productivity”? Could that be increasing and thereby justify lower rates?
There is no direct link between productivity and interest rates. Rising productivity is going to first and foremost increase profits — which is why companies go after increasing productivity. Companies are not going to voluntarily pass on their profits to consumers. Competition might force them to, but the thing about inflation is that companies have the confidence that they can get away with price increases. And as we have seen, corporate profits exploded during the big inflation years.
It’s lonely on my one-man island at times. Nonetheless, I continue to boycott Doritos, Name Brand Soft Drinks, Disney, NFL, Etc….
I’ll keep doing my part, if for no other reason than necessity. You can count on me to hold a grudge and keep those corporate profits smaller!
Happy holidays.
Yet you buy the off brand lower quality ingredient white box products to help the rando companies??
Like Aldi happy puffs or Trader Joe’s adventurer Rick Apple tarts?
Somebody is getting your fat dirty dollar
💵
Pro tip, the off brand is not always lower quality. In many cases you are paying for the name and that’s it.
I sat through a presentation by a bunch of heavy hitter insiders of HVAC recently. They had lots to say about AI, but the juicy stuff was related to prices and tariffs. Paraphrasing, industry is assuming tariffs are now a permanent fixture and will persist through any regime change. The government never gives up an income source.
One manufacturer also said point blank that they are NOT reshoring production, they spent decades building those relationships and supply chains – they will simply raise prices.
If other another manufactures reshore all or part of the production and don’t raise prices, than that big-mouth China-lover is going to go out of business or cut prices. Competition is a nasty thing. Customers set the actual transaction prices, not seller. If customers don’t go along with the price increase, the seller is f**ked.
HAVC is in the process of becoming the next Home Depot- Lowes of America. Big funds like Blackrock are gobbling up ma and pops in big markets. This has allowed the concentration of the market and will keep pricing grossly high and service crappy. Fast forward 10-15 years many more industries will follow in the footsteps of this transition. Remember the corner pharmacy. 20 years ago Walgreens was a dollar store with a small pharmacy now your choice for a prescription is CVS, Walgreens, or Costco. Consumers loose in the end with higher prices and poor service not to mention the disappearing small owner that spent their profits locally. In my industry it won’t be long before you will have only Redfin or Zillow to turn to to buy or sell a home.
motorcycle john,
Private equity companies have been acquiring quite a few long-time family-owned HVAC, plumbing and home remodeling companies in the Twin Cities. This is being done very discreetly, as the companies want to maintain the appearance of being locally owned and not run by PE organizations.
Here is an example of this. It is from an attorney’s website that caters to these transactions:
“Minnesota Company Acquired by National Home Services Investment Firm”
“May 21, 2024, Dean’s Home Services—a leading provider of plumbing, drain and sewer, and water heater services in the Twin Cities—relied on Maslon to successfully guide it through its recently completed sale announced May 21, 2024. Dean’s, which was founded in 1996 and serves over 10,000 customers, was acquired by Redwood Services, a home services investment firm focused on investing in leading residential HVAC, plumbing, and electrical services companies in growing markets.”
“Dean’s owners, Jeremy Shepard and Stephanie Olson, will retain a significant minority ownership stake in the company. The existing team will continue to operate and manage the business under the Dean’s banner and name, while Redwood will offer operational, strategic, and financial support to enhance the company’s growth.”
On the home remodeling front, in early November of this year, Minnesota Rusco shut down. It had well over $100 million in debt and less than $10 million in assets. The culprit? Texas-based Renovo Home Partners.
“In its commercials, Minnesota Rusco claims to have been in business since 1955, offering services from window and siding replacement, decks, kitchen and bath remodeling and roofing. In reality, the company’s Minnesota roots were pulled from the ground three years ago, when Rusco was acquired by Texas-based Renovo Home Partners.”
Renovo is a Private Equity shell.
Anyone who needs these services for their homes, should take a close look at the ownership structure of the companies that they are thinking about hiring, I reckon.
Prairie. You are so right. The pest industry is also under attack! The small local companies have sold or closed here locally and the PE guys now have a big foothold. Now if you want to have your home sprayed for insects you need to sign up for a yearly contract before any work is done at twice the cost. This is going to result in more home owners searching the web on how to videos and tackling the job themselves while they can. Soon local building codes will be changed requiring a license claiming the chemicals if not properly used would result in an environmental issue. These new laws will be pushed by the PE lobbyists to force home owners to succumb to this conspiracy. Also to further hinder the small local guy, more requirements will be enacted like OSHA choke holds that will cost the small guy as much as the corporate guys but the cost spread out over 500 employees is pennies per employee. The small guy or one man band will go broke complying.
Moto John, do you mean BlackSTONE rather than BlackROCK? Big and important difference.
Thanks for everything you do Wolf! Have a Merry Christmas and a Happy New Year🌲
Thanks Wolf’
SAAR: Seasonally Adjusted Annual Rate, But, also Sa’ar is Hebrew for Storm. May you all weather the upcoming Storm.
The Algo got the Bulls Tee d up for Santa rally that historically starts tomorrow, Wednesday, December 24, 2025, and goes through Monday, January 5, 2026. Will they hit the ball or miss? Am I the last bear? Did Gold hit its target today? Have fun!!
The shamelessly proffered idea that productivity will result in higher wages commensurate with the increase in productivity. For the last 50 years the so called productivity dividend has accrued to a class of people that don’t believe that the Constitution, beginning with the flagrant disregard of precedent, choosing instead to prove the historical skeptics correct in their warnings about the danger of thinking that a Republic has a hell of a chance of surviving.
The optic of a connected silicon valley company invented as a suckling on the tit of the mama pig the so called defense budget
I saw one of them bought a trophy property in Colorado.
The worst person winning is an excruciating experience
Do real free price discovery markets conduct “Santa” rallies?
Or is it team work by the money managers (and the Fed) to keep packing makeup on the markets “face”?
There is every indication that money is “too cheap”……from markets and metals, to consumer prices, to consumer activity. What was the Fed thinking? Santa maybe? Cheerleading.
I just have a comment regarding the video and the astounding vertical move in metals, I looked at the chart of the silver ETF (SLV) going back 20 years, and the last time it was this far above its 200 day average–more than 70 percent– was April of 2011, and then it dropped from $47 to $33 (30%) in five days. I’m not making any predictions, just an observation.
Thank you for watching the videos. A new one almost every day. They’re interesting — Chris gets into lots of technical trading stuff.
Where do I go to view the videos?
Harvey,on top of comments this page.
Thanks!
My theory is people have too much excess money and want to gamble with it.
So you had Bitcoin at 120,000 or whatever , then it totally cratered by a 1/4th .
I mean that’s INSANE. If the S&P sank by 25% you would hear the moaning from the tallest peaks.
But it’s extra cash, so these people don’t really care.
So anyway, maybe that’s why all the metals and bitty bit coins are (or were 😂😂) up.
Nobody wants a traditional risk profile like the S&P, which is pretty friggin risky! They want to fill on gamble.
The professional money mangers are saying Gold and silver are not correlated to equities and that people should own them as a hedge for everything. In reality they are another momentum race horse people are getting high off. These blow off tops are people getting high with a rush, like a crack head that’s why they can’t see the Truth. Gold like land goes up with the rate of inflation. When the drop happens soon and the Maniac speculator fever(MSF) breaks gold will return to $2650 quickly than reassessed. No hiding places in liquidity mop up vehicles. I think Gold peaked yesterday but I think all liquidity mop ups have peaked with it and will collapse in value. The financial world now is Japan at its peak and the USA in 29, it’s going to take time to heal from this fall :):):) enjoy the season! Thanks!
Short bonds!
You have to pay the dividend every month. You also risk big losses if the economy loses steam or stocks have a bear market (very possible in my opinion) and the Fed needs to lower rates for a genuine, legitimate reason.
I just heard the S&P might have to reprice due to these rate cuts.
That’ll be fun
There was a massive conversion of low velocity time deposits to high velocity demand deposits. Never seen anything like it other than a redefinition of the money stock. That should spark gdp.
Hi!
spencer-
“Short bonds”
Are you using “Short” as a verb or an adjective?
Merry Christmas
Perhaps the stupidest rate cut in history.
Prob due to the fact the fed didn’t want to be occupied and forced to drop rates to 0.
An “understanding” (for now) if you will.
All they are doing is prolonging the inevitable. The Real Estate Guy wants 2% mortgages and he will fire anyone who gets in the way.
Should be quite a show, when viewed for a more than healthy distance.
Yeah but if it will be interesting to see what the 10 year does. If you cut into an inflationary environment it will go up. Then again we just showed we don’t care about real data….
The Fed had a brief brush with sanity in 2022-23 and now they are back to being reckless because it’s what Wall Street wants. And Trump wants those asset bubbles propped up too, he is mad at Powell for not being reckless enough. It is a bad situation.
The 1/2 trillion dollars increase in our means-of-payment money supply will not be “washed out”.
Overheated rooms in the Econo-lodge? Have a soothing glass of ice cold Bitcola! Wait..how can you tell if the glass is half-empty or half-full if you can’t see the product? Oh well, we can always go battleship shopping instead. Time for a bakesale. Let’s get those ICBM’s out the door. It’s big stick clearance days for Christmas. Mall’s open 24/7. (No cash exhanges permitted. Pennies will be rounded up to the nearest trillion.)
Hellvis needs boats! Hellvis needs boats!
Hellvis, Hellvis, Hellvis,
Hellvis, Hellvis, Hellvis,
Hellvis needs boats!
(RIP Mojo Nixon 1957-2024)
“Residential fixed investment: -5.1%.” I guess the new housing sickup continues.
A lot of that is the slowdown in multifamily construction, after years of the biggest boom since the 1980s. There are many cites with massive oversupply of brand-new and not yet completed multifamily buildings.
This “ Justice Department Reaches Proposed Consent Decree with LivCor, One of America’s Largest Landlords, to Resolve Information Sharing and Algorithmic Coordination Claims.” And multifamily coming on line could help the inflation numbers eventually.
“And multifamily coming on line could help the inflation numbers eventually.”
Yes, it’s already doing that in some of those markets, where lots of new higher-end multifamily buildings need to get filled with tenants, and they’re offering deals and rents that are competitive with older buildings, and so tenants upgrade for the same rent, and it pushes down asking rents in the older buildings. In some of the markets with this new supply, asking rents are now falling.
But in other markets, asking rents are jumping such as in the metros of Chicago and San Francisco.
You were spot on regarding the housing construction scene months and months ago. Great early warning on that one!
Tips tips tips tips buy your tips.
Also a takeaway from the feeling of late:
We’re miserable but living in Eden. 🤔
“Consumers also pitched in and spent hand over fist, despite their allegedly very sour mood as depicted by these silly consumer sentiment surveys.”
Money doesn’t buy happiness.
“Money doesn’t buy happiness.”
No,nut as David Lee Roth said it can buy you a yacht and you can park right next door to happiness!
Wolf, fiscal deficit overall as percentage of GDP is decreasing. Isn’t that a good trend? I mean the debt to gdp since gdp is so strong.
So the “debt” (not “deficit”) to GDP ratio rose in Q3 to over 120% again, as the debt grew faster than nominal GDP. The debt jumped in Q3 to make up for the debt ceiling when the debt was fixed for 6 months. So that may not be fair. Q4 should give us a better read.
But yes, an economy that outgrows the growth of the debt would relieve fiscal pressures. But the people are paying for it through inflation. That has been a theme here for several years. This can easily get out of hand. And if the Fed is lax on inflation, it could be a big problem.
” And if the Fed is lax on inflation, it could be a big problem.”
If being lax is having inflation (core cpi) over 2%, I would suggest they are and have been lax. How many consecutive months over 2%? Around 50?
Inflatio-lax, may lead to economic flat-ulance?
It has not so far. Years ago I knew: the American Consumer has an indomitable spirit that is hard to break!!!
I also foresaw, at the time, a stagflation that has yet to show up (in the “numbers,”) despite likely being present in many individuals’ lives.
It goes back to the “recession risk” graphic I saw. Colorado? Probably in a recession risk; also not a huge contributor to national GDP. The split economy of the “real” and the service of recreation: tech and energy are fine, RE is delivering some big wins; few and far between.
At some point the Federal Government will give away most of their tax income to buy votes as they realize they can just print the funds that they no longer get through taxes. If all federal income tax was eliminated it would destroy a vast industry of financial tax advisors ,collectors, lawyers, seminar speakers, and preparers freeing up these individuals to work at something that actually produces something of value.
This would no doubt be inflationary but every 4 years the politicians would have a real report card based on the inflation rate. If they spend too much and inflation is too high vote in the next guy and hope he or she or “they” do a better job.
So much frustration, anxiety, work, and useless energy goes into taxes. The only advantage is the governments ability to control or incentivize behavior, and the wealthy who game the tax system to their advantage.
Buy some gold, silver, etc.. Wait for the inevitable. Governments spend to much money and eventually go broke.
I heard a good one the other day. The Swiss government printed lots of Franks to satisfy demand when the dollar dropped. Then bought gold with the extra money. How many bitcoins, dollars, yens etc are just printed and used to buy gold?
LOL, if you print bitcoin and buy gold, the seller has to buy the exact same amount of bitcoin from you, and sell the gold to you. What does that gold seller know that you don’t?
I often wonder if the amount consumer spending doesn’t slow down due to the ease of online shopping. And this habit was reinforced with pandemic lockdowns.
Going to the store is a different experience where people used to think twice about buying things. Even going to store was a chore that people sometimes just stayed home unless absolutely necessary.
Feeding ground for inflation.
That is what I am afraid of.
Dang.
Might be one of the reasons precious metals are surging up. People smell potential inflation and are looking for hedges.
Jerome Powell announced to the world that he was going to “let it run hot.” And he still is. Jerome Powell, Janet Yellen, Ben Bernanke and Alan Greenspan should be in prison for what they have done (and continue to do in the case of Powell).
There was absolutely no good reason whatsoever for the last rate cut. They have no cover for that.
Hang tight DC
More rate cuts coming whether the inflation is hot or not.
Think what would happen when a new fed chair comes in may 26.
Hedge accordingly as current administration would fudge data to mask reality .
Thanks WR for this enlightening articles which shows inflation is still a big problem but fed does not think this way.
Hedge accordingly guys
Remember govt spending wont come down and govt can never default as they own the printing press.
DC
Agreed 1000%
It seems like everyone is confused about this economy. According to Bloomberg, we have GDP above all forecasts save one, inflation below all forecasts, consumer sentiment declining for five straight months, and the highest pessimism in the job market since 2021, with the leading story being a job market that’s more or less frozen like the housing market. There’s also a lot of concern about the default rates on auto loans, and how the incoming increases in health insurance premiums and the restart of student loan payments are going to affect all of that. Throw in a giant white swan called the “AI bubble,” and the sentiment surveys don’t look all that surprising.
One specific thing I’d like to know in regards to all this consumer spending, including on Black Friday etc, is which theory is correct: that people feel good and are splurging on all this stuff, or they feel bad and are pulling all of these purchases forward in anticipation of inflation, tariffs and a loss of job security – all of which would be more consistent with the surveys. Personally, the latter reason is why I’m buying anything that I am. Anyone else?
In a podcast yesterday, the chief economist at VantageScore (they do the credit score models) made some remarks about a third version of that theory: that he isn’t sure whether the increases in spending are due to people splurging or just due to the prices increasing. He also said that the spread in spending and default rates between the low and high ends of the income spectrum keeps widening, and he expects that people will have an even harder time of things going into next year, especially at the lower end, just based on trendlines alone.
I’m actually not that worried about AI bubble. Major players have lots of income streams. I wouldn’t compare the housing market to employment per se as housing prices will come down. My concern is entry level jobs and youth unemployment which will continue to get hammered by AI and other factors. That, and all the knock on affects are where I am worried. No reason to think the numbers in that area won’t get worse and accelerate.
“whether the increases in spending are due to people splurging or just due to the prices increasing.”
All the data here is adjusted for these price increases. The measure used to adjust overall GDP to inflation rose by 3.7% in Q3, as per today’s GDP report. Not adjusted for inflation, GDP rose by 8.1%.
Inflation needs watching but it ain’t at 9%.
Then: GDP adjusted for inflation is 3.7, and unadjusted is 8.1%
CPI YoY is reported at 2.7%.
The arithmetic (an oversimplification) would imply that inflation was more like 8.1-3.7=4.4%?
Can you smell what the BEA is cooking?
Sorry: I must self-administer a RDGDFComment:
The MEASURE USED to adjust the data ROSE by 3.7%.
IE: The YoY CPI= 3.7% (approximately)?!?
I had some other things slopping around in my head at the time.
I am aware of a spread between GDP and GDI that seems unusually wide.
I am lost in data soup: I had better just stick to the READ part.
1. CPI is only for prices on goods and services that CONSUMERS buy. But the overall economy (GDP) is much broader; so the GDP deflator of 3.7% covers everything in the economy. Consumer inflation was lower and inflation in non-consumer areas was higher.
2. GDP is not adjusted to CPI, which is released by the BLS, but to measures that the BEA releases, namely the various GDP deflators.
There is only confusion if you listen to those who want there to be and it is not just about the economy. Listen to the numbers.
Q3 numbers were strong and beat expectations
Inflation is easing, but still needs watching but it ain’t at 9%
Spending, wages, and jobs all moved higher largely benefiting US citizens
Housing is finally cooling improving AFFORDABILITY
Markets on track to finish year at record highs
Holiday spending looks epic; groundwork set for 2026 to ROAR
@DP Penn All of your comments have been biased in a particular direction. I’ll believe it when I see it. Most indicators seem to say that we’ve been roaring like we’re in the roaring 20’s.
@Matt B
Don’t get me wrong — all good things come to an end, but 2026 it won’t be- except for wild card politics (see bottom line).
High‑teens return projections for 2026 from the top banks: Deutsche Bank – Oppenheimer A/M- Morgan Stanley – Wells Fargo
Built on earnings, POTUS policy, and real investment.
Inflation is cooling, GDP is solid, and the Fed’s easing supports stocks. POTUS trade deals are bringing international companies to invest in the U.S., reshoring factories and boosting domestic capex.
AI spending — from chips to data centers — is driving productivity and margins.
With earnings broadening beyond tech and valuations supported, the S&P 500 has room to continue big gains next year.
But on deck — Democrat shutdown #2, trying to rattle policy, spook markets, and Yes sacrifice the needs of the people for political gain- AGAIN!
Net Exports of non-monetary gold (NMG) in Q3 had a significant impact on net trade and accounted for the majority of the reduction in the US trade deficit.
Given these Q3 GDP numbers are considered the revision, is it correct to assume that any impact of NMG for investment (non-industrial usage), which should be the vast majority of the net export, have been stripped out of the calcs?
No, imports and exports of nonmonetary gold have close to ZERO impact on GDP because most of it is removed from imports and exports for GDP calculations because it’s considered an investment (asset transfers) like investments in stocks, and not new production. That has always been the case.
This is exactly the issue that caused the Atlanta Fed GDPNow to blow up in Q1; those folks didn’t remove monetary gold in Q1, and it really screwed up GDPNow. And so they shut down that model, and started a new model for Q2 that removes monetary gold from imports and exports.
I covered all this here:
https://wolfstreet.com/2025/04/28/how-gold-imports-blew-up-the-atlanta-fed-gdpnow-the-old-model-is-dead-long-live-the-new-gdpnow-model-starting-apr-30/
Copper Hits $12,000 for First Time as Tariff Trade Upends Market…
Gold and Silver More Records…
Commerce Secretary Howard Lutnick had suggested changing the methods for GDP calculation. If it is not changed yet, we can be assured he is going over the data with a fine toothed comb to make sure we are correctly reporting the glass half full instead of half empty.
He wants to remove government expenditures and investments from the GDP calculation. But we already have a GDP calculation that excludes government spending, along with imports and exports, and inventory change: “Final sales to private domestic purchasers.” See the last chart in the article.
He will not be able to replace GDP with that; but they might add an additional GDP measure, with everything in it except government. So we’ll have three measures to look at here, instead of two.
Britain and all EU member countries add a generous handful of crushed ice to their GDP glasses.
The ice is kept under the counter, in a bucket marked ‘Proceeds of Illegal Drugs and Prostitution’.
The bucket was provided by the United Nations: System of National Accounts (SNA 2008).
Saks, the 101-year-old department store chain teeters on the brink of bankruptcy amid slumping sales
Luxury department store giant Saks — which owns Saks Fifth Avenue, Saks Off Fifth and Neiman Marcus — is edging closer to bankruptcy as it struggles under a mountain of debt.
Insiders have warned the company may have little choice but to seek Chapter 11 protection as a major debt payment deadline approaches, Bloomberg first reported.
Saks is facing more than $100 million in interest payments due by the end of this month, and insiders say executives are scrambling to find cash.
Options on the table include raising emergency financing, selling assets — or, as a last resort, filing for bankruptcy protection.
Founded in 1924, Saks built its reputation dressing Hollywood stars, society figures and well-heeled shoppers long before luxury brands sold directly to consumers online.
Its flagship on Fifth Avenue in New York became a tourist attraction in its own right, famous for its elaborate holiday windows and front-row access to the world’s biggest designers.
In recent years, Saks has struggled to adapt to a luxury market transformed by internet shopping and brand-owned stores.
The crisis marks a dramatic turn for a retailer that only last year pitched a bold comeback plan built around its $2.7billion takeover of rival Neiman Marcus.
I’m surprised Saks survived as long as it did. The list of retailers that filed for bankruptcy and were liquidated since 2016 is HUGE, and I captured a bunch of them in my series Brick-and-Mortar Meltdown, which I started in 2016 when ecommerce started killing those retailers. Add I’m going to finally get to add Saks to it when it kicks the bucket.
MW: Why Jerome Powell was right all along about interest rates, inflation and the economy
MSN: Donald Trump’s nemesis, Federal Reserve Chair Jerome Powell, has registered the highest approval rating among current political leaders, a new poll has revealed.
A Gallup survey shows that Powell—whom Trump has long berated while demanding interest-rate cuts—is more highly regarded by Americans than the president, members of Trump’s Cabinet, and leading Democratic figures.
The poll shows Powell’s approval rating at 44 percent, compared with Trump’s second-term low of 36 percent. The president’s current approval is only slightly above his all-time low of 34 percent, recorded in the wake of the Jan. 6 attack on the Capitol in 2021.
I’m going to hope the Fed is keeping their eye on the contributions to GDP from the AI shell game.
This is exactly why I’m deep into a crude oil ETF. $58 a barrel is too cheap when the US economy is running this hard AND the government is doing all it can to blow up inflation.
PM’s are at risky levels. Long term bond yields are trending up but not consistently enough to short. Natural gas is through the roof and the EV subsidies/regulations are being rolled back in North America and Europe.
Oil is the logical bet right now.
Nah. The economy doesn’t rely on oil the way it did historically. And with the drill baby drill attitude currently in fashion, pressure on prices may be downward.
We have an effectively infinite supply of the cleanest burning hydrocarbon in existence: methane (aka nat gas).
It’s a beautifly simple molecule: one carbon and four hydrogens. When properly combusted, the only byproducts are carbon dioxide and water. No carbon monoxide or other pollutants. CH4 + 2 O2 => CO2 + 2 H2O.
Such a clean fuel that we combust it in our homes with no ventilation needed.
It’s so safe that we have to install dedicated alarms (carbon monoxide) to tell us if the stove is going to kill us in our sleep. Gas stoves are also a significant source of indoor air pollution and an explosion risk if there’s a leak. Using a gas stove without ventilation is really not recommended.
Methane releases less carbon than coal or natural gas, but methane itself is also a potent greenhouse gas, with a global warming potential 80 times greater than CO2 over the most relevant timescales (a few decades), and the industry has major issues with unaddressed methane leaks. There’s a reason why they’re trying to phase out gas.
There’s a good chance that the electricity you heat your home with was generated from a combined cycle natural gas plant.
A malfunctioning gas furnace can produce CO, sure, but your spaceheater could start a fire and burn your whole house down. All home heating has risks.
Ironically, my pellet stove will produce CO during normal operation – but because wood pellets come from trees I get to call it “sustainable” despite the toxic exhaust gases.
I run a propane heater in my (enclosed) garage when working on my car in the winter – but if I need to turn the car on, I always crack the bay door. Not all combustion is the same.
Combined-cycle nat gas plants are pretty efficient and also give you the option of eventually switching out that energy source for renewables once you can, unlike millions of individual gas stoves etc. There has been a push to use gas as a “bridge fuel” and continue building these plants while we do that, but given the cost and lifecycle of those plants, you risk creating some pretty big stranded assets if renewables + batteries end up overtaking you.
CO emissions aren’t really related to sustainability, but CO2 emissions are, since they accumulate in the atmosphere. Technically, burning wood pellets is better than burning fossil fuels like gas from that perspective, but wood stoves are only like 20% efficient and cause local air pollution, so there are some downsides.
I would also open the garage door if you’re running propane since those do put off CO as well, which is why you’ll see the warning labels about using them indoors. An electric heater in the garage doesn’t have the same issue. Most space heaters now also have a feature that shuts them off if they’re tipped over, to mitigate that problem.
“you risk creating some pretty big stranded assets if renewables + batteries end up overtaking you.”
I have solar panels on my roof. I spent a lot of money on them (not leased, I bought the system outright).
Ironically (in the context of your point), my usage and generation is fairly well load-matched precisely because I don’t use electric heat. Load-matching with solar is important to maximize the benefit of this energy source, and it wouldn’t make nearly as much sense w/ electric heat.
In the summer my usage is highest due to AC use, and it’s lowest in the winter because I heat with natural gas & wood pellets. Generation is also highest in the spring & early summer, and lowest in the winter (especially after it snows). Often takes me a few days to get up on the roof and shovel out the panels due to my busy schedule.
Think about how profoundly inefficient electric heat is: you’re burning hydrocarbons to create heat, then using that heat to generate electricity, then sending that electricity across miles of copper wire and thru various voltage transformers, then turning it back into heat. You could have skipped the last three steps and just used the heat created directly from combustion. Extra steps = wasted energy.
I’ll give a pass to heat pumps which are a good solution in places where it doesn’t really get cold. But here in New England it does – currently 8 degrees out, and the next time it gets above freezing is 2 days from now. Currently running both the gas furnace and pellet stove to keep the house at ~64 degrees.
Cracking the bay door when I run the propane heater would be a great idea if I wanted to let all the heat out and waste all that fuel, but that’s not my goal.
Environmentalism to me is about making small but practical changes in one’s lifestyle. Put on a sweater instead of turning up the heat. Fix your current car instead of buying a new one. IMO, burning a little extra propane to keep my car out of the scrapyard and on the road is a net positive for the environment.
NB: traditional wood stoves and modern pellet stoves are different. My pellet stove turns a 40 lb bag of pellets into an ounce of ash. I’d say that’s a little higher than 20% efficiency.
USO? Others are similar. But USO has a long history. So go look at the max chart that takes you to 2006. At the peak in 2008, USO traded at close to $1,000. Today it’s at $70. While WTI went from $150 to $58 over the same period. If you treat this as a buy-and-hold vehicle, it will eat itself up in your portfolio. It’s a short-term trading vehicle only. Obviously, nothing is further from financial advice than what I just said.
OILK actually. It has certain benefits compared to USO.
Regarding the various naysayers,
1) What do any of these points have to do with how 90% of people in the world obtain energy for the millions of new cars they buy every year?
2) Why is nobody talking about the trend of environmental deregulation sweeping the U.S. and Europe, or the boom in car ownership in China and India?
3) Fossil fuels are not fungible with each other. At least that’s according to my car’s owners manual and the safety warning on my furnace.
“$58 a barrel is too cheap”
At $4.41/mmBTU, natural gas is trading like oil is $26/bbl. Watch out for that arbitrage. Hydrocarbons are fungible.
Fungible? I’m not following. I can neither burn natural gas in my car nor gasoline in my water heater. Maybe after spending money on conversions, sure, but as a practical matter, no.
What’s the link I’m missing?
In either case you’re burning hydrocarbons to create heat. It’s just different hydrocarbons, but the principles of combustion are the same.
Gasoline does make sense for vehicles because when atomized, it will reliably combust under a wide range of atmospheric conditions (hot/cold, dry/humid etc.). Natural gas makes sense for fixed applications such as home appliances.
That said plenty of cities run CNG (compressed nat gas) buses. My emergency backup generator is capable of running off gasoline, propane, or natural gas. I’ve never run it off gasoline because the ethanol will cause carbon deposits in the carb, but I don’t have to worry about this when using propane or nat gas.
“Maybe after spending money on conversions”
When the price difference between the two fuels becomes big enough, spending the money to switch the engines will make sense. That’s the arbitrage.
NB: natural gas spot prices are frequently below $0 in the permian.
Merry Christmas, everyone!
What can we look forward to in 2026?
New debt ceiling reached in November?
New Fed chair.
Supreme Court ruling on tariffs.
Will Navidia (up 40%) and Alphabet (up 60%) keep climbing.
Will Gold climb 70% like 2025
Will bitcoin bounce back?
Will unemployment hit 5%?
Will we get a $2000 dollar tariff dividend check?
Will inflation cool, rise or stagnate?
Will there be war with Venezuela or peace with Ukraine, Russia?
That’s a good list of events to keep an eye on in 2026. I am going to print it. Thanks!
Major burger chain Jack In The Box shuts 72 restaurants with more to come by year end amid beef inflation struggles
The closings come after years of mounting problems for the burger chain, with executives admitting that a major issue is its prices.
America’s sixth-largest burger chain is closing stores as soaring beef costs and customers frustrated with its prices take their toll.
Jack In The Box, the 74-year-old hamburger joint with 2,168 restaurants mostly in California, Arizona and Texas, previously warned investors it would shutter between 80 and 120 restaurants by the end of the year as it tried to stop some serious financial bleeding.
In April, CEO Lance Tucker rolled out the company’s so-called ‘Jack on Track’ turnaround plan, which called for closing 150 to 200 underperforming stores between April 2025 and mid-2026.
10:36 AM 12/24/2025
S&P 500 closes at fresh record high in holiday-shortened session
Dow 48,731.16 +288.75 0.60%
S&P 500 6,932.05 +22.26 0.32%
Nasdaq 23,613.31 +51.46 0.22%
VIX 13.47 -0.53 -3.79%
Gold 4,507.50 +1.80 0.04%
Oil 58.35 -0.03 -0.05%
Meanwhile, two refineries are giving California the middle finger and leaving – Phillips 66 refinery in Los Angeles and a Valero refinery in Venicia. Valero cited ‘ high operating costs and strict state environmental regulations’. The two refineries together are 17% of California’s refining capacity.
These refineries are ancient and should have been shut down long ago. EVs and fuel efficient hybrids have caused demand for gasoline to plunge. Refineries in CA stay alive by exporting gasoline, jet fuel, and diesel to Latin America.
“Watch out” indeed Wolf. The second wave of inflation has come ashore already…
If this is anything like the 70’s there will be three waves of inflation.
Hedge accordingly.
If real gdp growth is affected by the calculation of inflation, which understated due to a lack of data, doesn’t that mean that real gdp is overstated?
Sheeeesh. No.
1. This is GDP for Q3 which ended on Sep 30, before the data collection problems during the shutdown.
2. GDP is deflated not by CPI (released by the BLS) but GDP deflators (released by the BEA). The GDP deflator for Q3 was 3.7%.
GDP – Not a real great tool IMHO-
Personally, I think GDP is overused as a political scoreboard.
When it’s bad, it’s treated like a national scandal; when it’s good, it’s shrugged off with a ‘meh, that’s just what it’s supposed to do,’ or ‘better than we thought.’
GDP only measures output—it doesn’t tell you if people are actually better off.
In a service-driven economy, GDP can show growth even when wages stagnate, costs rise, or consumer sentiment drops.
During a war or other crisis, GDP can surge while life for most people still sucks.
It doesn’t show rising inequality, unsustainable debt, or declining quality of life.
GDP tells you what was produced, not how resilient the economy really is or how policy decisions are playing out on Main Street.
GDP is still a headline metric and useful for long-term policy assessment, but:
It is increasingly less relevant as a market signal.
For investors and analysts, earnings, margins, cash flow, and real-time indicators matter more than the quarterly GDP print.
In the modern economy, GDP is a lagging, imprecise proxy rather than a definitive measure of economic health or market direction.
I think you had few single-malts too many. I’ll address just a few of your points:
1. GDP measures spending and investment. That’s its purpose. And that’s what it does.
2. If wages stagnate, then consumer spending stagnates, and GDP shows that. Consumer spending is 69% of GDP. Stagnating wages hit GDP very hard.
3. GDP doesn’t and shouldn’t measure squishy things like how you feel (consumer sentiment) or “quality of life” (who are you to tell me what my quality of life is?)
4. “GDP tells you what was produced” Not quite. GDP tells you what was spent and invested. When you build a factory, that’s an investment that goes into GDP. When you buy an import, that’s spending that goes into GDP, but since it’s imported, the import value is deducted from GDP.
5. “how policy decisions are playing out on Main Street.” Good grief. Your Main Street is not my Main Steet.
6. “GDP is still a headline metric…” that’s uninformed BS. GDP is the largest data trove that the US government releases. It comes with a huge amount of detail on all kinds of things, from inflation factors to details what consumers bought. Look at the National Accounts at the BEA’s website. You will drown in data.
I break GDP into its big categories, each with a chart. But in each category, there are a gazillion subcategories.
7. “It is increasingly less relevant as a market signal.” It was never intended to be a market signal. It’s macroeconomic data designed to show how the overall US economy is doing. Nothing to do with the markets. If you’re not interested in macroeconomic analysis, you’re on the wrong website.
8. “GDP is a lagging, imprecise proxy rather than a definitive measure of economic health or market direction” GDP is the most accurate depiction of the US economy there is; it may not be as accurate as we’d like, but it’s the most accurate depiction there is. It’s idiotic to assume that GDP shows “market direction,” or to blame GDP for not showing it.
9. If you want to look at hour-by-hour and day-by-day market signals, watch the videos below the article. I post a new one almost every business day. They’re by TechnicalTaders, and they discuss moves and signals by the markets.
10. “For investors and analysts, earnings, margins, cash flow, and real-time indicators matter more …”
— GDP IS “cash flow.” That’s what GDP measures and how it measures. Corporate accounting is “accrual accounting” under GAAP, and so to give investors a better idea pf what is actually going on, companies also publish “cash flow” statements. The government publishes only cash flow statements. It doesn’t do accrual accounting.
— “real time indicators”…LOL, companies publish earnings reports, cash flow statements, etc., quarterly, just like the government. Companies don’t publish “real-time indicators” of anything. You have to wait till the quarterly earnings reports are released.
11. The big weakness that GDP does have is that rising government debt, used to fund investment and spending, increases GDP. But you can take government spending out of it, and the GDP data trove has a measure for that, “Final Sales to Domestic Private Purchasers,” see my last chart. Just because you don’t look at it doesn’t mean GDP doesn’t have it.
Wolf –
Thanks for the detailed breakdown—
Just coffee over here for me but I question some others here.
OK, YES:
– Imports get subtracted. That makes sense, solid point.
– The BEA release is loaded with subcategories and depth.
– Final Sales to Domestic Private Purchasers is a smart way to strip out government and inventory swings.
Still, on the main issue: GDP is great at tracking total output, spending, and income, but it’s not the full picture of economic health or how regular people are actually doing—it skips distribution, sustainability, real living standards, and AFFORDABILITY (that new buzzword to cover all things).
A few continued concerns:
2. Consumer spending around 69%. Stagnant wages should slam it, but—people tap savings, rack up debt, or get COVID checks. We’ve had years of flat real wages with spending and GDP still chugging along, while most households feel pinched.
3. My exact point: GDP skips the “squishy” stuff like sentiment, inequality, and quality of life. That’s why it’s limited as the go-to scoreboard (ask the Biden campaign).
7/8. I never said it was designed as a market signal—just that in today’s world of fast data, the quarterly (and often revised) GDP number is more backward-looking than timely (add a historic government shutdown and things get worse). It’s generally seen as a coincident indicator, not a leading one. Markets usually react harder to earnings surprises, nowcasts, or PMI flashes.
10. GDP includes plenty of non-cash items, so it’s not pure cash flow. And yeah, companies report quarterly too, but we get quicker reads from weekly claims, credit-card trends, etc.
11. Needing tweaks like Final Sales actually proves the point: headline GDP can get pumped by debt-fueled government outlays (or war spending) without making private life better or the economy tougher.
Bottom line: GDP is essential for big-picture macro, but treating it as the definitive proof of prosperity ignores huge gaps of other more meaningful, on-time data.
There’s this explanation for the shift into liquid deposits.
“Dominik Supera’s research indicates that lower nominal rates reduce the spread on liquid deposits, leading households to substitute away from illiquid time deposits. This substitution is driven by the lower interest rates, which make liquid deposits more attractive compared to the higher risk and lower return of illiquid time deposits. Supera’s findings are supported by empirical evidence and a general equilibrium model that captures the relationships between nominal rates, deposit spreads, and household behavior.”
One must always check One’s assumptions.
Is the Fed really trying to fight inflation?
Show an untitled chart of the PCE to a person and ask
Does this look like a chart being promoted to go UP or Down or steady?
The explicitly stated goal is some inflation. “Price stability,” in the Fed’s terms means moderate inflation. That figure has been pegged at 2% for years because that’s low enough to not interfere with decision making by households and companies and high enough to give the economy some room. It’s sort of a compromise figure. The Fed has stated this endlessly; it’s not a secret. The Fed isn’t going to throw 10 million people out of work just to get inflation from 3% to 2%. It’s not worth it. If you’re a working-stiff, you appreciate that. If you’re a retiree living off fixed income, you want deflation, and if unemployment is 15%, you don’t care because it’s just other people’s jobs.
If inflation is high, such as 12% or 15% or heading higher, the Fed will throw 10 million people out of work to stop it. And it did that in the early 1980s. And it was brutal for businesses and workers. But inflation is 3% now.
“But inflation is 3% now”
and it seems as if it is being accepted. Cutting.
The 2% (acceptable) inflation trend line from 2021 to now is well below where we are currently. Thus, by the Fed’s own metrics, we are at “unacceptable” price levels. Yet there is no attempt to get down to the “acceptable” trend line. Spiking inflation, which we experienced, should warrant a controlled disinflation….IF the “target” is really a “target”. IMO
What I don’t understand from this report and conclusion is this:
“The last CPI inflation report was marred by missing data due to the government shutdown and gave misleading inflation figures. This is not an economy that needs a rescue through rate cuts. This is an economy that is a feeding ground for inflation.”
Inflation was grossly marred (understated). That being the case, why isn’t it noted that “real GDP” was not real. It’s a phantom because it still includes way to much that is just a measure of the impact of inflation and not of an actual change in production. It seems to me, “real” GDP would be significantly lower if real inflation were taken out of it, which mean the economy was not really such a whoosh after all.
No, on two levels, at least:
1. This was Q3 GDP (through September). The data problems with CPI came after that (Oct & Nov).
2. Real GDP is NOT adjusted to CPI. It’s adjusted to the “GDP deflator,” which was 3.7% for Q3 GDP.
Fair enough on the timing, but as for the GDP deflator, does it not derive from the same government data that was so flawed in collection. So, whether it is CPI or PCE or some other derivative of all the data gathering that did not happen as well as the governments ludicrous claims about Owner Equivalent Rent, the deflator, as I see it is as screwed up as the rest of government inflation data.
Still, fair point on timing issue for Q3, except that I believe the government data was getting less reliable even back in Q3 due to the DOGE firings. It just becomes more abundantly when the shutdowns are dumped on top of the DOGE chaos.
OER was running hot before the data issues, and pushed up inflation. That’s why lots of economists complained about OER before October. It didn’t push down inflation until the recent months.
The GDP deflator was +3.7% in Q3, the worst since 2022, much hotter than CPI (3.0% at the end of Q3) because housing inflation and consumer price inflation overall play a much smaller role, since it also includes inflation for non-consumer economic entities, such as businesses and governments.