All of it to fund the ballooning debt that hit $38.4 Trillion.
By Wolf Richter for WOLF STREET.
This week, even during the relatively quiet pre-holiday period, the government sold $602 billion in Treasury securities spread over 9 auctions on four days (there are no Treasury auctions on Fridays), including 10-year Treasury notes and 30-year Treasury bonds.
Of these auction sales, $483 billion were Treasury bills with maturities from 4 weeks to 26 weeks.
The auction yields are in the right column. The rate cuts have pushed down the yields of T-bills, and of the 3-year Treasury notes, but have done nothing for the yields of the 10-year Treasury notes and the 30-year Treasury bonds:
| Type | Auction date | Billion $ | Auction yield |
| Bills 6-week | Dec-09 | 78.2 | 3.650% |
| Bills 13-week | Dec-08 | 89.7 | 3.650% |
| Bills 17-week | Dec-10 | 69.2 | 3.610% |
| Bills 26-week | Dec-08 | 80.3 | 3.580% |
| Bills 4-week | Dec-11 | 85.3 | 3.610% |
| Bills 8-week | Dec-11 | 80.3 | 3.614% |
| Bills | 483.0 |
And $119 billion of the auction sales this week were notes and bonds.
| Notes & Bonds | Auction date | Billion $ | Auction yield |
| Notes 3-year | Dec-08 | 58.0 | 3.614% |
| Notes 10-year | Dec-09 | 39.0 | 4.175% |
| Bonds 30-year | Dec-11 | 22.0 | 4.773% |
| Notes & bonds | 119.0 | ||
| Total auction sales | 602.0 | ||
The $39 billion of 10-year Treasury notes were sold at the auction on Tuesday at a yield of 4.175%.
They replaced the $21 billion of 10-year notes that were issued on December 15, 2015 at a yield of 2.23% and that matured in November. So nearly double the debt, at nearly double the interest rate. US government finances are not for the faint of heart.
By early Wednesday, in the secondary market, the 10-year Treasury yield had gone over 4.21%. Then came the FOMC meeting, the rate cut, the T-bill purchases, and Powell, and the yield dropped 10 basis points but bottomed out at 4.10% by early Thursday. Then it bounced off and rose, and at the moment, Friday morning, was back to 4.20% (hourly chart via Investing.com).
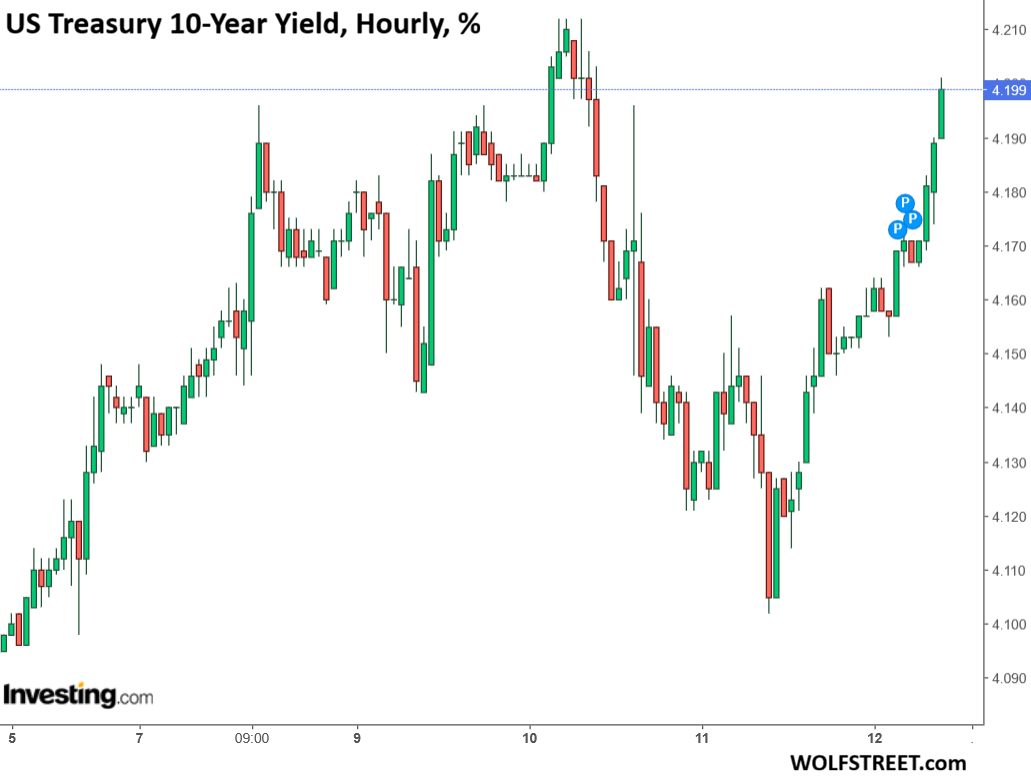
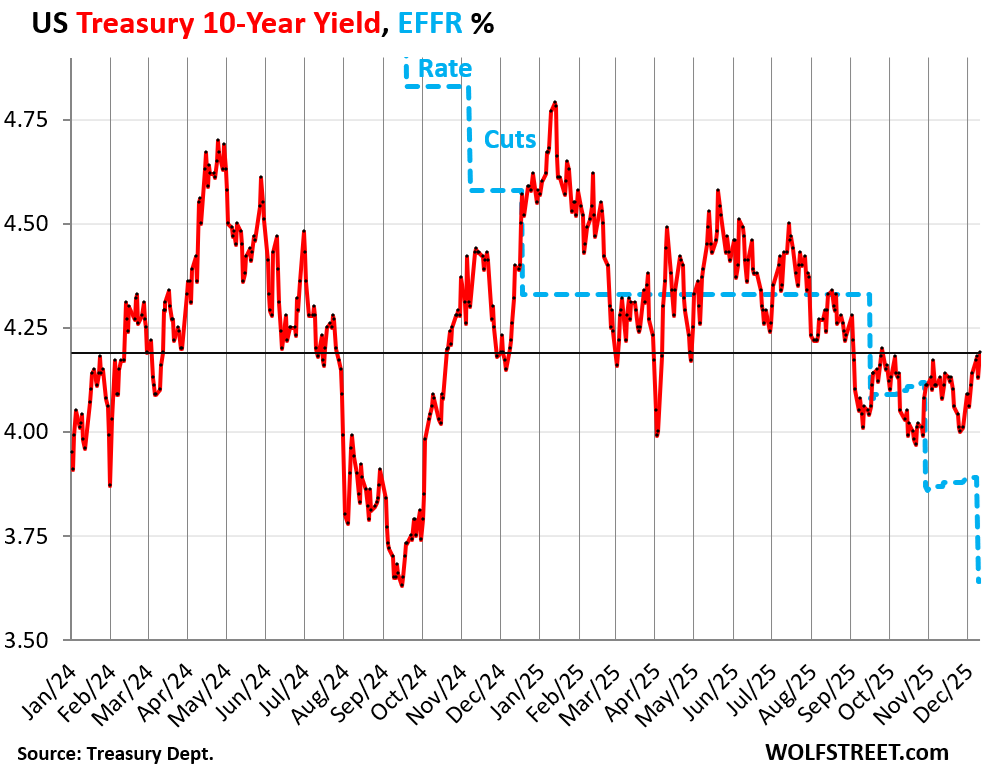
So around the 25-basis-point rate cut announcement by the Fed, the 10-year Treasury yield fell in the secondary market but then rose again on Thursday, and by Friday morning, the 10-year Treasury yield was 54 basis points higher than the Effective Federal Funds Rate (EFFR, blue in the chart), which the Fed targets with its policy rates.
The daily chart below doesn’t show all the hourly drama of the 10-year yield around the FOMC meeting.
In normal credit markets, long-term yields, such as the 10-year Treasury yield, are quite a bit higher than short-term yields, such as the EFFR, and are not driven by the Fed’s short-term rates.
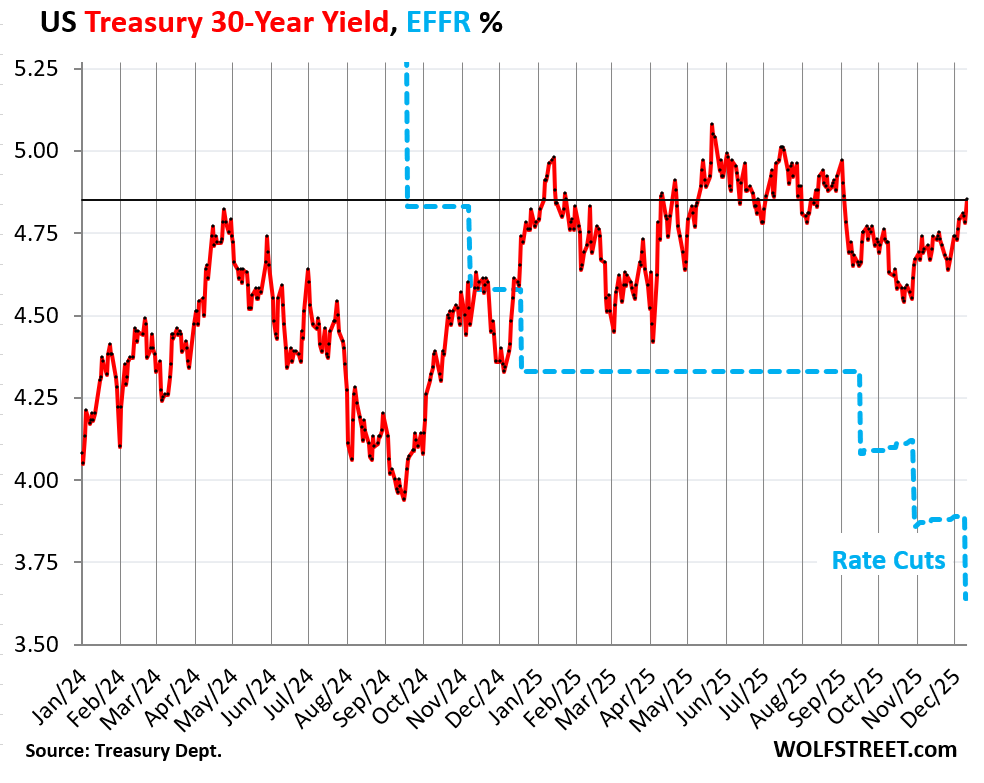
The $22 billion of 30-year Treasury bonds were sold at a yield of 4.773% at the auction on Thursday.
By Thursday evening, in the secondary market, the 30-year Treasury yield was back at 4.80%, and by this morning it rose to 4.86%, the highest since September 4. It’s almost funny how the 30-year yield blows off the Fed’s rate cuts. It’s all about inflation fears and supply fears:
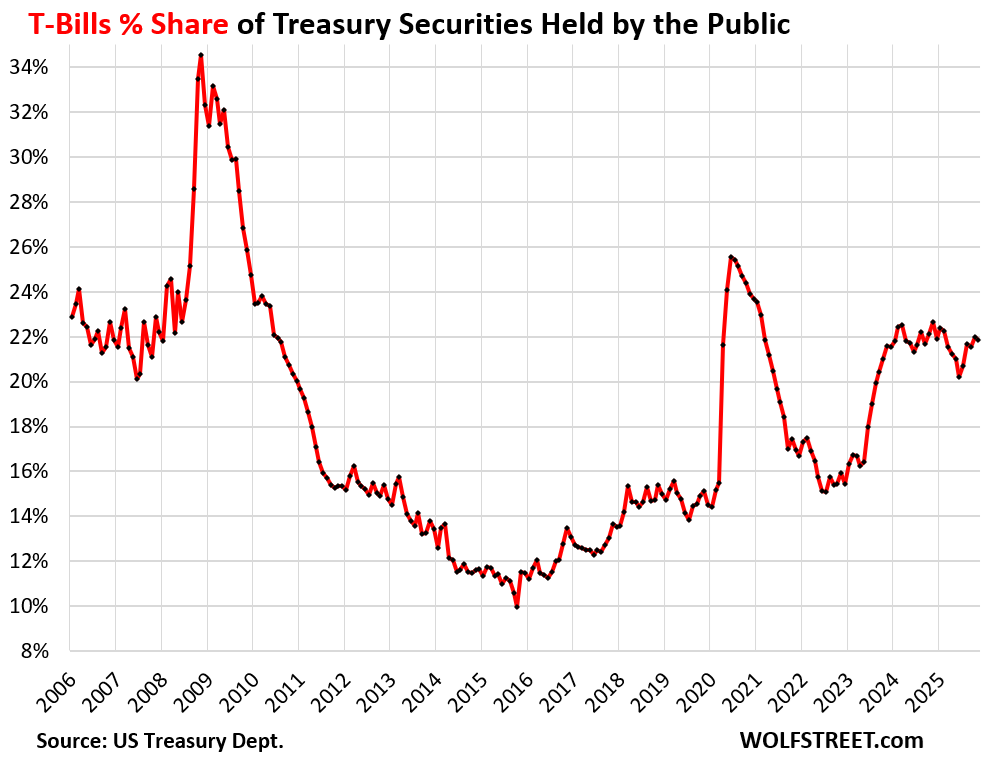
T-bills outstanding hit a record $6.7 trillion at the end of November, up by 18.6% from a year ago.
The Treasury Department is beginning to shift more issuance to T-bills, and the Fed is starting to buy them in the secondary market to replace the MBS that are coming off its balance sheet, and as part of its Reserve Management Purchases.
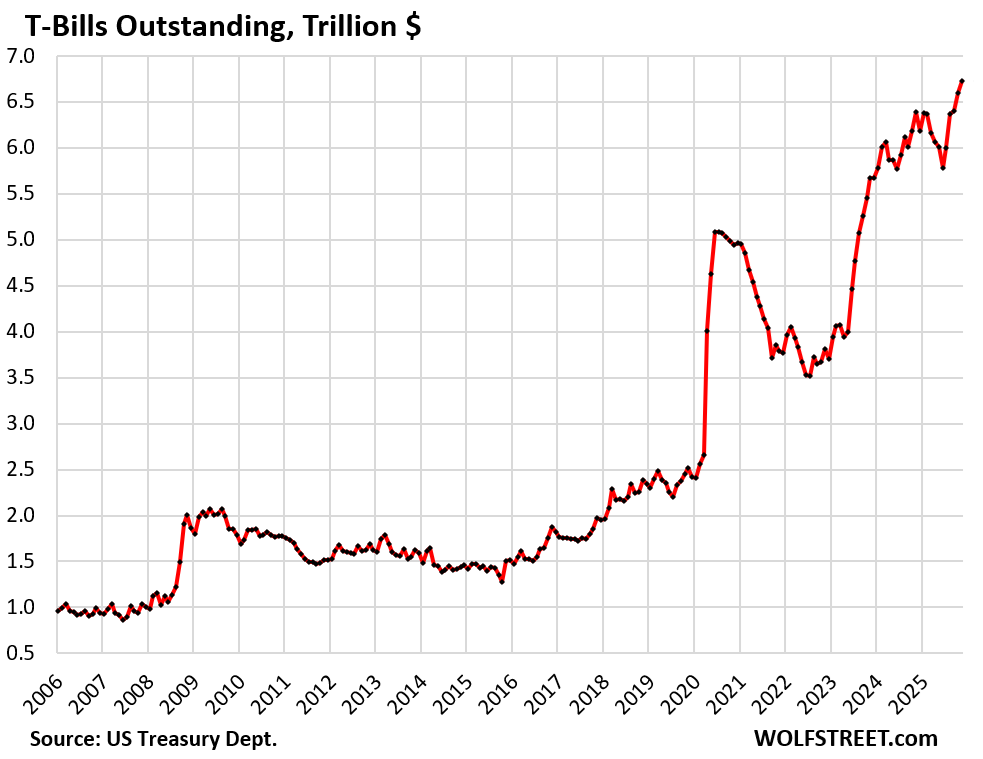
But the total amount of “Treasury securities held by the public” – not including those held by government entities, such as government pension funds and the Social Security Trust Fund – also ballooned to a new record of $30.8 trillion at the end of November, on substantial new issuance, and month-to-month, the share of T-bills actually dipped a hair to a share of 21.8% of all Treasuries held by the public.
During past crisis events, the government issued huge amounts of T-bills quickly which caused T-bills’ share of the total debt held by the public to spike for short periods, such as to a 34.4% share in November 2008 during the Financial Crisis, or to a 25.5% share in June 2020. During panic times, there’s lots of demand for T-bills. Then over time, the government replaced maturing T-bills with notes and bonds, helped by the Fed’s massive QE operations at the time, and the share of T-bills declined again.
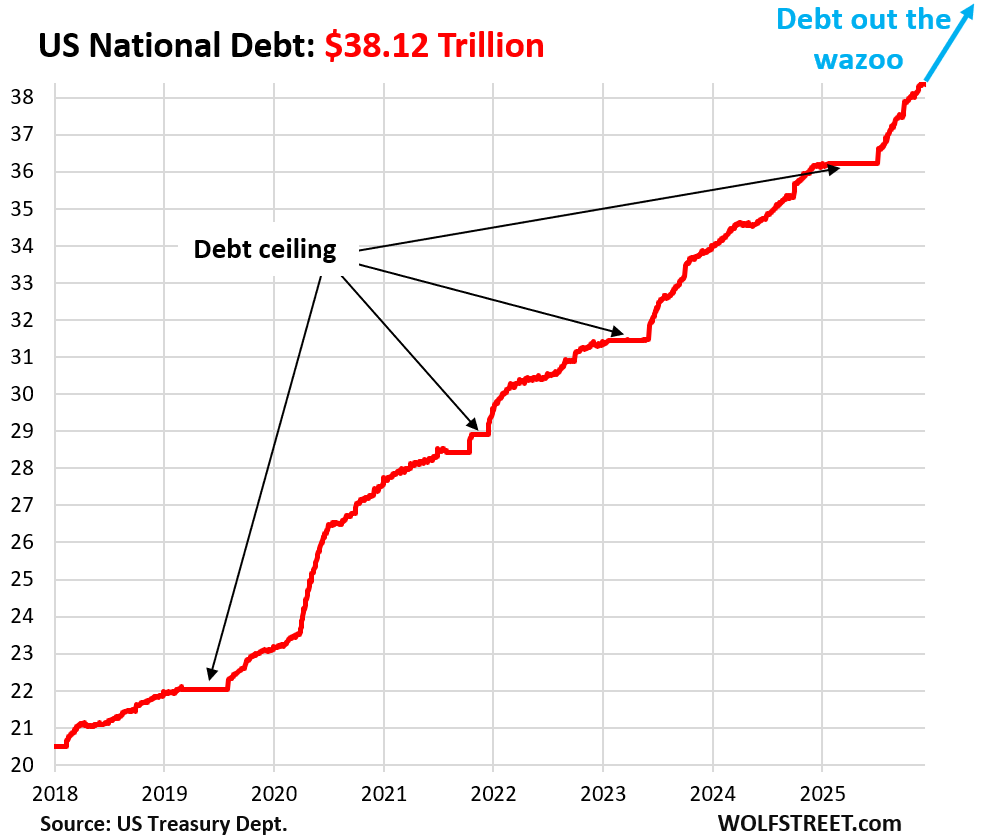
The Treasury debt that drives all this and that has to be funded and refunded through these auctions hit $38.35 trillion as of December 10, up by $2.2 trillion from a year ago.
This is the total debt, in all its glory, consisting of $30.79 trillion of Treasury securities held by the public and $7.56 trillion of Treasury securities held internally.
The portion of the issuance that replaces maturing debt does not add to the debt. But the additional issuance to fund the new deficits adds to the amount of the debt.
Enjoy reading WOLF STREET and want to support it? You can donate. I appreciate it immensely. Click on the mug to find out how:

![]()
Let’s go 10y to 6%+ and 30y even higher.
Would you even buy then though? That’s true death cycle territory and the US would be unable (they ain’t hiking taxes or cutting benefits in near the magnitude needed) to service the new debt without a funcational default: fiscal dominance.
It’s a spending vs revenue problem that needs to be fixed ASAP. The American people need to wake up.
During this time of fiscal and monetary folly, long bond investors could suffer like equity investors during the early 1930’s. There was a huge price drop, followed by a few years of stabilization. Just when you thought things had corrected enough, another devastating drop happened.
Given the uncertain inflation outlook, long bonds are a risky investment now.
The bond market will roll over before the equity market.
Fund managers who were loading up on 10-year treasuries yielding 0.5% will call them “uninvestible” when they crash to 6% yield. It’s the same people who are now buying Trillion-dollar stocks with P/E over 50. They compete with CEOs doing buybacks. Same CEOs will issue new stock when P/E hits 5. Nothing new under the sun, least of all in the stock market.
That is an absurd supposition that the 10 year is heading for 6 in the face of the monumental struggle that it apparently won with it’s recent increase from 4.05 to 4.1 gives me pause about what would the AI opinion be, to the straight forward, obvious question:
Who is God.
Obviously, the various AI “agents” will describe an improbable, historical world that has never existed from different points of view.
The Good Old Desk.
The portion of the issuance that replaces maturing debt does not add to the total debt, but might they need to replace an increasing portion of the shorter term maturing debt with long term debt, leading to higher interest expense, which would?
They’ll eat seed corn, then they’ll change the rules. Crisis averted.
They’ve already changed the rules.
250K FIDC limit?
Not in the Silicon Valley Bank incident.
HA. That’s one bank, albeit with higher average balances per account. Imagine 50 banks.
My question is: does the $38.35TR include debt of states/cities, etc.? It seems to me that when European countries report their debt to Eurostat, the total national debt includes federal, regional and local public entities. How is that in the US?
It does not. The states and local governments have another $5-6 trillion, collectively, if I remember correctly.
Theoretically, I would think additional state and local debt could cause the federal debt to increase as well, as if the states and local governments issue tax-free municipal bonds, investors in those wouldn’t pay federal taxes on the interest income. But I suspect the relationship is fairly tenuous.
“Treasury debt” = “National debt” = “Treasury securities outstanding” = Treasury debt”
State and local government debt in the US is about $6 trillion all combined.
So if EU countries report a debt/GDP ratio to Eurostat where the debt includes regional and local debt, that ratio is not comparable to the ratio which the US reports (because it does not include regional/local debt). The deficit/GDP ratio within the EU (Maastricht = 3%) consolidates the federal budgets with the regional/local budgets. Also not comparable with the US.
Eurostat reports sovereign debt to GDP ratios, by country, which does NOT include regional and local debt.
https://ec.europa.eu/eurostat/web/products-euro-indicators/w/2-21072025-ap
ChatGPT informs that the Eurostat definition of “general gross government debt” includes Central Government, State or Regional Governments, Local Governments and Social Security Funds. Since this is in some countries kind of an important issue (e.g. France), I have put the question directly to Eurostat. We’ll see if they answer.
Isn’t ChatGPT just a regurgitation of several websites?
Convenient but not particularly smart
Sorry, I have to confess: 4,20 10 year sounds good to me…just saying😅
Same 👍
Yields go up, I buy bonds. Always works out well.
Buy bonds when the yield is low just makes less sense 🤷♂️ That’s when you sell.
Crazy how the media always suggests the opposite 🤔 yields low, safe. Yields high, boo bonds are getting crushed
Klaus Kastner, no the Federal supposed “debt” is basically a savings account for private enterprise, and the interest paid upon renewal is in the sovereign dollar, produced by the full trust in the U.S. Federal Government. Europe’s currency, again interest payment is the Euro, which is not the sovereign currency of any of the Countries, but of the European Union. Hope that helps.
…. Legal action of the currency in the U.S. is under the jurisdiction of the U.S. Congress, and the Federal Reserve Bank. Each in It’s own can be dictated by the popular vote of only citizens of the U.S.. in essence. Individual Countries in the European Union do not have that, they can be the minority vote on the value/use of the Euro. I personally think England’s goal toeave the E.U. is a good thing for them. The E.U. monetary system hasn’t helped Greece in substance for their citizens.
From a different perspective about your comment that “It seems to me that when European countries report their debt to Eurostat”.
The European debt is likely at some point to not be worth the paper it’s printed on. Just like the American script being printed in record quantity to pay for the ubiquitous tax cuts for the wealthy.
Morally, indefensible. Hedonistically , attractive
The Fed continues to attempt water to run uphill.
More supply, in a free market, would depress prices.
The conclusions are obvious.
4.2 should be the pivotal point for trading ten yrs….and likely the Fed will find a way to protect those who took down the auctions…for a while.
Tremendous article in mises.org regarding the societal and generational impact of pumping assets. In an inflationary environment labor trades at a discount compared to assets and durable goods. Services are beginning to catch up, but can they continue?
Looks like I will be exiting the treasury market. It used to be a better deal considering no need to pay the 9.3% CA state tax but now my savings account even with that pays more. Might as well have that money fully liquid if not making additional money on locking it up. Hopefully long term goes up but my sense is just way too much money and people will purchase even if not much more than inflation and nice to have sideline money to put back in market whenever downturn eventually shows up. Definitely a challenge right now as I start getting ready for retirement in a few years.
I mean…do you really think your savings account interest rate isn’t going down as a result of this???
When the fed was raising rates, I would get a crowing email from my bank that they raised my account rate (weeks if not months after the fed raise!).
Now that rates are falling, my bank lowers my account rate within a week or two, and sends no email.
It’s pretty funny!
The high yield savings account I use emailed me about the rate lowering by 5bps.
By the time I got on to look, the account rate was 5bps lower than that….
It’s still 140bps higher than my regular savings account though.
Meanwhile, the poor slobs who retired and put their life savings into long term bonds paying ZIRP.
When the interest rose the poor slobs lost more than 50 pct of their life time savings. I was considered a heretic for opposing QE in the first place.
When it was all the rage of an incompetent rube, Paul Ryan, got codified into law, the genesis of the corruption that has lead to our malfunction.
Evan,
It did but only down to 4% from 4.20%. of course they will follow but it is the degree that matters and short term bills just not work it now.
So we are being forced to put this money into the gambling casino stock market, housing which is depreciating and includes the vampire of taxes and insurance, or gold/silver/etc. Great time to try and invest so you can retire and if you missed the train in 2019 well your out of luck.
Where is the money (Cash) that financed $38.35T national debt?
It is instantaneously recycled back into the economy by government spending, paying contractors to pave roads, paying government employee salaries, paying for heat and lights in government buildings etc.
Little known fact is that Treasurys are liabilities of the government BUT ASSETS OF THE HOLDERS. Every Treasury issued increases the net wealth of the private sector.
In Somalia ? 👊😀
Wow, we’re up $2T since the debt ceiling, great work to all our leaders in DC! Phenomenal growth, very inspiring to us all.
If our budget deficit remains in the $2T neighborhood, it’s foregone conclusion that the debt will rise by this amount annually. It can only fall if tax receipts go up, or deficit spending decreases.
Here is how Congress will solve this. They will agree to decrease the ‘rate’ of deficit spending increases, and they will call it ‘$2 Trillion Deficit Savings Act’. Hope this clarifies things.
Then the debt will rise by 3 trillion. I mean what’s another trillion.
Just a reminder…
One billion seconds is 32 years
One TRILLION seconds is 320 centuries
so the .1 and .2 etc added onto the Trillion number is actually 100 Billion or 200 Billion.
Its the small integer game. Sounds harmless when they add on the decimals.
Let’s just call it what it is – stimulus
Seems the world is happy enough getting a trillion dollars in interest payments from the American tax payers.
Most of those interest payments go to American taxpayers, many of them read this site, and some of them comment here. Maybe 24% goes to foreign entities, but that includes US entities set up in foreign countries, such as US hedge funds involved in the basis trade holding their Treasuries in the Cayman Islands, and corporate America holding its Treasuries in Ireland.
Trump keeps pushing the Fed for lower rates. He must realize by now that lowering Fed Funds rates in the face of decent jobs numbers and 3% or higher inflation tends to increase long term rates because of inflation fears. Maybe Trump wants higher mortgage rates. Or he is just plain stupid. Note, I agree with most of Trump’s policies, but he is nuts when it comes to the Fed Funds rate, unless he wants higher long term rates. A further note, I see food prices are skyrocketing again.
But prices of avocados and eggs have collapsed since spring, LOL
People tell me they’re down 400%-500%. That’s what I’ve heard, people are saying it. Biggest drop inflation ever, THE BIGGEST!.
LOL if they plunge 100%, prices are at zero. If they plunge 500%, you might get paid $30 to take an avocado.
But it is nice to buy a dozen eggs with a 2-handle, instead of an 8-handle, and big Haas avos for less than a buck a piece, instead of over $2 each.
like when oil went negative during panic of the recent unpleasantness of the covid plague.
Eggs and avocados provide needed protein and good fats so we don’t need to buy expensive beef! LOL!
Avocados are typically $2.00 each at grocery stores in LA. Back when we had a 15 acre avocado ranch in Fallbrook in the 1980s they could only be sold to CALAVO for a price of 2 cents per pound for the seller. Fortunately we don’t need to buy them now as we have a great Hass tree and they were large and wonderful this year.
If you’re paying $2 ea, you’re getting ripped off.
No tariffs on avocados.
The prices I mentioned are for California grown avos. I have no idea why people buy produce from Mexico when they could buy US-grown produce.
Sorry but Thurd2 is correct. Avocados and eggs are one of the only things to come down and I have people IN the grocery industry and prices, ARE going to go higher. Most people DON’T pay attention until they have to.
Sure, a lot of food prices are rising. They almost always do, and did. But not ALL food prices are rising. Chicken hasn’t risen, other prices dropped. Some fruit prices haven’t risen, etc. Manufactured food has gone up a lot. Coffee and beef prices have been soaring for four years, and I posted a hole article about those.
“Maybe Trump wants higher mortgage rates.”
Maybe the goal is to cap or reduce prices by preventing rates from falling. Or maybe the issue is low on his priority list. Or maybe he wants lower overall financing costs and is okay trading higher mortgage rates for that.
He probably wants lower financing costs for businesses so they can increase production. He also probably wants lower rates for a weaker dollar. Both of those things help close the trade deficit, something that is very important to him. If the general public was smart they would want higher mortgage rates to help drive down the price of housing. But they aren’t. People are very payment orientated and conflate low rates with a lower payment.
Well, Trump has apparently been blessed with the left handed good fortune.
Too die a fool
When the mag7 drop from $22.5T to $10T and the vacancy rate
rises from 7% to 8% and if ACA enrollment drops by 10M, along
with negative rates, a smaller gov and tariffs ==> US gov debt can drop from $40T to $25T/$30T, when the onshore industries are ready.
I keep my savings in 4-6 week t bills. Just cycle in and out of them.
Very easy. Gotta stay ahead of inflation.
Also a bonus is no Expense Fees from a fund. That’s nice
I keep 400k in gold. Ytd 65percent up. Nice
There is no yield in gold bullion. There are collectable capital gains of 28% after you sell that stuff, though.
“Gotta stay ahead of inflation.”
are you, after taxes?
and if Trump gains sway over the Fed, it wont be pretty …at least in the short end.
I see that NASDAQ and S&P500 are a lot lower today than just before the Fed’s rate cut on Wednesday. Treasury yields on 10, 20, and 30 years are higher than just before the cut (for more details, RTGDFA above). The Fed is losing credibility. Maybe markets will quit hanging on every little word, smirk, or fart from members of the FOMC. This would be a good thing. The economy should not be driven by a Politburo.
Looks like the auction buyers are under water based on today’s bond action.
One wonders what the Fed is thinking of doing? Far be it from them to allow the free market to find an equilibrium in the long end.
“T bills outstanding hit a record $6.7 trillion at the end of November, up by 18.6% from a year ago.”~ this(T bills outstanding) is important to keep and eye on. I am guessing we will see over 30% growth YOY. I will look here at wolf street for the data drop next year! T bills outstanding is giant trap when the fed funds rate goes up to fight inflation. I was told hedge funds are depositing money(via contracts) in money market funds as collateral for leverage, so buyers for T bills are plentiful and is the reason total money market assets keep going up. I keep saying unemployment rate will be inverted with the inflation rate in 27, I have been fixated on this outcome of inversion( maybe delusional) Ha
The Fed is always looking in the past- using suspect (IMHO) or missing data to try to set the future path of the economy. Any effects from changes in the Fed rates can take months to impact the actual real economy – even if the stock market speculators can react in an instant. Recessions seem to occur after the Fed has lowered interest rates, showing they are late to the game. And long term treasury rates and mortgage rates are more controlled by the market.
I think the Fed needs to flip its model and set what they think the proper neutral rate is to balance inflation and employment and then don’t change it for 6 months or a year. Set the rate and tell the market “this is what you get, now adjust accordingly “. Let the market and businesses adjust. It might be a shock and rough at first but eventually I think the markets would do a much better job of pricing rates.
And quit having FOMC meetings every six weeks. And stop all the public speaking by FOMC members. They provide no real benefit, they just help the spectators try to bet on how to make more money. The dot plots are just a silly game. How often do people go back and look at last year’s dot plots to see if they are right or wrong?
The Fed policy should be as neutral and stable as possible. Twice annual meetings would be enough. And they should layoff half their PhDs at Eccles.
Call me crazy or stupid, but the current system doesn’t work well for the entire country, only the bankers.
Amin!
I think a client (a really sharp community banker, bank having the best “financial” year it has since early 2000’s, he a huge advocate of Wolf’s insight) of mine said it best this summer… “we are in the greatest monetary experiment in modern history”… how it turns out – no one knows….
imo – Wolf’s last chart there (US National Debt) just showing “debt of the wazoo” is how we proceed… just keep doing what we have been doing until something breaks terribly….
The yield curve is now upward sloping or “normal”. In the past , even more upward sloping curves were common .
As the Feds portfolio of MBS runs off , one silent subsidy for mortgage rates will be eliminated .
It seems that factors are coming together to raise mortgage rates, not lower them
Together with ever rising property insurance , property taxes and maintenance costs , higher mortgage rates will guarantee a bear market in housing
Yes. and according to google
Housing’s share of the U.S. economy (GDP) generally hovers around 16-18%, split between residential investment (building/remodeling, ~3-5%) and housing services (rent, utilities, ~12-13%), though it fluctuates with the business cycle, dipping after the 2007 crash but rising to over 16% in 2024-2025, with significant economic impact on inflation (shelter costs in CPI) and jobs.
So it is truly amazing, some might say hard to believe, that the economy can be growing and super A+++ when a big chunk of it is on life support.
“Schmid(KC Fed) added that he continues to hear concerns about inflation in his district, and that his conversations suggest we’re at risk of moving toward a situation where inflation materially enters into the decisions of households and businesses.
In Friday’s statement, Goolsbee said he prefers to gather more data on inflation, given that progress in bringing down inflation has stalled for several months and almost all the businesses and consumers he has spoken to cite prices as a primary concern.”
And these are the two dissenters! At least Goolsbee is out talking to some folks who live in the real world.
Consumer sentiment may have much to do with media coverage which is decidedly negative despite running below 3% annually. Either the inflation numbers are wrong or consumers are focused on individual products acting outside the norm such as beef, coffee, etc. And ignoring what’s happening with gas prices and eggs.
One thing that upsets them on the Coasts is record home unaffordability that isn’t fully captured in inflation statistics because a large portion of it is considered investment, not current spending.
Well, when investments become out of reach, it impacts people a lot. Retirements, travel, kids education, general quality of life are impacted by what your savings and investments produce.
Both the articles and comments on this site are very valuable. Thanks for the constant production of excellent information.
American Education is pretty pretty pretty good?
lol
DJT said he wants to set rates and have the lowest rates in the world.
Sounds lije a guy who has a large stake in cryptos
Anybody honor the free market system?
The Fed announced that they will be expanding the balance by 40 billion in the very near future. What a bunch of morons. Now we are going to see inflation go back up to Biden era double digit inflation if it isn’t there already when the real data comes in. .
Dr. Richard Werner coined the word QE. He didn’t differentiate between bills and bonds.
How many times do I have to tell you, and how many charts do I have to show you to hammer into your head that the Fed’s balance sheet ALWAYS INCREASED, EVER SINCE THE FED’S FORMATION, in part due to the increase in “currency in circulation” — Federal Reserve Notes — which are a liability on the Fed’s books, and which MUST be available when people go to the ATM to get them. They’re now at $2.43 trillion. And the balance sheet MUST increase mathematically with currency in circulation. They’re demand based. The balance sheet MUST INCREASE with the TGA, which is the government’s checking account, and which just raised the desirable balance to $900 billion from $800 billion. And the TGA soared by $700 billion in the six months since the debt ceiling. The TGA wasn’t even at the Fed before 2009. Reserves must rise long-term with the increasing size of the banking system. Calling a balance sheet increase due to that stuff “QE” is just idiotic. You people need to RTGDFA which has the below chart which shows the increase of the Fed’s balance sheet from 2003 until Aug 2008, before QE started. Notice how it increased DUH. It always increased more or less with the economy (nominal GDP) which is why the total assets to GDP ratio was roughly around 6% for decades, until QE started in late 2008, which blew out the assets-to-GDP ratio. The balance sheet increasing in line with the economy is NOT QE, and people who call it QE are morons. Even Werner understood that, and he was wrong about a lot of stuff.
https://wolfstreet.com/2025/12/11/why-the-feds-reserve-management-purchases-are-not-qe/
“It’s all about inflation fears and supply fears” That is the reality that our government leaders are nuts.
Fortune: The Fed just ‘Trump-proofed’ itself with a unanimous move to preempt a potential leadership shake-up
The Federal Reserve’s early reappointment of its regional bank presidents took markets by surprise and eased concerns the central bank would soon lose its independence as President Donald Trump continues demanding steeper rate cuts.
On Thursday, the Fed announced 11 out its 12 bank presidents were re-upped, leaving out the Atlanta Fed chief role as Raphael Bostic had announced previously that he’s stepping down.
The presidents’ five-year terms were due to end in February, and prior reappointments have typically come closer to expiration dates as they historically have been routine affairs. But recent suggestions from the Trump administration that new conditions ought to be placed on the presidents raised concerns it was seeking a wider leadership shake-up.
After a small correction SPX might rise to the 7,500 area, for the 250Y
jubilee, before diving to a cold fjord in 2027.
Sounds like JPM forecast for 26! I am looking at Oct 2007 delayed 40 days to forecast the next year. Also, after the dot com peaked in March 2000 30days later the Nasdaq fell 10% in a day in April 2000, this was before the circuit breakers were installed with the flash crash of 2010. So this 10% down day or circuit breakers is on the table post AI peak. I know the Fed has one unsaid motto “if you know you can’t Fail what would you do?” Unfortunately traders are position with this bailout mantra in their mind, think SVB recently. I will admit the breadth of the rally expanded last week but only 62% of SP 500 companies are above their 200 EMA, this is one the reasons the secular bull market may of ended in my thesis. $vix close above 18.53 should get the algo selling, its set up for a rubber band snap back. Googl was down 3.67% this week so maybe AI bubble is post peak! 6 7 what’s mean it’s showing up in the financial data, Ha :)
Bailing out the big depositors at SVB was a big mistake. Classic moral hazard. Members of the FDIC, Fed, Treasury seem to leap from one mistake to another, hoping the piper will be paid after they leave office. Recall the S&L crisis. I actually worked for some of those bozos at the time. Seemed like every jackass with a million bucks was opening his own S&L.
Wolf – thank you for all you do. My question to this community is about California Muni bonds (long dated) for California residents. Since they are triple tax free (federal, state, local), the tax free equivalent yields seem very attractive. Do you believe holding them is a good idea ( despite notional losses as Treasury benchmark rates go up)
GO bonds seem to be OK, from a credit-risk point of view. Periodically, CA runs out of money, and then it issues Revenue Anticipation Notes (RANs), which I have bought in the past because there were pretty sweet deals, but came with some risks; in addition, CA has twice issued IOUs to vendors, instead of paying them with real money, but banks accept those IOUs for deposit, and vendors could cash them. But GO bonds have so far been untouched.
If you get other bonds, such as local bonds, hospital bonds, water bonds, etc., you’re taking on some serious risks, which is OK, if you get a big-fat yield to be compensated for those risks.
This website should be called the Treasury Bond Buddies…. lol.
Lot to learn about the reality of it all. The economic cross currents make this hard to fathom. Am I correct to assume this crowd of investors are savvy beyond the norm? Seems like.
It seems the desired solution here is to see a wholesale reduction in real estate prices in opposition to having to give up interest income that exceeds inflation. Is this true?
Home prices spiked by 50-70% in two years and no longer make economic sense. Part of the housing market has frozen; there’s an affordability crisis, and the solution to all this is the market… let the market bring prices down and incomes up until it makes sense again. Historically normal-ish mortgage rates (6-8%) will help that along.
“By Thursday evening, in the secondary market, the 30-year Treasury yield was back at 4.80%, and by this morning it rose to 4.86%, the highest since September 4. It’s almost funny how the 30-year yield blows off the Fed’s rate cuts. It’s all about inflation fears and supply fears:”
Based on the history of other empire debt challenges, to what extent are bond yields demanded by the market an indicator that the debt is not going to produce economic growth or at least stability as effectively collateral on the debt? And at this time scale military dominance and security come into play, as well. If a global empire such as the U.S. has 30 year debt at 4.86% yield, is that high compared to benchmarks? Is there some way to put the yield in context, on what is basically a bet on the viability of the U.S. empire in light of being challenged mainly by China, but the rest of the world, too? At what point would we say that the trend in the 30 year bond yield is being driven by the inevitable decline in the empire as the primary root cause? At a 30 year time scale, how would “inflation fears and supply fears” be relevant? It would seem that macro, systemic issues on a global scale would be the root cause of risk; the price of eggs and avocados is totally irrelevant.
My entire life, people have been predicting the “decline of the empire” — I even read a book about it in the 1980s maybe when 30-year yields were 18%. And I’m still waiting for it.
declines of empires are measured in centuries and many decades, not just a few decades. peak amerikan empire was 1945 to 1965. silver default in 65 and gold in 71 was the tell. not to mention losing a war against rice farmers.
LOL, like anyone can accurately predict what happens 200 years from now, and like I care what someone says will happen 200 years from now. This stuff is just a joke. One thing everyone can predict accurately though: everyone who has ever read or posted anything at all on this site will be dead 200 years from now.
In a way, we were a hostile split from a larger company. We came up with this brilliant idea and none of the bosses were listening.
Tisk tisk
It would be interesting to benchmark the 10-year and 30-year debt with government investments on that time scale. The color of the money should match how it is used. Naively I would think that if I loan the U.S. government money for 30 years it would go towards 30 year projects, and on down the time scale. If I loan the government money within a budget cycle it would be used for cash flow purposes but not investment. Is there any requirement to match debt to it’s use, or does it all just go into a big pot and Congress pulls from that pot without a one-to-one matching with the color of the debt obligations?
I think this is part of the problem—Congress puts us way into debt because of the financial crisis and then the pandemic but the debt is not tied to anything on any time scale. We are paying down debts but there’s no way to point to anything specific, e.g. specific bonds with serial numbers that were issued to pay for specific expenses on specific time scales. Can we point specifically to which debt applies to the financial crisis and which to the pandemic and how we are progressing in paying it down? I guess this is the definition of “Debt out the wazoo” where we just take on debt without being responsible from an accounting standpoint and it’s just a blur so nobody is accountable.
It’s like a company, such as Apple, issuing unsecured 30-year bonds with funds to be spent “for general corporate purposes.” And some may add “to pay off maturing debt.” Those are the two reasons for issuing unsecured bonds. Same as with the government. They’re standard practice. Other times, bonds are issued that are secured by the thing the fund, such as data centers, real estate, etc.