Oakland, Austin, New Orleans, Manhattan, Lee County (Cape Coral, Fort Myers), Sarasota County, San Francisco, Birmingham, Washington DC, Denver, Phoenix, Contra Costa County…
By Wolf Richter for WOLF STREET.
Prices of mid-tier single-family homes in 14 bigger cities and counties have dropped by 10% to 25% through October from their respective peaks in prior years, seasonally adjusted, after mindboggling price explosions of 60%, 70%, and even over 80% from mid-2020 to their peaks.
The bigger cities or counties with the biggest price drops of mid-tier single-family homes from their peaks (year of peak):
- Oakland, CA: -25% (2022)
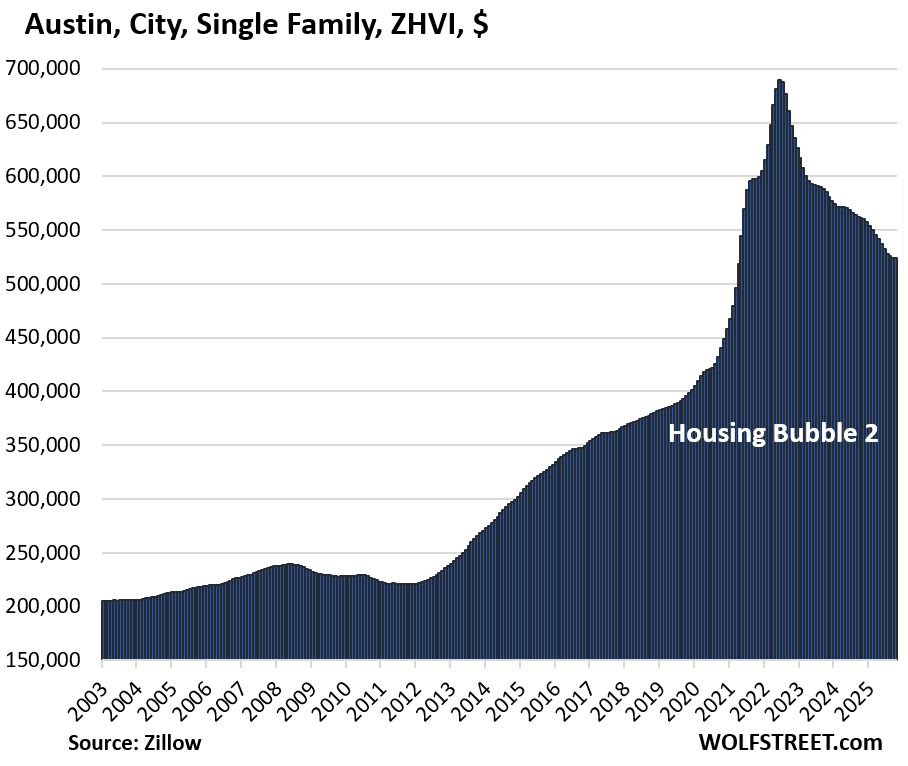
- Austin, TX: -24% (2022)
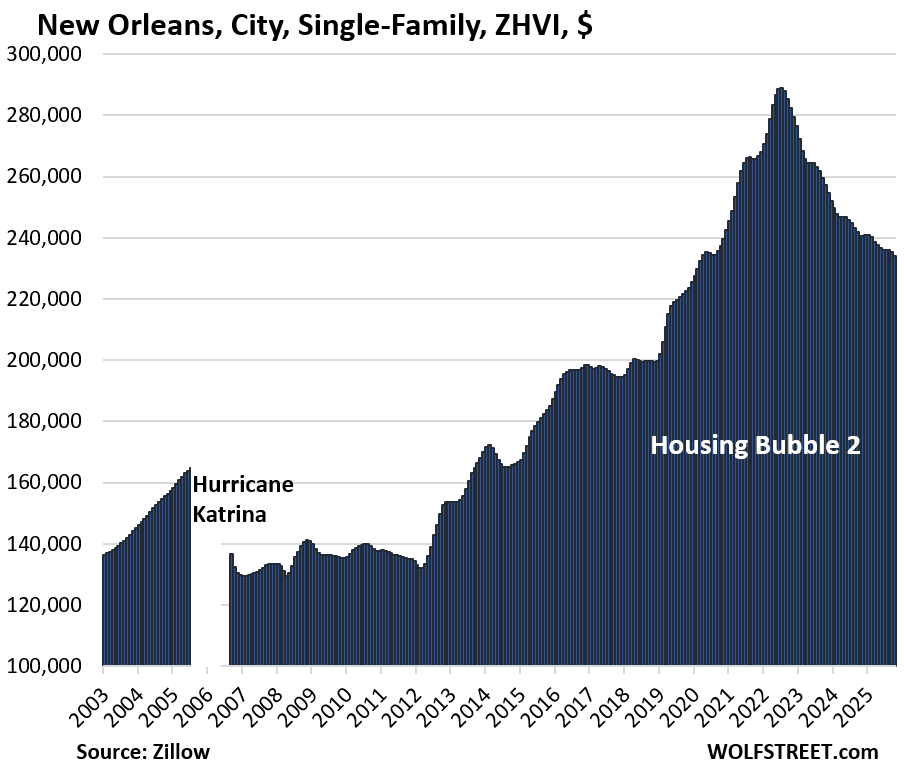
- New Orleans, LA: -19% (2022)
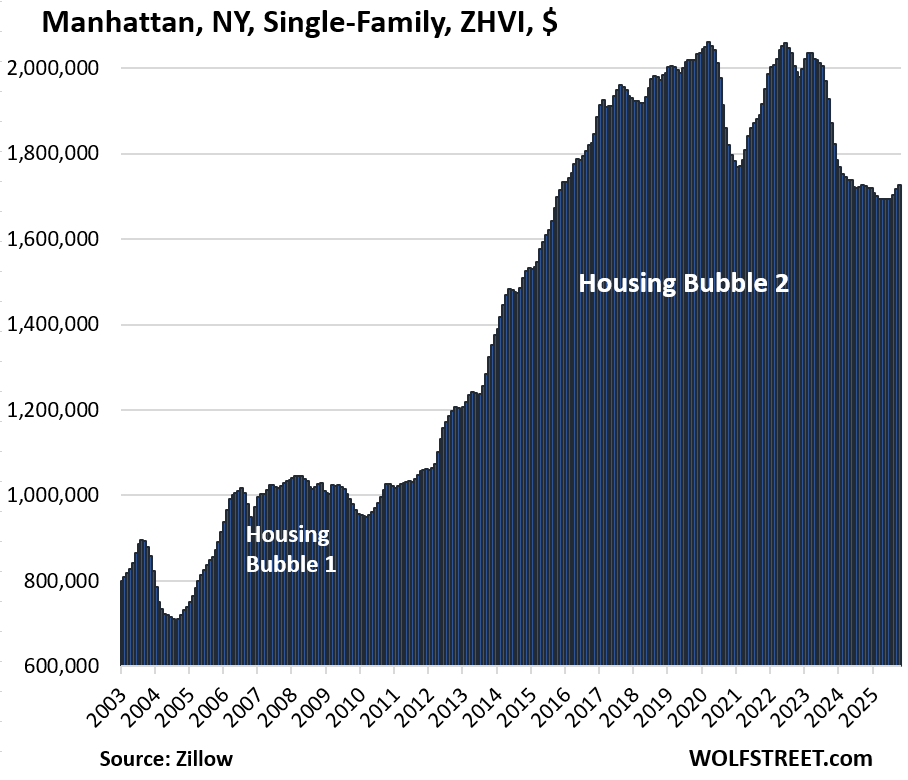
- Manhattan (New York County), NY: -16% (2020)
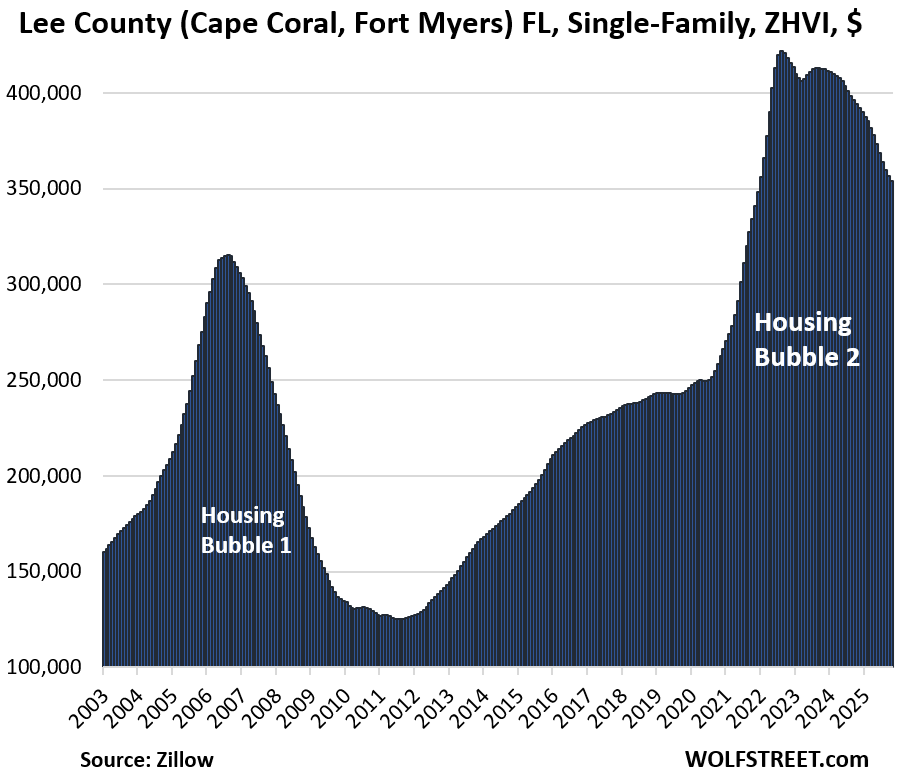
- Lee County (Cape Coral, Fort Myers), FL: -16% (2022)
- Sarasota County, FL: -16% (2022)
- San Francisco, CA: -15% (2022)
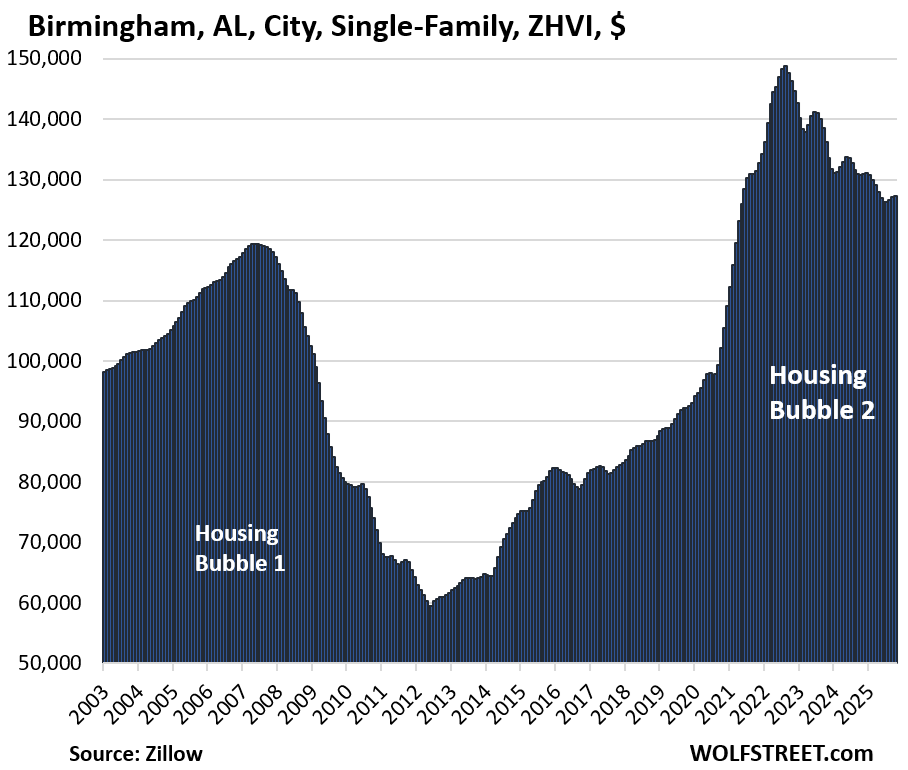
- Birmingham, AL: -14% (2022)
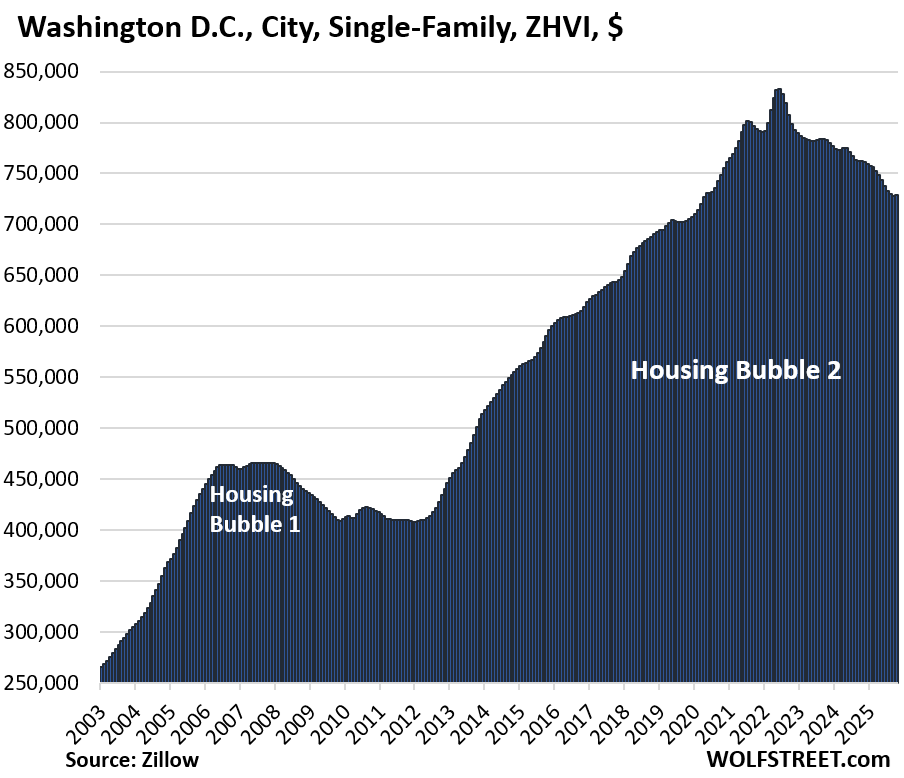
- Washington, DC: -13% (2022)
- Contra Costa County (SF Bay Area), CA: -12% (2022)
- Denver, CO: -11% (2022)
- Collier County (Naples), FL: -11% (2024)
- St. Petersburg, FL: -11% (2024)
- Phoenix, AZ: -10% (2024)
Didn’t make the list: There are many other bigger cities and counties where mid-tier single-family home prices have declined from their respective peaks in prior years, but not enough to make the 10% cutoff.
In eight of them, prices have dropped by about 9%. Others are still quite a bit away from the 10% line. I added San Mateo County this time; it tracks the northern part of Silicon Valley, but its many cities are too small for the list of “bigger cities” here.
Prices in Orange County have just begun to decline earlier in 2025 and are down 2% so far, seasonally adjusted, and so it didn’t even make this list, but we’ll keep our eyes on it.
Here are some examples (year of peak):
- Mesa, AZ: -9% (2022)
- Glendale, AZ: -9% (2022)
- Aurora, CO: -9% (2024)
- Ft. Worth, TX: -9% (2022)
- Portland, OR: -9% (2022)
- Chandler, AZ: -9% (2022)
- San Antonio, TX: -9% (2024)
- Sacramento, CA: -9% (2022)
- Seattle, WA: -8% (2022)
- Gilbert, AZ: -8% (2022)
- Boise, ID: -7% (2022)
- Memphis, TN: -7% (2022)
- Colorado Springs, CO: -7% (2022)
- Arlington, TX: -7% (2022)
- San Mateo County, CA, part of Silicon Valley: -7% (2022)
- Tampa, Fl: -6% (2024)
- Dallas, TX: -6% (2024)
- Plano, TX: -6% (2024)
- Atlanta, GA: -6% (2022)
- San Diego, CA: -5% (2024)
- Jacksonville, FL: -5% (2024)
- Spokane, WA: -5% (2024)
- Orlando, FL: -5% (2024)
- San Jose, CA: -4% (2024)
- Houston, TX: -4% (2024)
- Corpus Christi, TX: -4% (2024)
- Los Angeles, CA: -3% (2024)
- Reno, NV: -3% (2024)
The year-over-year price declines were led by:
- Lee County (Cape Coral, Fort Myers): -10.2%
- Sarasota County: -10.1%
- Oakland: -9.7%
- St. Petersburg: -9.2%
- Austin: -6.7%
Methodology and data: These prices are seasonally adjusted three-month averages of single-family mid-tier homes in “cities” or “counties” (not in Metropolitan Statistical Areas, which are much larger). All data here are from the Zillow Home Value Index (ZHVI), which is based on millions of data points in Zillow’s “Database of All Homes,” including from public records (tax data), MLS, brokerages, local Realtor Associations, real-estate agents, and households across the US. It includes pricing data for off-market deals and for-sale-by-owner deals. These are not median prices.
The 14 bigger cities & counties with the biggest price declines:
The metrics in each table from left to right: price decline from the peak, month-over-month change (MoM), year-over-year change (YoY), and the remaining increase since January 2000 (for Birmingham, since 2002, which is as far as the data goes back).
| Oakland, City, Single-Family Home Prices | |||
| From May 2022 peak | MoM | YoY | Since 2000 |
| -25% | -0.3% | -9.7% | 276% |
Prices are back to 2018. In the 10 years from mid-2012 to the peak in May 2022, prices exploded by 236%.

| Austin, City, Single-Family Home Prices | |||
| From Jun 2022 peak | MoM | YoY | Since 2000 |
| -24% | -0.1% | -6.7% | 166% |
| New Orleans, City, Single-Family Home Prices | |||
| From Jun 2022 peak | MoM | YoY | Since 2007 |
| -19% | -0.5% | -2.8% | 106% |
Back to 2020. Prices have given up the entire 23% price spike between mid-2020 and mid-2022.
| Sarasota County, FL, Single-Family Home Prices | |||
| From Aug 2022 peak | MoM | YoY | Since 2000 |
| -16% | -0.7% | -10.1% | 214% |
Over the two years from mid-2020 to mid-2022, prices had exploded by nearly 70%.

| Manhattan (New York County), NY, Single-Family Home Prices | |||
| From Mar 2020 peak | MoM | YoY | Since 2000 |
| -16% | 0.5% | 0.1% | 292% |
| Lee County, FL, Single-Family Home Prices | |||
| From Aug 2022 peak | MoM | YoY | Since 2000 |
| -16% | -0.7% | -10.2% | 189% |
The county includes the cities of Cape Coral and Fort Myers. From mid-2020 to the peak in mid-2022, prices exploded by 69%. This kind of buyers’ behavior is mindboggling.
| San Francisco, City, Single-Family Home Prices | |||
| From May 2022 peak | MoM | YoY | Since 2000 |
| -15% | 0.8% | 0.3% | 237% |
Prices first seen in mid-2018.

| Birmingham, AL, City, Single-Family Home Prices | |||
| From Jul 2022 peak | MoM | YoY | Since 2002 |
| -14% | 0.2% | -2.6% | 32% |
From mid-2020 to mid-2022, prices exploded by 53% and have given up about one-third of that by now.
| Washington D.C., Single-Family Home Prices | |||
| From Jun 2022 peak | MoM | YoY | Since 2000 |
| -13% | 0.1% | -4.4% | 272% |
Back to April 2020.
| Contra Costa County, CA, Single-Family Home Prices | |||
| From Jun 2022 peak | MoM | YoY | Since 2000 |
| -12% | -0.1% | -4.8% | 192% |
This San Francisco Bay Area county (East Bay) is home to 1.16 million people, but spread over lots of smaller cities. Back to mid-2021. Prices had exploded by 38% from mid-2020 to mid-2022.

| Phoenix, City, Single-Family Home Prices | |||
| From Jul 2022 peak | MoM | YoY | Since 2000 |
| -11% | -0.2% | -4.5% | 247% |
Back to December 2021. Since mid-2020 and mid-2022, prices had exploded by 60%.

| Collier County, FL, Single-Family Home Prices | |||
| From Mar 2024 peak | MoM | YoY | Since 2000 |
| -11% | -0.5% | -8.0% | 242% |
Includes the city of Naples. From mid-2020 to the peak in mid-2024, prices had exploded by 82%, which was nuts.

| Denver, City, Single-Family Home Prices | |||
| From Jun 2022 peak | MoM | YoY | Since 2000 |
| -11% | 0.1% | -4.3% | 212% |

| St. Petersburg, City, Single-Family Home Prices | |||
| From May 2024 peak | MoM | YoY | Since 2000 |
| -11% | -0.5% | -9.2% | 351% |
Lowest since March 2022.

And in case you missed it:
The 24 Bigger Cities where Condo Prices Have Dropped by 12% to 29% through October
Enjoy reading WOLF STREET and want to support it? You can donate. I appreciate it immensely. Click on the mug to find out how:

![]()
Well, it’s about $500 month PITI at 3% mortgage per $100k financed, and $800 month at 6.5%.
So a $300k house now $900 more a month at $2400 from $1500, and $900k $2700 more at $7200 from $4500.
Also, that $7200 a month house can be rented for $3100/month. There is some law of nature at work here that some people know and I don’t.
In my hood in socal it takes almost 12k per month to carry a home but only 5k to rent it
Per $100,000 financed the difference in principal and interest between a 3% and 6.5% mortgage is $210 a month (a payment of $422 versus $632). Presumably, taxes and insurance will be the same because the house is the same, only the interest rate on the mortgage changes. So the $300k mortgage is about $630 more per month. A $900k mortgage would cost $1,890 more per month. The difference is still a lot, but significantly lower than $900 or $2,700.
A thousand variables but still pretty accurate broadly.
What I wanted to convey is the ~ actual cost from just 3 years ago.
2.5, 3% vs 6%, 7%, etc, etc. Prop taxes and insurance way up.
I’d never want to underestimate the actual costs. Then start thinking about maintenance and reserves, add another few hundred a month.
Luck favors the prepared.
Your original comment only addressed the purported difference in the cost of ownership between two different interest rates, and doesn’t mention a timeframe at all. It overstated the difference in cost by 30%. I guess I was confused because it’s impossible to know from your original comment that you were trying to convey the increase in actual cost from an interest rate of 3% three years ago to an interest rate of 6.5% with correspondingly increased taxes and insurance today.
However, your PITI numbers are still problematic. Three years ago you’re assuming for every $100k financed the cost of insurance and taxes is $78 per month ($500- $422 mortgage payment). Three years later you’re assuming the cost of insurance and taxes over doubled to $168 per month ($800-$632 mortgage payment). A 115% increase in insurance and taxes in only three years is a lot. Some people in disaster prone areas may have seen an increase like this in insurance, but it’s not the norm. Also, property taxes tend to go up because of increasing property values, not actual increases in the tax rate. The tax component of each increment of financing will stay the exact same unless the actual tax rate goes up. I’m guessing there are very few places where the tax rate has gone up 115% in the last three years. The point is that the PITI amounts you estimate in your original comment, even assuming a three year gap, are still pretty flawed. Accurate assumptions lead to better conclusions.
lol man – a recent survey of women of most attractive traits of men – reading, playing an instrument, speaking a foreign language.
Least attractive – arguing online, below crypto, vaping and porn. ✌️
Rojo said: “A 115% increase in insurance and taxes in only three years is a lot.”
Correct. This is exactly what homeowners across America are complaining about.
It has been a lot. Our building’s insurance has gone up more than that “115%” number, and I have heard (anecdotally) that others in my area have increased even more than ours.
The excuse being that we’re in a “potentially” disaster prone area (I live in CO).
Also, as the opening paragraph states that “property values have exploded,” from 2020 (high?) levels to absurdity.
This indicates that the property taxes (based on home valuations) have risen also.
Again this is not to mention the myriad other associated costs.
We must certainly be aware that this is very market specific. As we are talking about up to 20% price declines and simultaneously there’s markets near the top/ still eeking out new highs.
I do like the closing oxymoron: “Accurate assumptions,” but it may not make the best name for a financial advisory firm.
@Reddog,
Interesting comment… but what does “below crypto” mean?
“property taxes tend to go up because of increasing property values, not actual increases in the tax rate”
My property tax bill has gone up every year since I purchased, even in 2022 when my assessment stayed flat. They raise the rate in lieu of the assessment.
Well yes that is the facts of living in an libertarian authoritarian, the Trump administration world.
I don’t think MTG should concede.
This is a financial commentary website, not political. But never suggest Trump is libertarian. That is ignorance.
While I and others may not like it finance and politics go hand in hand most of the time.
Leaving aside (for a minute) the Fed ZIRP-induced madness behind all the idiotic/harmful home price volatility of the last 20 years…perhaps it is time for a new question…
Given these *huge* run ups in prices from, say, 2012 to 2019 (I’ll ignore the Pandemic blow-off top)…where was the supply response?
That is to say, if “market” prices (2012-2019) are rapidly rising by 10’s/100’s of thousands – where were the “new builds” (both SFH – and especially apts) in response?
I don’t think home component prices (lumber, etc.) were exploding during the 2012-2019 period – so if construction costs were relatively constant – with rocketing sales prices – there were fortunes to be made in home construction (see, also, in spades, 2002-2006).
And yet, *new* supply sort of putt-putted along, slowly climbing out of the 2008 blast crater. (I’m sure 2009 PTSD will be cited as a rationale for the slow supply response post 2009…).
The moronic/pathological leveraged-speculation games that drove *existing* home prices through the literal roof in 2002-2006 and 2012-2019 (and, especially, 2021-22) *should* have provided the impetus for much higher/faster *new builds* – because the astronomical sales prices should have been an impetus (given relatively constant construction “replacement costs”)
(I’m sure the Fed has been asking the same question for 20 years.)
So what (in practice) has strangled supply increases?
I’m fairly certain we’ve got to look at local government/politics for that.
(CA (CA!!) state seems to have come to the same conclusion – attempting, with ltd success so far, to override local slow-crawling on allowing increased number of new-builds).
But why would this local strangling in supply prevail post 2000, when it did not in earlier decades?
And why would it occur nationwide?
“where were the “new builds” (both SFH – and especially apts) in response?”
We’ve been talking about this for years here.
Multifamily construction (condos and rentals) boomed starting in 2015 at the highest levels since the 1980s, with a top-off spike in 2021 and 2022. The chart shows starts of multifamily buildings, but it can take a couple of years or more to complete big towers. The surge in supply of now completed and vacant units on the market has put downward pressure on rents and condo prices. Most of these are higher-end units, because that’s where the money is; someone wanting to rent or buy for less needs to look at older buildings.
Single family home construction also started surging a decade ago and reached very high levels in 2020-2022, and there is a now a lot of inventory for sale on the market, and builders are cutting prices and are making deals to move that inventory. And they’ve reduced their activity level some to not drown in inventory.
Did Alameda County not make the cut or was it excluded because of the overlap with Oakland?
Yes, Oakland is the biggest city in Alameda County. This list is essentially about “bigger cities,” so there’s no need to track Alameda County.
And then there is the other issue with counties: Oakland is a household name and everyone around the country knows where it is, but not many people outside of California have ever heard of Alameda County, which is part of the problem with listing counties – people don’t know them. How many people in California know where Harris County is? But everyone knows the city of the county seat.
In some areas, the cities are very small, too small to mention here, but are close together, and well represented by counties. The Bay Area and Florida have lots of those places: small cities in big urban areas, grouped into counties. Costa Contra County doesn’t have any big cities, so I couldn’t pick a big city. San Mateo County the same. In Sothern California, there are huge cities, and no need to name counties, except for Orange County, which doesn’t have any big cities, but is an important market.
To address the many smaller cities in Florida, I included three counties this time, consolidating some of the smaller cities I’d listed separately in my prior articles, and I’m going to add some more counties over time to track the groups of smaller cities that otherwise wouldn’t make the list.
Ha, I’m in California and had to look up Harris County. I’ve never been to Texas, but now I know the county where Houston is located.
These “crazy” numbers used to happen all the time. They would bounce 20% in a couple of months. Course they used to crash every five years or so. The rocket ride is old hat in the golden state.
Now we get a traditional housing slump that takes years. This is the kind of market showing the math of rental prices under the cost of buying. These houses are deep pocket wealth destruction. Just think of the renting versus owning equations staying bad for another decade, and how it will sour people on ownership.
This is a trend that now rewards activity like getting rid of vacant or underutilized property fast, instead of banking it for large spec returns. But the hold on mindset is strong. The boomers have so much of it, and they have been trained to buy and hold for the long term. But it’s all been due to demographic demand, and the next two cohorts don’t earn enough collectively to buy at these prices.
It’s not 2008 with tons of foreclosures, it’s a long slog. The only disaster segment is Florida tower condos…. because salt rots steel and concrete….
It is much more than a slump in the price of housing. The problem is that housing is being priced at 2.5x the affordability of the American family.
Something has to give. The price has to drop by 50 pct which will impact the world markets.
A landlord renting for less than the cost of buying ‘at today’s cost’ is irrelevant. It is the owners cost basis that matters, and is used when calculating ROI. Reason to never sell until you ‘Buy the Farm’ is the tax liability. In addition you get a tax benefit of depreciating the asset to zero. When inherited the basis is reset to current market value allowing the heir to sell it without a tax liability, at that time if they desire. It only makes sense to invest in a rental when the ROI is 9% or more. Other positives are it is a hard asset that cash flow and adjusts for inflation. I would be nervous if all of my assets where in the market, so diversity is a strength, in this scenario. As far as “Deep Pocket Wealth Destruction”, I don’t think that is the case considering upward of 90% of SFR’s are ‘mom and pop’ landlords.
Look at any one of your charts! They still have a long ways to fall before they are anywhere near a good buy.
Add to that the cost of upkeep and updates and you have a real case not to own anything but a new home.
Considering the changes we are seeing in the upscale, white collar, labor market and you have another red flag. The very best will always be in demand, everyone else look out.
When cash rich companies are cutting costs for whatever reason they say, there is always more to the story.
A 90% drop from present laughable housing prices would be a good start.
We’ll get there or at least around 80% drop.
People have to be able to buy the housing, and Americans can’t do that until housing drops 60% at least, really more than that since all other costs related to housing (maintenance, insurance, etc.) have gone up so much more than housing prices have.
People seeking continual capital gains are going to get nailed.
“People have to be able to buy the housing, and Americans can’t do that until housing drops 60% at least…”
About 4 million people bought homes this year. That’s down about 25% from normal times, but it’s still 4 million people, and they likely overpaid, but they could buy, obviously.
Washington DC got hit with a triple whammy.
1. End of pandemic – massive gridlock traffic
2. DOGE cutbacks
3. government shutdown
For Washington, DC, I would add National Guard occupation, work from home, illegal immigration crackdown, 50% of housing stock in underperforming condos, fear of crime, local government budget problems. The. Condo market is rolled back to 2015 prices and still has a ways to fall more. The single family home prices falling 13% as noted by Wolf above tells only the most resilient part of the story.
We have rented for 10 years now and both are 29 and 30.We know we can afford a house on paper with the banks or credit unions,mortgage companies but we knew it was going to squeeze us too much over 25 years.It is a good thing we did not do that as our rent is $1,700+utilities in Canada but we understood that we still need savings,retirement money for our future.
We are not into investing,trading,all that jazz but we have managed to put the maximum in our RRSPs,TFSAs,GICs from our full time employment.We are not by no means wealthy or really well off but looking at our friends,family in debt with mortgages,lines of credit,other unsecured loans,financing with and without real estate etc. they are in a dire situation with 30%+ declines in home,condo prices and debt in the $600,000 to $700,000+.
Also they have little to no equity,net worth if negative now.We at least have $189,000 in savings,deposits all deposit guaranteed plus $15,000 in liquid,reserve money also all deposit guaranteed.
Chris Rock is saying: “What you want, a cookie?”
You are not supposed to be in neck level debt. You are supposed to be healthy.
Jokes apart, there are so many people in same boat as you. But remember, FED created humongous All Assets bubble in last 15 years with ZIRP and excessive QE. So I can show you equal number of people who benefited huge by buying home and assets very early in 2011-2013 and kept on refinancing at 2.62%. Even with latest corrections, home prices in many Bay Area cities have tripled in last 15 years. Also California has Prop 13 means those who bought decade ago their property price is still very low based on Purchase price.
I live in San Mateo county. I always felt I don’t see those huge 15-20% correction in my county. Wolf added today that county. I can see it is just 7% down from 2022 peak. I can purchase home today, I still wont buy home because I know it doesn’t make sense financially. Rent is only 35-40% of monthly PITI if I buy equivalent home. I dont believe one ounce also in Bitcoin crap. Same for those AI bubble stocks.
But unless those huge asset bubbles burst, I won’t call your friends fools or fiscally irresponsible. It is still not proven.
Well, if Panesh and Sandeep are not buying houses we’re in trouble.
Andy,
As usual you have nothing meaningful to add.
Well,feel there are perhaps a million Panesh and Sandeeps out there,that could be a problem.
For many months, Wolf is writing about Buyers are on strike in many Markets across US.
Without that we would have 20% or more correction list.
People like Panesh have mobility when it comes to renting a place versus buying one.Also, each time you sell a house,condo big bucks are taken out to move.
Anywhere from $40,000 to $60,000 just all the costs,fees,expenses and so on.Unless you are lucky to buy in affordable,more realistic housing markets say $500,000 or less than good luck.
My cousin in Canada can’t find anything decent below $800,000 in many areas with high high property taxes.
MW: Why bitcoin’s brutal drop from an October record high is now a crucial barometer for the broader market
Exactly!!! Googl is having its blowoff top now, it will close red for the week on Friday, CCPs are on the hook for bitcoin derivatives trades.
Google is crushing it. Why that’s worrying investors in Nvidia and other AI stocks.
GOOGL +5.37%
GOOG +5.40%
NVDA +1.38%
For sure, Alphabet has been crushing it, out preforming NVDA since mid July. It’s the last momo race horse that’s why it attracted so much liquidity today. Technically I think today was the island reversal for alphabet, I called it a blow off top. Friday red for the week after a 6.33% up Monday? Yeah for sure all down hill from here, Ha, I don’t short stocks but I love to chart! . “The harder they come the harder they fall” ~ Jimmy cliff RIP may his music be a blessing.
17 years between 1949 and 1966. 17 years going sideways. 17 years from
1982 and 2000. 17 years between 2009 and 2026. A sharp correction
might be next -> deflation.
From another website – home foreclosure filings rise 19% in October, from the previous year. This is getting serious, folks. Prepare accordingly. And no, interest rate cuts are not going to fix this failing monstrosity. It’s like trying to stop the water coming over Niagara Falls.
🤣 what moronic website, clickbait-purveyors! Foreclosures were near zero during the pandemic’s foreclosure bans. Now they’re rising from those near-zero levels but are still historically low, and are far lower than anytime before the pandemic.
Don’t ever go back to those idiotic websites that pollute your brain with this moronic clickbait garbage. We discuss foreclosures here with charts so you can see for yourself:
https://wolfstreet.com/2025/11/07/here-come-the-helocs-mortgages-housing-debt-to-income-ratio-serious-delinquencies-and-foreclosures-in-q3-2025/
Is Cordcon the largest city in Costa Contra County?
Cordcon? I had to look that one up. But yes, Concord is the largest city (124,000 pop).
Mostly, I see two types of sellers:
1. Normal market sellers like estate sale, divorce, relocation(willing or unwilling)
2. Flippers from the West Coast who bought in 2020-2022+
The bulk of the rest are folks who have no reason to move, paid way less for their home and if they have a mortgage it is likely 3-4%
Whether this will cause a massive crash or not is debatable. Inflation for replacement is baked in the cake, IMO. Places like Austin where regs are easy and space to expand is not constrained may have a different result. The 15 year is now <5% so astute buyers can buy something they and by month 6 be paying more in principal each month than interest.
For some buyers that might make a lot of sense. Especially those that feel locked into that 3% 30 year loan yet want to move or downsize.
@wolf I keep hearing the counter argument that there won’t be a housing bubble burst because there’s a long term under supply due to under building out of the housing bubble burst. That sure there’s a lack of buyers at the moment but that fundamentally there’s a huge under supply. What’s your thoughts on this?
Just look at the charts!!! That’s the beginning of a bust in the formerly hottest markets. There is no shortage of supply. The charts call BS on the propaganda you hear.
I see that at the current moment supply outweighs demand for sure. My question was around long term supply dynamics. Are we actually short housing? I don’t remember hearing anything about that pre – 2021 but that’s narrative by real estate investing podcasters like bigger pockets atm. People admit there will be a temporary softening, but that a crash is impossible with the underlying supply shortage relative to our population.
The hosuing bust is likely to start accellerating in the markets that are now more than 20% off from peak.
Recall what happened in the runup to the 2008 housing bust – easy mortgages with 5% down. As the housing market declned, homeonwers were quickly underwater and defaulted on their mortgages or mailed the keys back to the mortgagor (jingle mail). This threw large numbers of properties on the market, which accelerated the downward momentum.
Afterwatd, mortgage standards were tightened. Almost all mortgages now require 20% down. A few years back, when the housing market started to weaken, the hosing market proponents said that 2008 couldn’t happen again because it now takes 20% down to buy a house.
You do not hear that being said anymore now that there are markets more than 20% down from peak. Keep an eye on the delinqency and foreclosure rates in the markets more than 20% down. Also, watch for accellerating downward pricing in these markets as the foreclosed properties come onto the market.
Now for the big quesiton – will this bankrupt big banks and lead to a global financial crisis?
History never repeats but I am betting this will rhyme with 2008.