Despite all moaning and groaning and sour feelings in consumer land, credit card delinquency rates improved further.
By Wolf Richter for WOLF STREET.
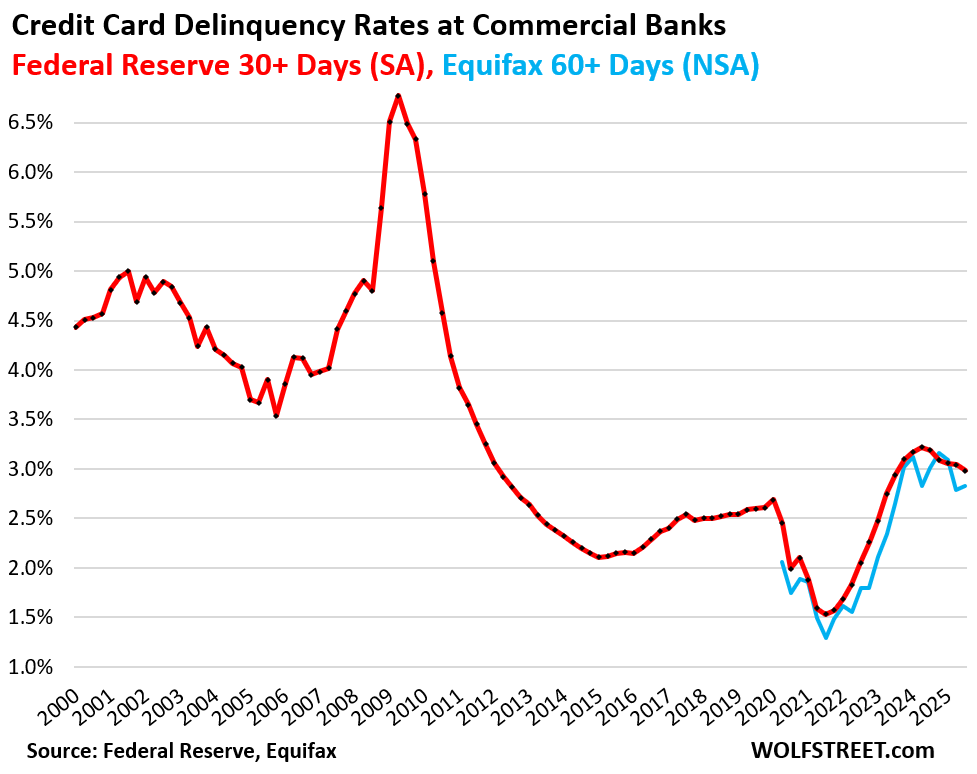
During the Free-Money era, credit card delinquency rates had dropped to very low levels, and then, as the Free-Money era ended, they rose out of the trough and then overshot, which peaked in early 2024, and since then they’ve headed lower again.
The 30-day-plus delinquency rate on credit cards issued by all commercial banks declined to 2.98% at the end of Q3, seasonally adjusted (SA), the lowest since Q2 2023, and down from 3.19% a year ago, according to the Federal Reserve today, based on data from commercial banks (red in the chart). This includes credit cards by subprime-rated cardholders.
The 60-day-plus delinquency rate for all bankcards, including subprime, not seasonally adjusted (NSA), edged down year-over-year to 3.02% (from 3.23% in Q3 2024), per Equifax (blue in the chart).
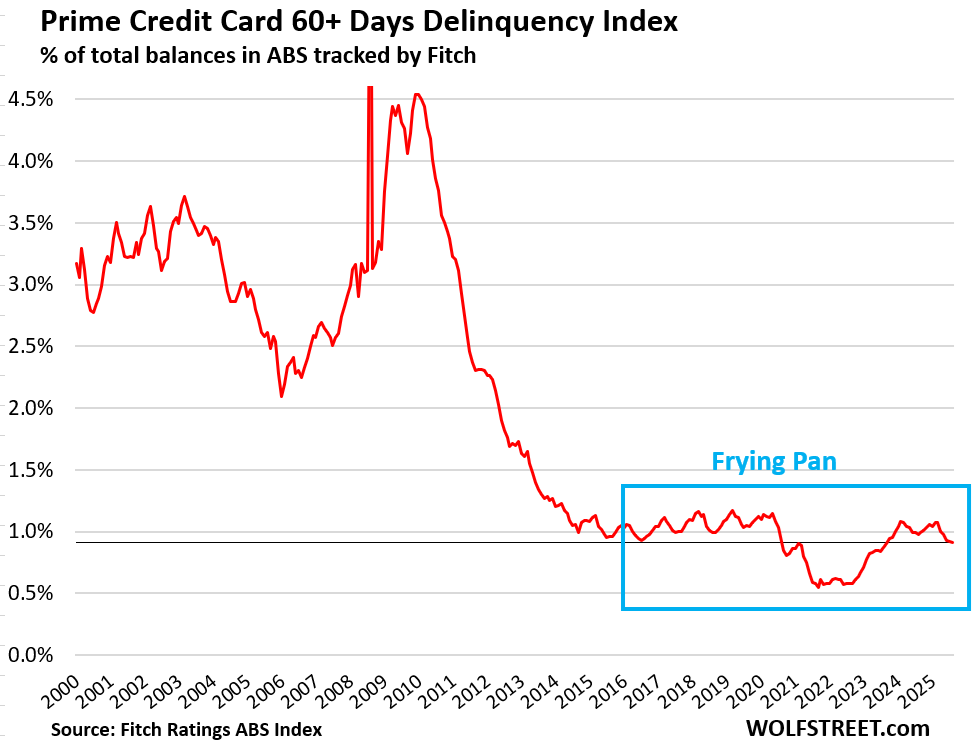
For prime-rated cardholders, the serious delinquency rate of 60-plus days dropped to 0.91%, the lowest on record outside of the Free-Money era, according to data from Fitch Ratings, which tracks the performance of Asset Backed Securities (ABS) backed by credit card balances whose holders had a prime credit rating when the accounts were opened.
The “frying pan” pattern, as we have come to call this phenomenon, shows how delinquency rates declined during the Free-Money era, and then reverted to just-below pre-pandemic levels, forming this frying pan figure that we have seen crop up in many delinquency, default, and foreclosure charts.
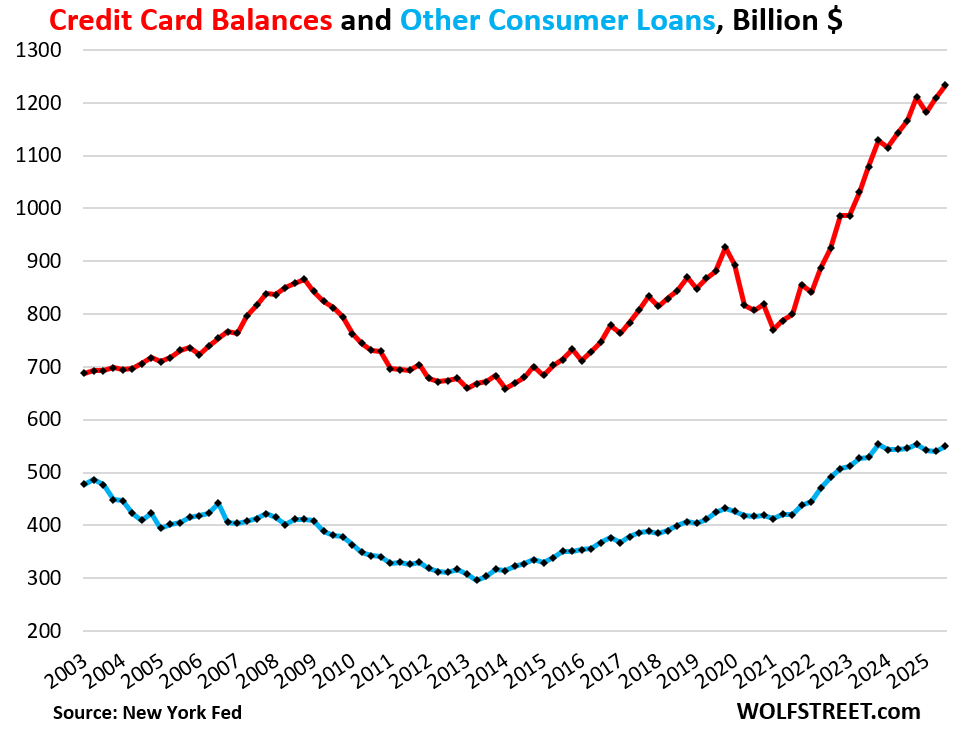
Credit card balances: a measure of spending, not of borrowing.
Credit card balances (red line in the chart below) rose by $67 billion year-over-year, or by 5.7%, in Q3, to $1.23 trillion, on growth in consumer spending and price increases (data from the New York Fed’s Household Debt and Credit report).
Credit card balances are a measure of spending, not a measure of borrowing. Credit card balances are statement balances before payments are made. They reflect the fact that credit cards have become the dominant consumer payments method in the US and largely replaced checks and cash. Debit cards are the second most popular payment method. Credit cards are used to pay for anything, from smart parking meters to business trips (hotels, airfares, meals, etc.) for which cardholders get reimbursed from their corporate or government employers. Roughly $6 trillion a year are run through credit cards. Most of these balances get paid off every month by due date and never accrue interest.
So what we’re looking at here is increased spending, including through higher prices, and not increased borrowing. These month-end credit card balances do not reveal the amounts that are accruing interest and would represent actual borrowing.
“Other” consumer loans (blue line), such as personal loans, Buy-Now-Pay-Later (BNPL) loans, and payday loans, inched up a hair year-over-year (+0.7%), far less than the rate of inflation, to $550 billion. Balances have barely risen over the past 22 years, despite the growth of the population, income, and spending over the period.
How much of a burden?
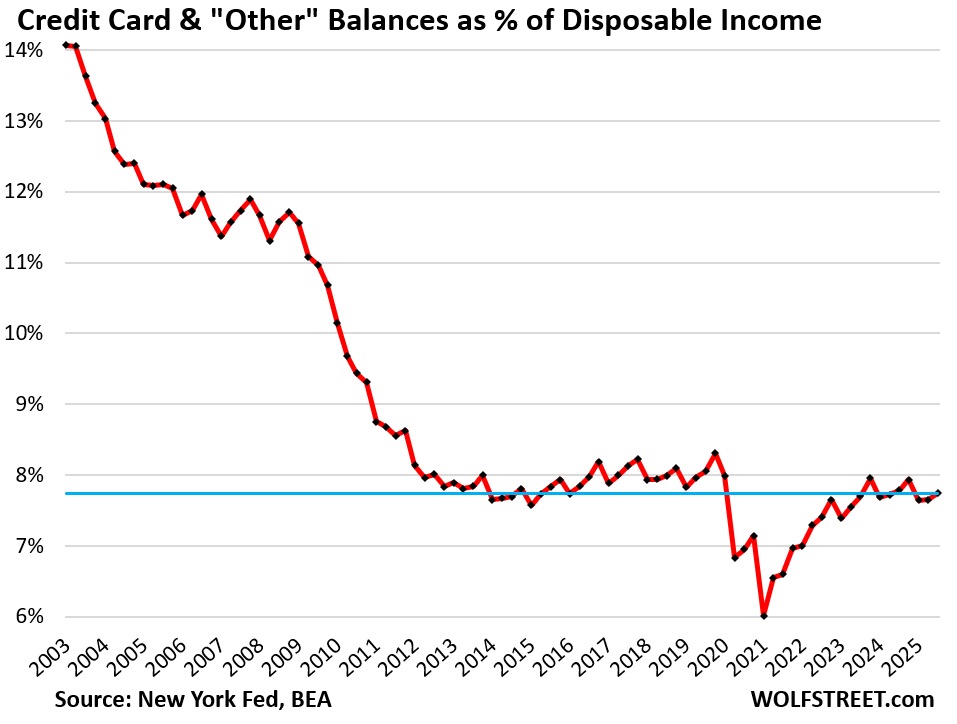
Combined, credit card balances (red in the chart above) and “other” consumer debt (blue above) rose year-over-year by $71 billion, or by 4.1%, to $1.78 trillion.
Debt-to-income ratios are classic measures of borrowers’ ability to deal with the burden of their debt. They track the amount of the debt outstanding, compared to income.
For consumers, a good income measure is disposable income, released by the Bureau of Economic Analysis. It is household income from all sources except capital gains – so from wages and salaries, interest, dividends, rentals, farm income, small business income, transfer payments from the government, etc. – minus withholding and estimated taxes. Disposable income is essentially what consumers have available to spend on goods and services, and to service their debts.
Due to the government shutdown, the BEA has not yet released disposable income for September. So I used the data for July and August and estimated September based on average growth year-to-date.
The ratio of credit card and other consumer loan balances to disposable income inched down year-over-year to 7.7%, as disposable income rose slightly faster (+4.7% year-over-year) than the combined balances of credit cards and “other” consumer loans (+4.1%).
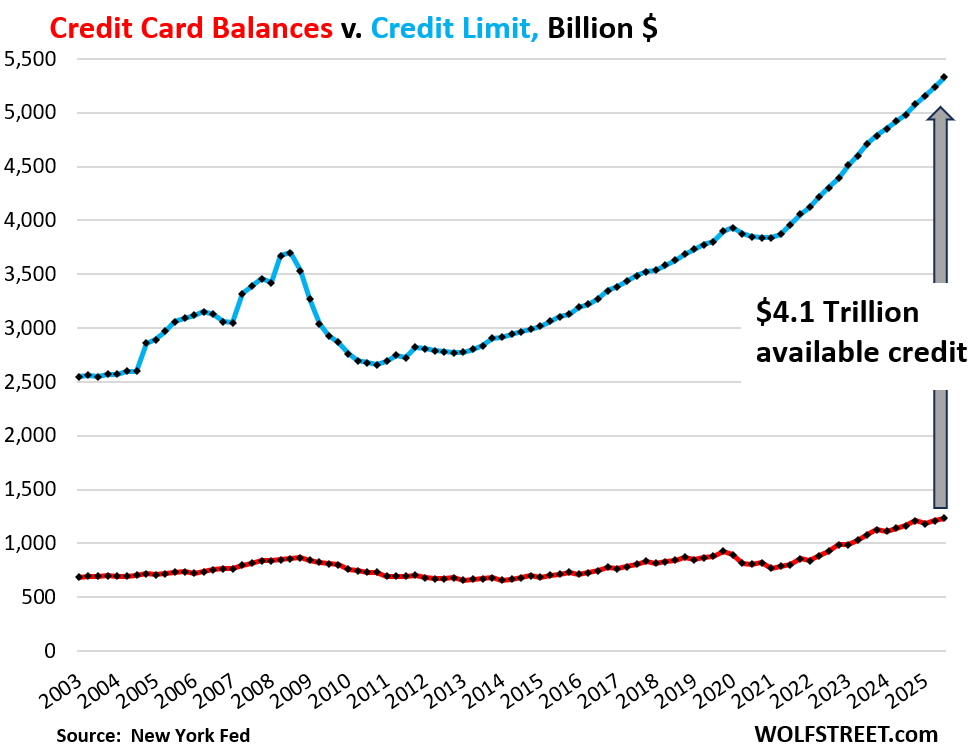
Credit Limits & Available Credit.
Swipe fees are a profit center for banks. Those are the percentage fees that banks collect each time one of their cards is used for a purchase. So banks are trying aggressively to get people to set up new credit card accounts, and they incentivize consumers to use those cards by kicking back 1% or 2% or more (cash back, loyalty points, miles, etc.) of the amounts spent on the card.
They also raised credit limits of existing accounts, and the aggregate credit limit (blue in the chart below), now at $5.3 trillion, has grown far faster than outstanding balances (red).
And thereby the total available unused credit rose to a record $4.1 trillion (gray arrow).
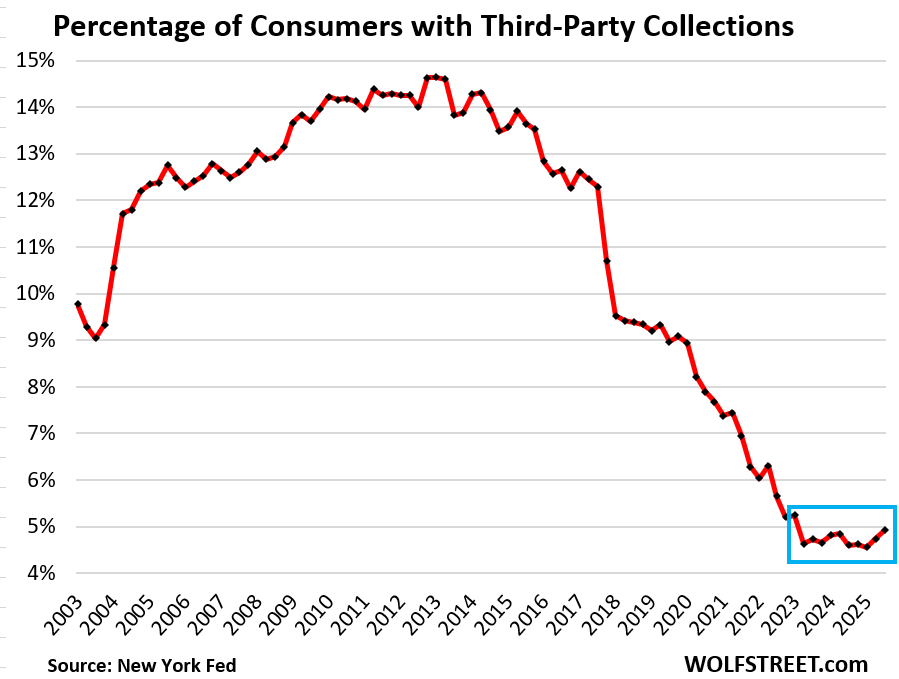
Third-party collections.
The percentage of consumers with third-party collections – where defaulted credit card & other credit balances can end up – remains at historic lows, having dropped from over 14% a decade ago, to 4.9% in Q3.
A third-party collection entry is made into a consumer’s credit history when the lender reports to the credit bureaus, such as Equifax, that it sold the delinquent loan, such as credit card debt, to a collection agency for cents on the dollar. The New York Fed obtained this data on third-party collections in anonymized form through its partnership with Equifax.
This rounds off my four-part quarterly analysis of consumer debt and credit. And in case you missed the reports on auto loans, mortgage and HELOC debts, and overall consumer debt, including student loans and bankruptcies:
Enjoy reading WOLF STREET and want to support it? You can donate. I appreciate it immensely. Click on the mug to find out how:

![]()
Thanks Wolf for the interesting and beautifully presented data as always. So if I look at the other 3 parts of the series, I see:
* Household debt (and mortgage debt as a subset) as % of income best in 20 years
* Auto and student loan debt not fantastic but not terrible
* Delinquencies, foreclosures, collections etc also look great
So it seems like the median consumer is doing perfectly fine. Why is sentiment so poor then? Are people still angry about inflation even though it’s been sub-4% for 2 years?
It also makes me disappointed in all the recession fear-mongering that happens on the wider internet. Don’t see any case for it, at least with these charts.
“Why is sentiment so poor then? Are people still angry about inflation even though it’s been sub-4% for 2 years?”
Yes. Americans hate, hate, hate inflation and high prices. We’ve had lots of inflation ( = “rate of change”) in 2021 and 2022, and prices rose to very high levels ( = “price levels”), and it pissed people off, and then prices continued to rise from those already high levels, but at a slower pace. Even smaller and less frequent price increases (rate of change) on top of high prices (price levels) piss everyone off, including me.
But consumers keep buying and keep paying those prices, which is why prices keep going up. “Pissed off” for Americans doesn’t mean “curtail spending.” Americans don’t cut spending until they have to, and now they don’t have to; they’re employed and making money and have gotten the biggest raises in 40 years.
My guess is the ‘have nots’ are let’s say 25% of the population. That is still 70 million people making a lot of noise on social media. Then you have the ‘haves’ that are happy to piggyback off the misery of the less fortunate to create social media content and click bait. That is a lot of negative sentiment floating around. I could be completely wrong.
I think you hit the proverbial nail on the head.
I would say the “have nots” are more like 85% approaching 90%. Only the top 10% are doing very well. More of the middle class are moving down into the “have nots”. In addition, these charts conceal the rot and decay that is happening in American society on the ground. I see it every day here even in the nice suburb where I live here 1 mile outside of the DC Swamp. The anecdotal evidence speaks for itself and would take several pages to elaborate. Some don’t like to here these kind of observations but I trust my own eyes before I believe the constant government data bull s$it that is parroted on the main street media that everything is great and getting better.
Swamp creature. That is BS. And not intellectually honest. Anecdotal evidence is a horrible way to perceive things.
lots of middle class soon to be lower class thanks to AI
just ask the 50,000+ programmers, professionals who now or soon will walk unemployment line
they aren’t going to find gainful employment at salary they become accustom to
maybe 1/2 if lucky
remember this from 20 years ago
It’s not that simple. My tech guy uses AI, and in a couple of hours he fixed an issue (which had caused my site to crash) by having AI pinpoint the problem and write the replacement code that would have taken many hours otherwise. He has become vastly more productive thanks to AI. And it saved me a lot of money, time, and trouble.
No one lost a job in this deal. And it took a human to work with AI to get this done.
Eric 86:
Antidotal evidence is actually very useful for learning, especially when used in conjunction with empirical evidence.
Anecdotes are easy to understand, which is why people like them, especially cherry-picked anecdotes that confirm your narrative, but they misinform you, if you want to look at the overall economy. They’re totally useless, worse than useless, If you want to look at the overall economy, they tell your absolutely zero about the overall economy, and they misinform you (which is why they’re worse than useless).
I go by the survey that asks about the direction of the country. About 60 to 70 percent say it’s going in the wrong direction no matter who is president. So I would say the “haves” are around 30 percent. No one at the 50th percentile feels like they’re doing well, unfortunately
I think another part of the reason is that people feel like their salary increases are “earned” (whether through promotion, seniority, whatever), so, if prices have gone up by 30%, and their salaries have gone up by 35%, they can’t buy THAT much more than they used to be able to, which means they aren’t getting enough more for that earned extra salary.
It’s a psychological thing.
Wolf:
Not trying to confirm narratives or speak on the overall economy as you do. The point I was trying to make I guess, is that observation of the goings on of your personal situation in your particular area, is helpful in making decisions for a person’s situation. I may have used the term anecdotal incorrectly I suppose.
I drink a lot of coffee. My $5 bag of coffee now costs me $9.
Don’t even get me started on insurance.
I’m really pissed off.
ditto
and we just got nice $2k increase thanks to school budget override
just $100 per $100k
I have several rentals and all have skyrocketed – insurance and property taxes
but not rents
of course we all know real problem
UNCONTROLLABLE govt debt
exponential now
making fiat $dollar worth less and less
Credit is harder to get, so delinquent borrowers are fewer. Drunken sailors have stopped drinking.
Ed,
That is a factor too rarely or weakly considered/incorporated.
Lenders have a lot of levers with which they can try to fix things or “adjust” reported results – for quite a while.
But not forever.
Stopping the inflow of risky borrowers is one lever.
Moving from “market to market” to “mark to book” is another.
There are a ton more.
Lender “reality” can be messaged for quite a while.
But not forever.
“They’re making record amounts, their balance sheet is in good shape, 65% own their own homes,..”
Probably worth mentioning that of those with mortgages 60% have a rate of 4% or lower….with $35 T in home equity, one would expect foreclosures to remain low for some time
Exactly. No one is going to give up a 3% or 4% mortgage. They’re going to make payments come hell or high water.
“with $35 T in home equity”
Broadly speaking…okay.
*But*
That $35T in home “equity” is based off of *today’s crazy overvaluations* – the $450k “median value” house that was $225k in 2019 or $150k in 2002.
As those crazed over-valuations evaporate…so does a lot of that $35T in home “equity”.
It is the exact same dynamic that occurs with every “healthy” corporation that implodes into bankruptcy “suddenly.”
60 days prior – $20 billion in “assets”, $15 billion in liabilities = “everything’s perfectly fine”.
Date of bankruptcy – One $10 billion writeoff later…$10 billion in assets, $15 billion in liabilities. Result, bankruptcy.
In practice, many (too many) “asset” valuations are theoretical…based upon spreadsheet assumptions/projections that can easily turn out to be wrong/lies.
But the liabilities?
The liabilities are very, very real (Lenders: “I want my f*cking money back”)
The “assets” can evaporate.
The liabilities rarely do.
It’s not fear mongering. Its wishful thinking. Whatever the inflation rate is proposed to be, home prices where I live doubled, and I’m currently a forever renter. Bring on the crash whenever. The bigger the better.
Burn it all down.
Why the poor sentiment?
It’s the high asset prices that bother a lot of people. Many renters have been locked out of home ownership maybe for a decade or more. Record stock prices means today’s savers cannot get a decent return on their savings going forward.
The runaway inflation is salt in the wound.
Wall street used NVDA as a lever to breach Oct 10 and Sept 17 lows. Thereafter they sprang above. Option #1: a short covering. Option #2: 7K+ in Jan/Feb, before a major correction in Q1 and Q2 2026. Option #3: IWM is backing up, before rising for years.
I observed IWM is very correlated to “junk” bonds. You can think of IWM as junk bonds of infinite duration. The spread (on interest rate) between junk and treasuries is already historically low. So for IWM to rise for years, the interest on 10-year would need to start going back towards 1-2% (which is entirely possible, I suppose). Option #4: it all crashes; we blame 10% unemployment on AI.
Thing is everyone knows this is a bubble it’s just when. We now have too big to fail vibes, .com bubble vibes, and enron vibes.
Nvda goes down it takes the market and the economy with it. Circular investments to entities you can sell to. And valuations based on hype. What could go wrong?
Could run another 2 years though before crashing, hard to say 🤷
“The market can stay irrational longer than you can stay solvent.”
The “when” is when the last generals roll over – Google, JPMorgan Chase, Eli Lilly. Not too long now.
Tthere’s always going to be the ‘have nots’ That’s just the reality on the lowest rung. Anybody mentioning they are taking anti-obesity drugs these days? Things like that.
buy a home, upkeep and all that, as the value of your home increases, you pay more taxes, school system, etc., then you go to sell it? You’re slammed with capital gains taxes..
Try to enjoy your stay, peaceful, appreciative, and humble.
The capitalist system is built on competition. There will always be winners and losers.
…I suppose the historically-elusive balance is to keep the balance of ‘losers’ low enough that the perceived ‘winners’ balance will adequately-supply the soldiery necessary to protect the BIG ‘winners’ economic share of a society. (…beware the irrationality and actions of any group that really believes it has nothing left to lose…).
may we all find a better day.
“beware the irrationality and actions of any group that really believes it has nothing left to lose”.
Hmmmm,a lot will also feel that way and while actions they take may be ugly nothing irrational about them/the person who feels nothing much left to lose and everything to gain does not necessarily give up rational thinking.
Tis like getting old,while death or life imprisonment not goals they do lose a lot of deterrent power for many as they age.
Hi Dustoff….I have noticed that the “private VA” related ads on TV are becoming a pretty big biz lately…at least measured by ad spend….VERY patriotic…..maybe will be bigger than the actual VA some day?
“You break it you fix it”….paraphrasing Colin Powell….a famous prostitute.
VA should have been made FULL part of the military long ago.
Think I mentioned when enrolling in 2010 for Auto Shop classes at JC, I found out first in line sign up for classes was only for presently disabled vets or post 2004 vets. By ETS date I think.
Won’t go into many thoughts that generates in my head….and wonder if it is still same?
A sea-change of sorts?
James – noted, should have said ‘irrationality’ (marks added), to indicate the likely observation by those not of the ‘losing’-class (…ref: the “…it’s HAPPENING, Reg, it’s HAPPENING!!!…” scene from the Python’s ‘Life of Brian’). -best.
Greetings, NBay! Don’t watch much commercial tv anymore, but given the relentless push from some quarters to spin off, privatize, and/or ngo/’charity’-parasitize the VA’s infrastructure and funding, I’m not surprised at the observation (…glad to say, though, that SFVA has, over the years, and still is, doing right by me). Sadly, looking back to the days of the post-WWI ‘Bonus Army’ (let alone post-Korea/VietNam), ‘Murica’s memory of its vets often seems selective, and fickle…hope the back’s been/is sparing you, lately-all best!
I finally encountered a price increase that will change my consumer behavior. Over the past 3 or so years, my local bakery has steadily raised prices. Over that time, my shopping frequency has decreased.
Yesterday I stopped in for my favorite sticky bun and saw they’d raised the price yet again, to about 2x what it was 3 years ago. I sighed, knowing it would be the last time I would buy one until I get a significant raise in income.
Or, you could look up a recipe on the interwebs and make 12 (for the price of one) at home for the holidays. It’s not rocket surgery. The only risk here is gaining weight.
+1
The baking of bread is an art and science.
The only thing to lose is time, and it seems to be precious to the income earners (as most income is derived through time spent).
Even when done right, it seems to take me 3-4 hours to make a batch of cinnamon rolls.
Also why the retail price is so much higher: inflation is in services. Baking is a time consuming service to provide.
“banks are trying aggressively to get people to set up new credit card accounts, and they incentivize consumers to use those cards…”
Capital One recently gave me a $50 statement credit for spending >$50 on walmart dot com. I’m genuinely curious how Capital One stands to benefit from this.
The merchants generally pay for those, not the credit card companies
ShortTLT,
My guess is in general they assume people will create lots of debt and then not timely pay it off. I open a new card each year, take the $200-300 for spending $1,000 or so, and then make minimal payments for 12-15 months with 0% APR. This only nets me an extra $600-800 a year but that is worth the effort. Hurts my credit rating for a bit but doesn’t matter since you only need a good score when borrowing. The banks do okay as I still spend 10-20K on the card, they just don’t make any interest off me.
I’m not quite as ambitions with new card promos because my credit is frozen. That said I exploit my current cards’ points systems as much as possible – including never carrying a balance and using this promo for something I needed to buy anyways.
MW: Why trouble for the biggest foreign buyer of US debt, Japan, could ripple through America’s bond market
A little anecdotal experience. I was drafted in January, 1968. In close succession I went from Basic Training to Infantry AIT followed by Drill Corporal School, Drill Sergeant School, 5th Army NCO Academy, infantry OCS, Infantry School Instructor Training Course, MACV MAT Training Program before ending up as an advisor on a 4-man team in a Montagnard Boun.
In every case in every platoon we were all paid the same amount in cash at the beginning of the month. And invariably in every case by the end of the month the outcome was the same. Two or three guys would have more money than they started with, the majority would be broke and a handful of folks would not only be insolvent, they’d owe the ‘rich’ guys money.
Every school, every platoon, every month. Without exception until OCS. And OCS was an exception only because we started with 220 and just 60 graduated and the broke-at-the end-of-the-month guys were the first to go.
OBC – …great verity in your anecdotal obs.,illustrating again the tragedy and promise of the median in human mentality…
may we all find a better day.
You can’t save everyone. He who defends everything, defends nothing. Some need to learn that very quickly.
i think consumers have become better shoppers. Their basket of goods and services has shifted. That’s how they’ve managed their balances among rising prices.
Most recent University of Michigan survey still showing lots of sour moods among the US consumers.
Trying to reconcile the hard data here on these charts from the soft data leads me to wonder how much people feel they’re just making money at work and then paying off credit cards for what they bought last month just fine but not building wealth or able to climb the middle class ladder.
Life on the hamster wheel….
The UofM consumer survey is a survey of political affiliation — that’s really all it is in effect. Look at the results split by Democrat-leaning and Republican-leaning respondents. When Trump won, they flipped sides, from Democrat-leaning folks feeling good about the economy to suddenly feeling sour, and Republican-leaning folks from feeling sour to suddenly feeling good.
And it seems to oversample Democrat-leaning folks.
It’s the most worthless of all consumer surveys, useful only for political studies. I have no idea why anyone still pays attention to it.
Good to know; any soft data surveys on sentiment that are less politically driven or are we too far gone in the US with red and blue pom-poms ruling our collective mood?
The New York Fed has a survey about consumer expectations on future inflation, the job market, home prices, access to credit, etc. So it asks about some very specific things, and it’s pretty good in assessing how consumers feel about these things. Obviously, they’re not forecasts, as consumers have no idea what it will be like a year two from now, nor does anyone else. No one should use those surveys as forecasts.
In terms of consumer spending, it has been proven over and over again, that sentiment has nothing to do with it. Even the surveys of how much consumers are going to spend for the holidays have been wrong most of the time. Human beings don’t operate on that basis.
But what does have correlation with consumer spending is high unemployment and big sustained stock market drawdowns that last years. Both of them have triggered recessions because consumers backed off.
How to know if the people most likely to go delinquent on credit cards have switched to BNPL purchases?
We know because BNPL is included in the article. All you have to do is read the article.See blue line in the third chart. Despite all the hype, it doesn’t make a dent because it’s tiny compared to the rest of the payments industry: $6-trillion-dollar-a-year credit card payments, $5-trillion-a-year debit card payments, still lots of checks and cash, and lots of big payments made via ACH. BNPL, despite all the clickbait hype, is just a few small startup companies subsidizing merchandisers’ installment loans.
Curious…where does the BNPL info come from. I thought it wasn’t tracked via the Fed since its not a “bank product” so not in its qtrly consumer debt numbers
An aside from other articles…great info, thank you!
“They’re making record amounts, their balance sheet is in good shape, 65% own their own homes,..”
Probably worth mentioning that of those with mortgages 60% have a rate of 4% or lower….with $35 T in home equity, one would expect foreclosures to remain low for some time
There are several data sources in this article, as specified.
#1 chart, credit card delinquencies: The data for the red line is from the Federal Reserve Board of Governors, which is a US agency, and bank regulator. It gets that delinquency data from the bank balance sheet data that banks have to submit monthly. The data for the blue line I got directly from Equifax.
#2 chart, prime rated credit card delinquencies is Fitch data.
#3 chart, credit card balances and “other” credit balances, including BNPL: data comes from the NY Fed, which gets this data through its partnership with Equifax, and BNPLs are reported to Equifax. The NY Fed is a private organization and is not a bank regulator.
Yes and third party collections are increasing while credit card delinquency is decreasing. I guess I’m wrong in thinking it’s the other consumer loans that have the worse repayment rates and are taking the hit. And might be ripe for increasing losses
“third party collections are increasing” …. ticked up from historic most deepest lowest ever and remain at historic lows, you goofball.
“I guess I’m wrong in thinking…” you nailed it, you’re wrong for both reasons you mentioned: 1. Third-party collections remain at historic lows; and 2. for tying delinquencies and third-party collections together. In general, third-party collections occur after banks completely write off the debt and sell it for cents on the dollar. This happens a long time after an account goes delinquent. Before they sell it, they will try for many months to collect from the borrower and make a deal with them to get at least part of it, which would be a lot more than a collection agency will pay for the account in a bulk sale.
I’ll just repost the same chart from the article:
Anecdotal comment: on my little corner of the internet (website admin day job), BNPL has always been and continues to be a tiny % of our overall transaction volume.
Hi Wolf, long time fan.
I’ve been thinking about your point that credit card balances are now largely a measure of ‘spending’ (transactors) rather than borrowing. While true for the top half, I suspect this heavy volume of ‘transactor’ activity is mathematically drowning out the distress signals from the bottom half in these aggregate charts.
The clue is actually in your own data above: You note that Prime delinquency is at a near-record low of 0.91%, yet the Aggregate is hovering around 3%. For the average to be that high when the majority of volume (Prime) is effectively zero, the delinquency rate for the bottom tier must be catastrophic—likely closer to 15-20% to skew the weighted average that much.
If we look outside of bankcards to Subprime Auto Loans (where there are no ‘transactors’, only borrowers), the story is much clearer. Fitch and TransUnion data for late 2025 show subprime auto delinquencies (60+ days) have pushed past 6%—literally higher than the peak of the Great Financial Crisis in 2009.
I suspect if you ran this analysis using Zip Code Income Stratification (isolating the bottom quartile) rather than the national aggregate, the graph wouldn’t look like a ‘frying pan’—it would look like a hockey stick.
The ‘Average’ American is doing fine, but that’s only because the top 25% are doing so well that they are statistically masking the recession currently hitting the bottom 25%.
1. Subprime does NOT mean “low income” or “bottom 50%.” That is just stupid bullshit. Subprime means “BAD CREDIT” — a history of not making payments and too much debt — and you have to have higher incomes to qualify for bigger loans. It’s the higher-income subprime borrowers that move the needle on subprime.
2. Low-income people have to make do with debit cards because the don’t qualify for credit cards.
3. I get really tired of this twisted social justice warrior BS that gets twisted into absurdity. Not wasting my time on it anymore. If you want to know how it works in auto subprime, and who is at fault, and how TINY it is, and that it’s not low-income people, but people with bad credit, read this instead of posting BS here:
https://wolfstreet.com/2025/11/10/how-americans-handled-their-auto-loans-leases-in-q3-2025-subprime-prime-delinquency-rates-balances-and-burden/
https://wolfstreet.com/2025/10/17/ai-powered-tricolor-and-its-mushroom-cloud-of-fraud-allegations-are-a-sign-greedy-lenders-closed-their-eyes-for-years-not-a-sign-consumers-are-cracking-or-whatever/
Good point, the deliquincies are a SMALL subset of a small subset of borrowers
You have to be very careful with credit cards as they can charge as high as 33.9% interest and have high monthly payments.This is why even small savings habits are very important.I started at 16 saving $100 a month and now at 19 am saving $500 a month.
I have only one credit card and use it very little only a few times every quarter.It just seems to me that the banks and their central bank buddies lowered interest rates to discourage savings and increase debt too much in our society.
I generally live day to day with Cash. It’s just a budgeting thing. But for everything other than day to day I try to use my CC to gain the points and always pay off the balance every month. It’s like Wolf points out – its a payment method.
Over the last couple of years, more and more vendors – car repair shops, the plumber and electrician all sorts of other services have stopped accepting card payments unless I’m willing to pay an extra 3%.
Not sure it means anything except that the payments system in the US is less efficient that it could be and it may have reached the limits of what it can extract.
I am also cash day to day and only use a debit card to order online.
I have not had a loan in over 30 years or a credit card,last card was when got home loan,got rid of card immediately.
In credit rating reports even though utilities and stuff covered on time I am probably considered a worse then bad credit risk as I do not engage that system any longer in a daily sense for most part.
I guess the line of credit though no card ect. with lumber company might help as paid off monthly if not sooner.
And the calls for rate cuts to help MAIN STREET ….ha
to pump asset prices, keep stocks up into year end
There was an article today on CNN about how Nvidia’s earnings “proved” that there is no AI bubble.
It would be like in a housing bubble, where housing prices are skyrocketing because people are overextending themselves or speculating, using the fact that home builders and materials supplies are doing well as “proof” that there is no housing bubble.
It’s nonsense. Everyone knows that BigTech and Nvidia will make out like bandits from this bubble.
The real issue doesn’t become apparent until the AI spending stops, or at least slows.
Low income consumers have already adjusted their spending some time ago. This can be seen at the POS. IDK why people keep talking like they know. It’s mainly middle incomes people whining because they can’t frivolously without consequences.
Hey Everyone!
Wolf … thanks for the interesting post and comment replies.
Commenters … thanks for the interesting comment.
This is a great website and as a retiree I’m glad it’s still “free to browse”.
You may have covered this previously, but what happened in 2017 that caused 3rd party collections to plummet?
Wolf, thank you, super informative as always. One data point that everyone continues to point to as ‘everything is alright’ but which is inconsistent with sentiment and basic math (e.g., median home price, median auto price, card balances, etc) is the debt service to income ratio which is very low at ~12%. As you know this figure is effectively income-weighted (sum of all debt service / sum of all incomes) and so it skews based on higher income which have low DTI (top 5% of earners ~20 – 25% of income) . I have plenty of friends (mostly late 20s – mid 30s) who are doing okay today and will continue to be chug along as long as employed, but they are highly levered – first mortgage, auto loan / lease for $50k truck, student loans and sometimes home improvement or HELOC to fund that leaking roof because haven’t been able to save. I understand it’s common for consumers of this age group to be more highly levered, but I I am also coming across older folks with similar situations (e.g., 60+ y/o Doctor last week who asked me if his 50% debt service to income is average – pricey house, always a new car) – I am concerned around the potential of hidden leverage / higher debt service to income for the majority which is not reflected by the aggregate skewed by the high income minority – driven by higher prices (e.g., autos) and increased availability of unsecured credit (e.g., home improvement loans). Would be awesome to get your thoughts and any data points you have come across that are a more reliable measure of debt service to income for the majority and not the entire population.
Go to a social justice warrior website. Because it makes zero difference for the economy overall who does the spending or borrowing. Low-income people are always hurting. Which is why it’s a good idea to try to not be low-income, because it’s full of painful compromises. But that has zero relevance here. Low-income people don’t have a lot of debt because they cannot get credit. Some people with good incomes borrow a lot, and that’s always true — the subprime rated young dentist is a classic example — and it has zero relevance for the overall economy.
You can look at your friends and shake your head. But you cannot extrapolate from your friends to the overall economy. That’s just dumb.
Social justice warrior websites are not my thing, but thank you for the suggestion. The note was not a social justice crusade – it was a very specific question: what is the level of household leverage / debt service to income for the majority of households, which is not captured by the aggregate statistic, which is skewed by the high income minority. It only takes a half a brain to see that the 11-12% debt service to income is a bullshit figure and not representative of your typical household. I want to understand leverage at the typical household (not the income-weighted ‘average’) so that I can take a view on consumer debt default sensitivity to unemployment.
Read my comment. It says:
“Low-income people don’t have a lot of debt because they cannot get credit.
It’s the high-income households that have $1.5 million mortgages and $100,000 car loans that drive up aggregate household leverage.
You said: “I want to understand leverage at the typical household”
There is no “typical” household. But there is a median household and an average household (= aggregate figures).
40% of homeowners don’t have a mortgage at all;
Another 30% of homeowners have only small amounts of mortgage debts because they bought the homes years ago at lower prices and have made lots of payments.
Median = 50% line (the value in the middle) = half have more debt and half have less debt. That 50% line = 40% with zero mortgage debt + 10% with low mortgage debt. So the median mortgage debt is very low.
It’s the recent buyers with high incomes who bought expensive homes that have the most mortgage debt, DUH.
So read this for mortgages, delinquencies, and foreclosures:
https://wolfstreet.com/2025/11/07/here-come-the-helocs-mortgages-housing-debt-to-income-ratio-serious-delinquencies-and-foreclosures-in-q3-2025/
And read this for auto loans — make you you read the part where is says that 63% of used-vehicle buyers pay cash for their vehicles and don’t finance at all.
https://wolfstreet.com/2025/11/10/how-americans-handled-their-auto-loans-leases-in-q3-2025-subprime-prime-delinquency-rates-balances-and-burden/
These are great discussions! I think both things can be true: a) as an aggregate the country overall got a big raise so the increased prices and spending are still within portion, and b) most of this raise went to the top half (or insert your percentage here), and the rest of us are hurting in a real way because the grocery store doesn’t change the price based on if you got a raise or not.
So it could be a problem of inequality. I’d love to see some breakdown by economic class in your amazing data visualization!
Go to a social justice warrior website. Because it makes zero difference for the economy overall who does the spending or borrowing. Low-income people are always hurting. Which is why it’s a good idea to try to not be low-income, because it’s full of painful compromises. But that has zero relevance here. Low-income people don’t have a lot of debt because they cannot get credit. Some people with good incomes borrow a lot, and that’s always true — the subprime rated young dentist is a classic example — and it has zero relevance for the overall economy.
Nice charts!. Credit cards are way, way down the list of bergs headed for this titanic.
People know it too, thus the sentiment.
Related question: How much do credit card companies receive from swipe fees? Back of the envelope calculation with some simplification: 1.2 trillion balance. Assume it is all paid off every 30 days and the swipe fee is 1%. This works out to 12 billion/month. Using 250 million US adults all using credit cards this works out to $43.67/adult each month or $523/adult each year. That used to be one month’s car payment. This is a bit higher than I expected. Am I missing something?