ADP Employment Report: +42,000 Jobs in October; wages +4.5% for “Job Stayers” and +6.7% for “Job Changers.”
By Wolf Richter for WOLF STREET.
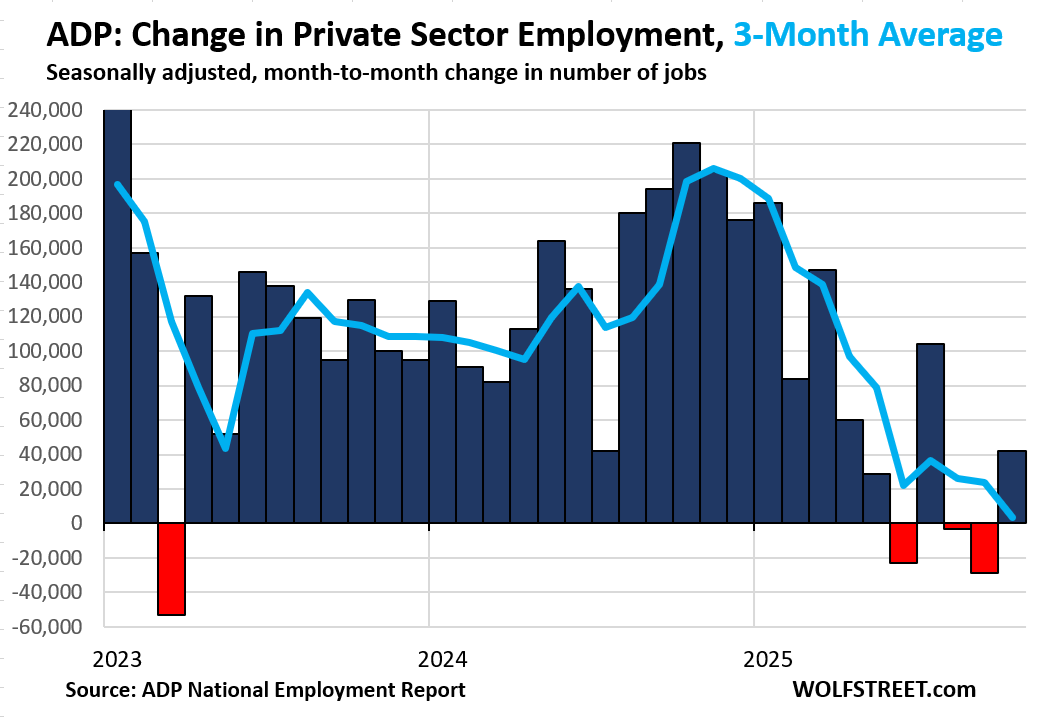
According to payroll processing firm ADP, the private sector created 42,000 jobs in October, after two months of declines.
But the two prior months, so employment in September and August, had gotten hammered by the massive annual adjustment for the 12-month period through March 2025, to benchmark ADP’s data to the Quarterly Census of Employment and Wages (QCEW) data released by the Bureau of Labor Statistics in September. These adjustments had nothing to do with employment in August and September, but with employment through March 2025.
The annual adjustment had turned the small growth in September of 11,000 into a job loss of 32,000 – which today was re-revised to -29,000. And it had turned the job growth in August of +54,000 into a job loss of -3,000.
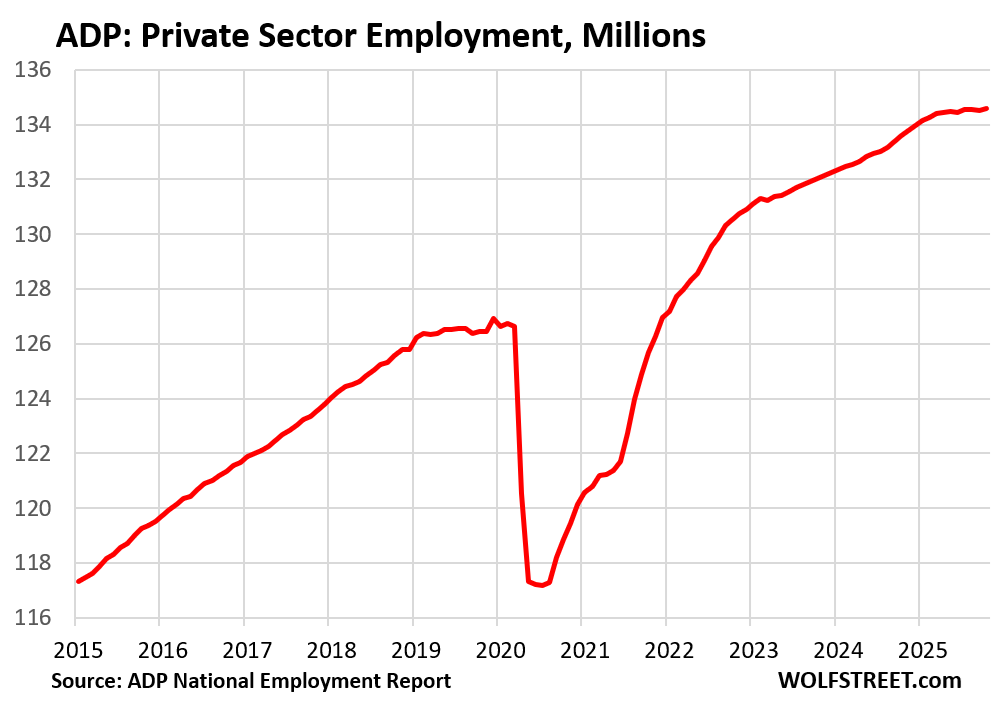
Total employment in the private sector rose to 134.57 million, up by 977,000 jobs from a year ago.
The chart of private-sector employment shows the trend: Job growth continued in 2025 but at a much slower pace than in prior years.
- Year-to-date 2025, jobs added: 597,000
- Same period in 2024, jobs added: 1.33 million.
Median wages increased year-over-year for:
- “Job Stayers”: +4.5%, roughly the same yoy increase for the seventh month in a row.
- “Job Changers”: +6.7%, same yoy increase as in the prior month, but less than the increases of 7.0% to 7.1% in the mid-year period.
The wage data from ADP is based on a subset of 14.8 million workers employed for at least 12 months, whose paychecks ADP processed.
Due to the government shutdown, the BLS will not release its employment report this Friday, and the ADP data here, plus unemployment insurance claims data released by the 50 states individually, and some private-sector tidbits are all we get for now in terms of payroll count and wages for October.
Enjoy reading WOLF STREET and want to support it? You can donate. I appreciate it immensely. Click on the mug to find out how:

![]()
More jobs, higher inflation. Combined with less access to federal government data, macro signals should point to no rate cut by the Fed in December. I know it’s fantasy to wish for a Fed backpedal and rate hike, but that is my Christmas wish.
Keep stocking the pantry.
209,and rotate/use older stock and replenish.
You can see the top of your closet,you need more hunting supplies.
I think it is important to track what type of jobs are being created and destroyed (like the birth-death number for the creation/closing of businesses).
Many on Wolf’s forum doubt AI, but it is my humble belief that AI in the next decade will advance to the point that securing and holding a job will be a major feat.
When we get the number of jobs in each category (once the government reopens), will may be able to draw some conclusions as to whether AI is impacting yet.
AI (Atrocious Idiocy) has nothing of value to offer to anyone at all.
Every single Waymo that drives around (there are more and more of them in a bunch of cities now) takes the jobs of 2-3 full-time drivers. The Waymos are amazingly good now. And they’re still just experimental prototype retrofitted vehicles. This technology is going to spread to everywhere. There are over 200,000 taxi/Uber drivers in the US. They need to find another job over the next few years. There are a bunch more other types of drivers, and their days are numbered too, though they have a little longer, it seems.
However, Waymo employs lots of people in tech and other areas, as do automakers that are also all over this tech. But drivers who lost their jobs might not be able to fill the roles at these companies. So there is going to be a lot of tech-driven hardship for some people.
Gee, with all this automation and AI maybe more Americans should be for throttling back on H1Bs for entry level tech jobs, and deporting and not letting in more non-skilled immigration for unskilled jobs that are going away?
I was skeptical of Waymo at first, but its a really great experience. I was tired of getting into dirty smelly cars operated by lazy people. Waymos are cleaned everyday. Bonus, no need tip!
“think it is important to track what type of jobs are being created and destroyed”
This is very important – something I’ve been saying for 2 years…
But we don’t need AI – the BLS gives a monthly running estimate broken down into 10-12 broad industry/occupation groups…and generates data for over 800 occupations every May or so (with an ugly lag of 12-16 months).
Scary spoiler? For 2+ years government subsidized jobs (government and medical) have made up a very disproportionate pct of the new jobs added.
But government subsidized jobs very likely cannot bootstrap overall employment growth into existence long term – if taxing government paid/subsidized workers were some sort of perpetual motion machine for macro health, the USSR would have thrived and DC would have already created 5 times the number of phoney baloney jobs it has.
Keynesian perpetual motion aside, there has to be organic, private sector growth for the whole machine to, er…work.
Cas127
1. “For 2+ years government subsidized jobs (government and medical) have made up a very disproportionate pct of the new jobs added.”
1a. Government: Jobs at the federal government and at state governments have plunged in 2025. I discussed this a bunch of times, including charts, all you have to do is read it. So READ IT NOW, including:
https://wolfstreet.com/2025/10/04/jobs-report-to-get-hit-by-100000-federal-government-deferred-resignations-on-top-of-the-jobs-already-shed-but-ice-is-hiring/
https://wolfstreet.com/2025/09/05/my-thoughts-about-that-august-jobs-report/
1b. “government subsidized jobs” such as “Medical”: Sorry, jobs in “medical” (ADP category is “Education and health services”) is essentially flat YoY.
But:
— construction: +1.8% yoy
— financial activities: +1.9% yoy
— leisure & hospitality: +2.4% yoy
— natural resources & mining (oil& gas drilling): +2.7% yoy
2. “the BLS gives a monthly running estimate broken down into 10-12 broad industry/occupation groups…”
Yes, and it’s right here on this site, including charts for each category, all you have to do is read it, but you REFUSE to read the articles here. So READ THIS NOW:
https://wolfstreet.com/2025/07/03/beneath-the-surface-of-the-employment-report-how-jobs-evolved-by-industry-over-time-winners-losers/
Lol. Who needs facts when you have beliefs?
Btw, it is true that “private education and health services” has increased as percentage of all jobs, but the increase has been very slow and (mostly) steady. It has taken 60 years for it to increase from 6% in 1965 to 17% today.
The biggest increases came during the last 3 recessions (1990, 2000, and 2008), because demand for education and health care doesn’t stop during recessions.
You also have to remember that technology can reduce the credentials/skills needed to do a task.
Way,o is Geofenced in cities where they have mapped all the streets. I believe when Tesla finally solves FSD, which is not too far away, their Robotaxis can drive anyware..
Yesterday on my way to work in downtown San Jose in my non-FSD vehicle, I saw a Tesla model 3 that had attempted to make a left turn across the center island of Almaden Blvd and knocked over two large concrete bollards. Apparently FSD is just on the other side of those bollards. But no cats were harmed.
“I saw a Tesla model 3 that had attempted to make a left turn across the center island of Almaden Blvd and knocked over two large concrete bollards.”
And think of all the lost dollars Antifa is wasting on protests and riots when they could just plop some bollards here and there and trash Elon!
Tesla’s reliance on cameras alone is a fatal shortcoming.
Human’s can cope with some poor-visibility situations because they have a mental model of reality. A machine-learning system trained on camera-captured images does not — it relies on interpreting the images in terms of its training set.
For situations that occur with high enough frequency, the training set will be large enough for proper decision-making. But for rare situations that are unlikely to be in the training set — situations where a mental model of reality is essential for proper interpretation of the visual input, decision-making is likely to fail. Google “Huang Tesla crash”.
Musk fan-boys love to post on X.com how their Tesla drove them on multi-hundred mile trips in FSD with no problem.
Depending on Tesla FSD is like camping or building a home near a river like the Guadalupe River. Just because it doesn’t drown you on typical rainy days doesn’t make it safe.
> Musk fan-boys love to post on X.com how their Tesla drove them on multi-hundred mile trips in FSD with no problem.
Guaranteed paid posts. Nothing wrong with advertising.
The Philips Curve has been denigrated.
https://www.stlouisfed.org/open-vault/2020/january/what-is-phillips-curve-why-flattened
“The Great Demographic Reversal” by Charles Goodhart and Manoj Pradhan explores how demographic changes will reshape global economies, leading to rising inflation and decreasing inequality.”
These reports are published before they demonstrate accuracy. And the FED is basing its rate decisions on bad data, let alone outdated relationships.
1. The Fed is not using the Phillips curve (if it ever did). The Phillips Curve is simplistic, and even adherents use more complex models.
2. The Y-axis of the Phillips curve is “wage inflation” not “consumer price inflation.” Big difference. Meaning, low unemployment, including shortages in the labor pool, push up wages = wage inflation (Y-axis); which is exactly what happened in 2020-2023. And now, unemployment is still relatively low, and so wages are still growing at a substantial pace, but not as fast as they did in 2022-2023.
On the other hand, higher unemployment slows wage increases (lower wage inflation).
3. The paper you linked was from January 2020, based on data through 2019, when people really started thinking that the Phillips curve had “flattened out” or that the relationship was dead entirely.
To quote from the article you linked:
”Let’s zoom in on Figure 1 above to look at recent years, starting in 2012. While the unemployment rate has declined to levels not seen in 50 years, inflation has remained low—even below the Fed’s 2% target for most of the period shown in the graph below.
And WOOOSH goes wage inflation in 2021-2022, and those high-flying theories of a flattened Phillips Curve got flattened out by a speeding Safeway truck loaded up with overpriced food.
The Fed seems to base their interest rate decisions pretty heavily on the Taylor rule, not the Philips curve.