The long-defaulted federal student loans were pulled out of the forbearance closet.
By Wolf Richter for WOLF STREET.
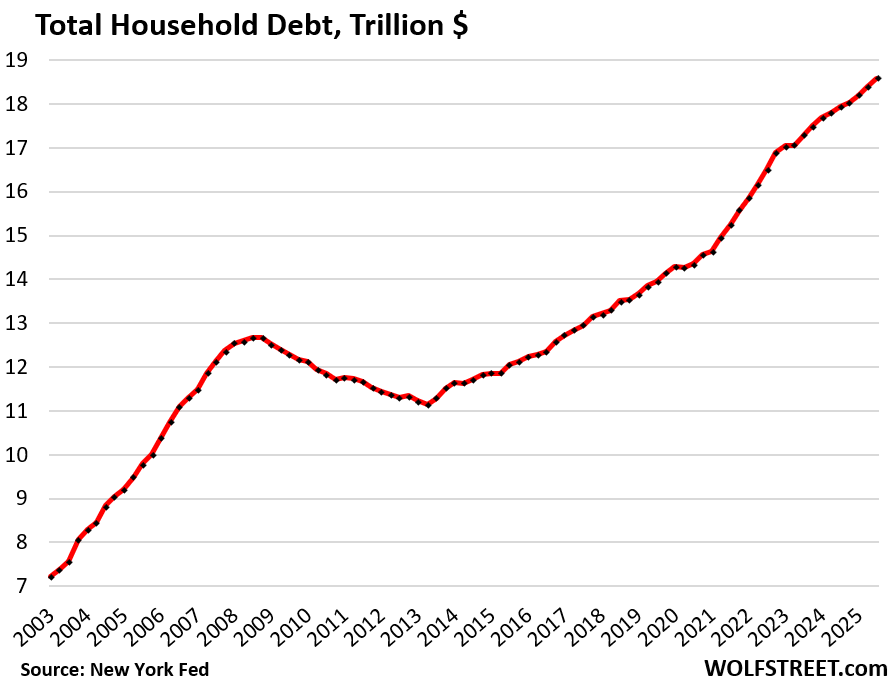
Total household debt outstanding in Q3 rose by 1.1%, or by $197 billion, from Q2, to $18.6 trillion, according to the Household Debt and Credit Report from the New York Fed today. Year-over-year, household debt rose by 3.6%, or by $642 billion.
Household debt includes mortgages, HELOCs, auto loans, student loans, credit cards, and “other” revolving credit such as personal loans and BNPL loans. I will discuss these categories in separate articles over the next few days. Today, we’ll look at the overall debt, its burden, delinquencies, collections, foreclosures, and bankruptcies.
It’s not that households carry an ever-bigger debt burden; they’re not. It’s that the number of households has grown over the years, and that the income per household has grown on average over the years, and they have grown faster than household debt, and the burden of this debt has declined over the years.
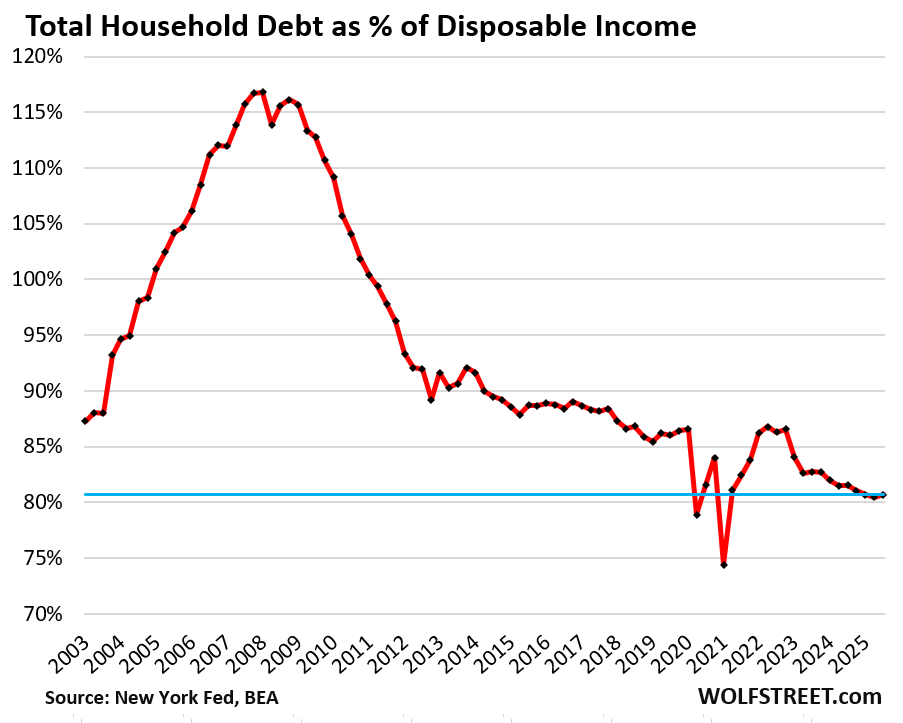
The burden of household debt: Debt-to-income ratio.
The debt-to-income ratio is a common way of evaluating the burden of a debt. With households, we can use the debt-to-disposable-income ratio.
Disposable income, released by the Bureau of Economic Analysis, is household income from all sources except capital gains, minus payroll taxes: So income from after-tax wages, plus income from interest, dividends, rentals, farm income, small business income, transfer payments from the government, etc. It’s essentially what consumers have available to spend and service their debts.
Due to the government shutdown, the BEA has not yet released disposable income for September. To get Q3 disposable income, we can use current data for July and August and estimate September based on average growth year-to-date.
The debt-to-disposable income ratio in Q3 was 80.7%, a hair higher than Q2, which had been the lowest in the data going back to 2003, except for two freak quarters during the stimulus era (Q1 2021 and Q2 2020).
Seen as an economic entity, American households are in good shape. They’re making record amounts, their balance sheet is in good shape, 65% own their own homes, over 60% hold equities, and they’re sitting on a record pile of interest-earning cash: $4.7 trillion in money market funds and $3.4 trillion in CDs that all generate interest income.
Our Drunken Sailors, as we lovingly and facetiously call consumers, have in fact become a fairly sober bunch, in terms of borrowing. They learned a lesson during the Great Recession, most of them. Not all of them.
Subprime-rated borrowers – a small subset of consumers – are always in trouble with high debt-to-income ratios, missed payments, and bad credit history, which is why they’re called subprime.
“Subprime” means bad credit, not “low income.” The high-income young dentist that got into it over their head is a classic example of high-income subprime. They’ll get it worked out and clean up their credit, but for a while they’re subprime. Credit problems are driven by this small subset of consumers.
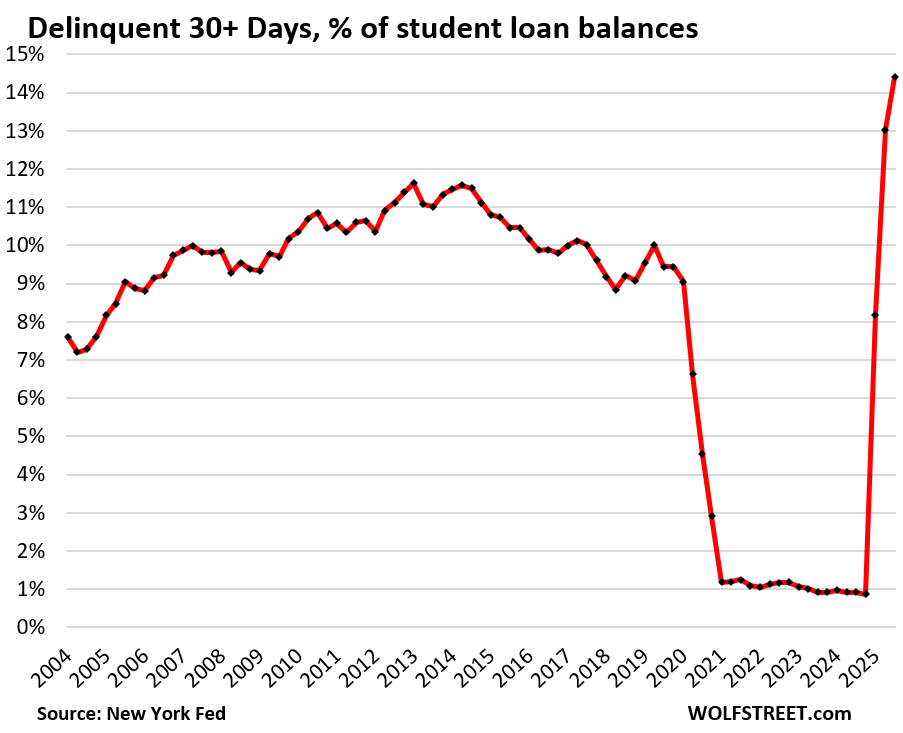
And student loan borrowers… In 2025, federal student loans that had been covered by the government’s forbearance policies since 2020 came out of forbearance, and those loans that had defaulted but hadn’t counted as defaulted suddenly started showing up on credit reports again, and delinquency rates exploded.
The 30-day delinquency rate spiked to 14.4% in Q3, the worst ever, up from around 1% during the nearly 5-year forbearance era, according to the NY Fed’s report today, based on Equifax data.
Of the $1.65 trillion in student loans outstanding, $238 billion were 30-plus days delinquent in Q3.
Students should have been taught early on in college that delinquent loans mess up credit scores, limit the ability to borrow, and increase the interest rate borrowers have to pay when they do borrow.
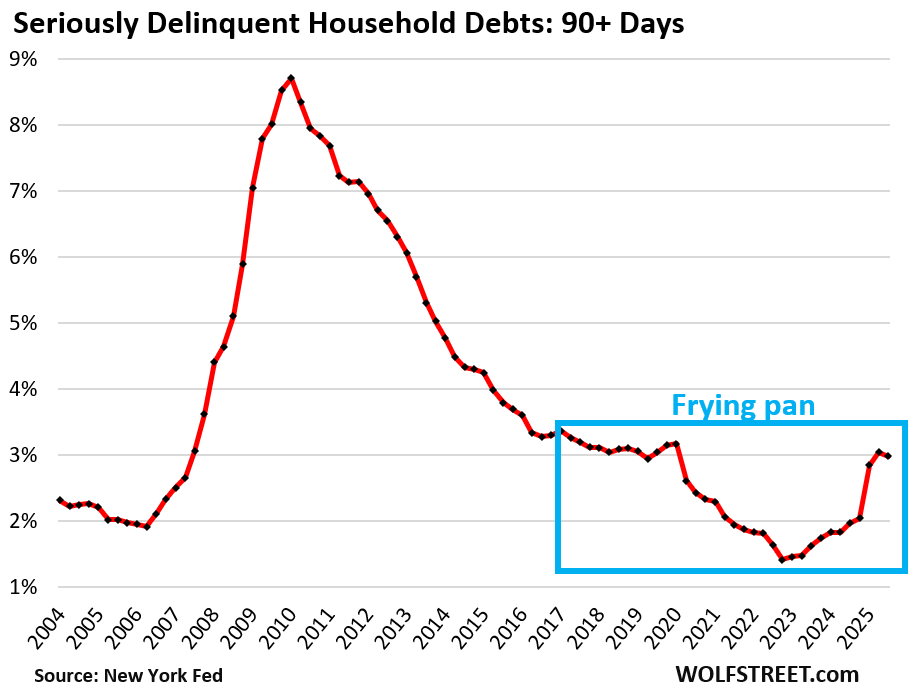
Overall delinquency rate got hammered by bad student loans. In Q1 and Q2, the 90-day-plus delinquency rate – the rate of “serious” delinquencies – for all household debts had gotten hammered by the student loans that began counting as delinquent, pushing it from 2.0% in Q4 2024, to 3.04% by Q2 2025.
But in Q3, the 90-plus day delinquency rate for student loans dipped to 9.4%, and this caused the overall 90-day delinquency rate to dip a hair to 2.98%. And that’s below where it had been before the pandemic. Note the infamous – on WOLF STREET – “frying pan” pattern.
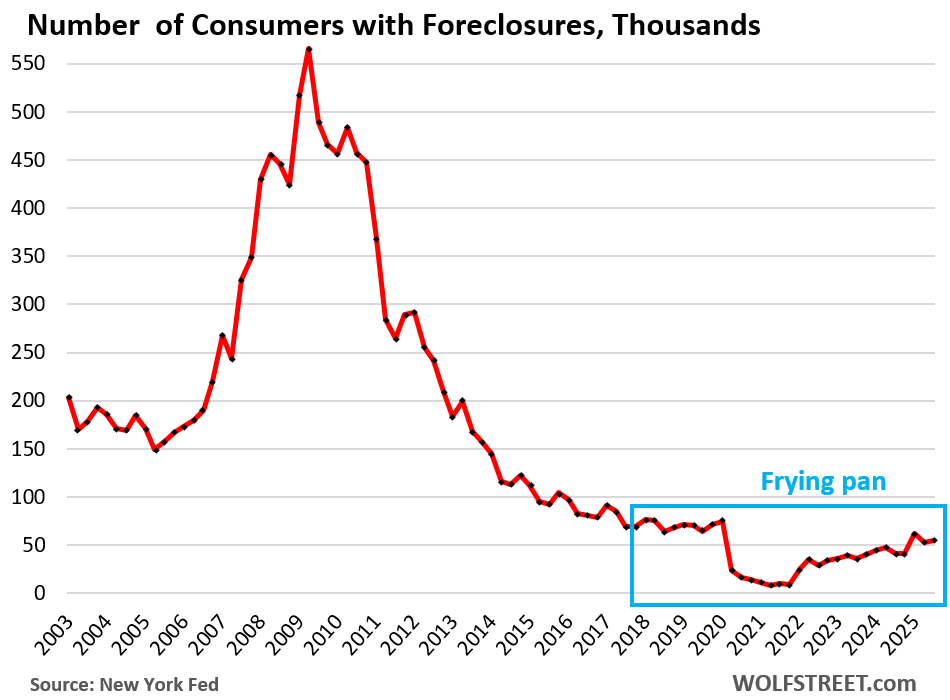
Foreclosures are low. The number of consumers with foreclosures in Q3 inched up to 54,760, well below the low end of the 65,000-to-90,000 range of the Good Times in 2018-2019, and was far below the number of foreclosures in prior years.
During the Free-Money and mortgage-forbearance era, when foreclosures were essentially impossible, foreclosures fell to near zero.
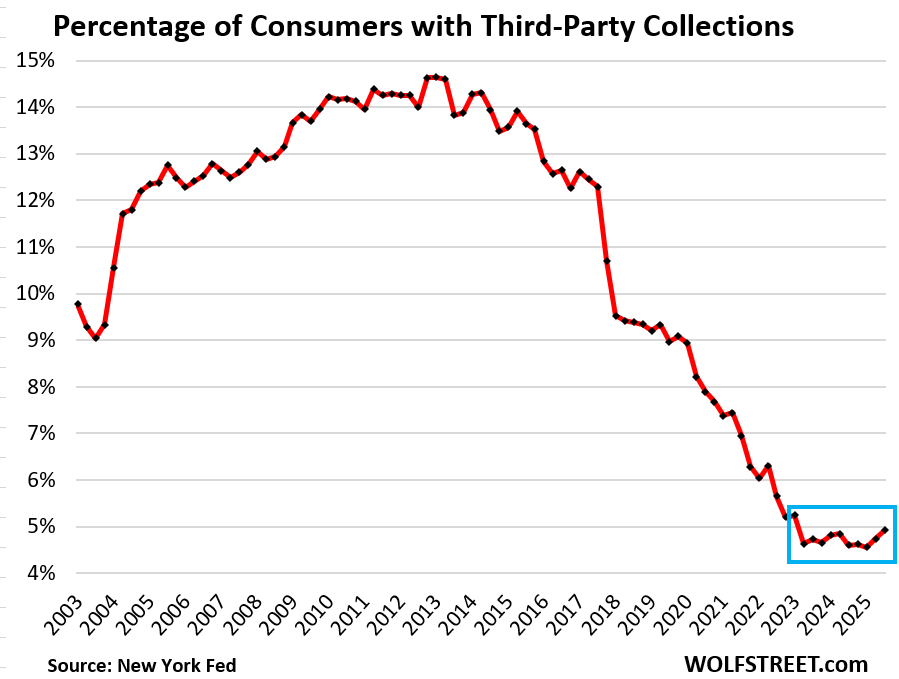
Third-party collections at rock-bottom. A third-party collection entry is made into a consumer’s credit history when the lender reports to the credit bureaus, such as Equifax, that it sold the delinquent loan, such as credit card debt, to a collection agency for cents on the dollar. The New York Fed obtained this third-party collections data in anonymized form through its partnership with Equifax.
The percentage of consumers with third-party collections had plunged from over 14% in 2013 to 4.6% in early 2023 and has hobbled along near those record lows even after the free money vanished. In Q3, it was 4.9%.
If the defaulted federal student loans are turned over to collection agencies – and there are discussions about that – it would cause the percentage of consumers with collections to spike in a spectacular way.
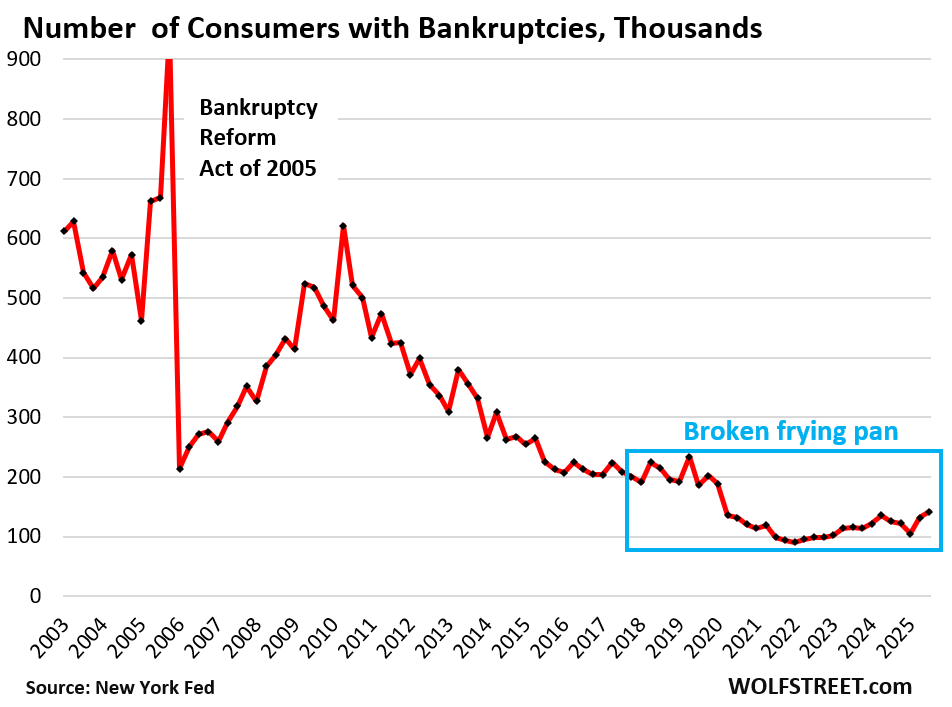
Bankruptcies at rock-bottom. The number of consumers with bankruptcy filings rose to 141,640 in Q3.
During the Good Times before the pandemic, the number of consumers with bankruptcy filings ranged from 186,000 to 234,000, which had also been historically low.
I will wade into housing debt, credit card debt, and auto debt in three separate articles over the next few days. Next one up is housing debt.
Enjoy reading WOLF STREET and want to support it? You can donate. I appreciate it immensely. Click on the mug to find out how:

![]()
What do you make of the feds recent cash infusion.
Those were repos at the SRF. They have already been backed out entirely and the SRF is back to zero as of today.
Read the articles here. I just explained that yesterday:
https://wolfstreet.com/2025/11/04/government-shutdown-adds-to-repo-market-liquidity-pressures-but-the-feds-srf-did-its-job-and-now-went-back-to-sleep/
Forgive me….
I am not sure I understand the “frying pan” graph.
What is the significance of the pan ?
Covid
Good question HUCK, thanks for asking….I too was unsure of meaning.
It’s literally the shape of the graph. Looks like a frying pan viewed from the side.
The question (which I had as well)was the significance of the frying pan shape as a technical indicator, not just what is the shape of a frying pan.
An overshoot to near zero and a bounce-back to normal.
The significance is that the crisis media hush up the left part of the frying pan and twist the right part into a crisis.
So the “drunken sailors” are in your analysis “doing ok to very ok”, whats all the national “crises”media attention to a so called “Affordability Crises”?
1. The crisis media keeps producing clickbait BS no matter what, day-in day-out, week after week, month after month, year after year.
2. Home prices, after exploding, have gotten way too expensive, and the solution is to not buy, but let the boomers sell their homes to the angels in the sky. And prices will become more affordable, and that has already started to happen in lots of markets that I have covered here. Does the crisis media tell you that home prices are way too high and need to come down?
3. The crisis media also always hushes up income growth.
“Does the crisis media tell you that home prices are way too high and need to come down?”
Yes, nearly everywhere.
And indeed, the crisis media loves to say “the consumer is tapped out” and the clickbait b.s. readers believe it. It’s tiring.
Net proceeds to the Seller of a SFR are down in the same way New Home sales net profit has fallen. Offers on my listings are full of concessions. Most Buyers ask for 3% for their closing costs and half or more want a discount along with a lot of repairs. So the closing price is higher than it should be and does not reflect concessions paid by the Seller. The total amount of concessions on any sale is privet and rarely shared even to appraisers so we will never get a real look at what the net sales prices are.
You always see the first chart of total household debt which sells the doom narrative. You never see the second chart of total household debt as % of disposable income (except on Wolf Street of course), which destroys the narrative in one glance.
But hey, doom pornsters on YouTube need to make a living too!
Re; Not so drunken sailors
A You Tube talk about “money” (what this site spins on, per Wolf) from a VERY well known Bay Area (had houseboat, Sausalito) philosopher who I had the luck to actually get to talk to back in the 60’s when he was at SRJC for a couple weeks. My English 1B teacher was a “struggling” writer who somehow made his acquaintance, which got me into a few of his other activities when not making paid speeches at JC, the primary reason he was up there.
Will likely get rejected as most links do, but Wolf gets to watch it.
Name of You Tube speaker is Alan Watts. Check it out, one can always use another historical/behavioral perspective on “MONEY” .
I found it quite interesting and thoughtful.
Saw a graph some time ago (Source Jim Bianco) showing the median housing payment (front end ratio) vs the 28% downpayment rule that when u extended the trends intersected anywhere from 2028 to 2033 depending on how the house prices hold up, assuming income growth continues on trend.
Might be a minute before the RE market revives but was interested to see the long term income trend seemed pretty good. With incoming labor shortages (presumably) that should continue.
Otter analysts have said similar things, i.e. the most likely path for home prices is flat or very small declines over 7-10 years, until income growth and inflation can bring them back towards affordability. So about 2030 then.
“let the boomers sell their homes to the angels in the sky” Good one, that almost had coffee coming out my nose laughing!
Yep, always the same stories and same people in trouble.
Social media is full of bad advice and “easy” fixes and people seem to eat it right up.
You can’t make people make good choices sadly.
If you bracket the consumers into income levels you will find that affordability is not impacting every consumer the same.
With widening inequality you can have an affordability crisis and a boobming consumer maket at the same time.
Due to post-Covid inflation the dollar, just like most currencies, has lost a lot of purchasing power. And depending on your income level people feel that.
The housholds with the lowest 20% income is for 2024 $34.510 per the US census.
That is housholds not individuals (about 2.1 people). Thats about 54 million people in the US which spend between 70-90% of their income on housing, food and energy. So there is not much left for healthcare or anything else.
But even those numbers don’t really tell the story. There is a reason Mandani won. The number of 1 in 8 children experienced homelessnes in a year is frankly insanity. That the housing market in NY is a special kind of broken is no secret, though it is those people in the margins that experience a very real afordability crisis. And the US is a big country where even small margins are impacting a lot of people in absolute terms.
Though it is debateble if the number of people impacted is relativly “small”.
There is an easy solution for those people. Get in their car and leave. Almost anywhere else is better than NYC.
Uprooting your entire life is not an “easy” solution
Especially when you don’t have the financial resources to smooth out the many rough edges of such a move.
The second graph is telling us that 80% of disposable income goes to debt. While historically low, you cannot look at the present. We are at a turning point where jobs are flat, give this another 6-18 months when disposable income drops from job losses but debt doesnt. People need to be thinking ahead. 80% is high risk looking forward with AI. Households need to plan for the breadwinner to be unemployed for half of the year. Labor market is going to get messy. People will be desparate and take lower paying jobs, salaries will freeze or slightly decrease over the next 3-5years. This is not doom and gloom. White collars will loose jobs left and right soon.
I am wondering if there is something hidden in number of households. We know the average age of owning a home is older. Are more people living with their parents? Are people delaying forming their own household? Could this possibly hide some troubles in the debt that young people have?
Nothing “hidden” here.
A household is one address, and addresses are known (the address of a house, the address of an apartment, the address of a condo, and it doesn’t matter whether owned or rented). If three generations live in one address (for example, in the same house), it’s one household. If only one person lives there, it’s still one household. If six roommates live there, it’s one household.
I’m thinking along the lines of averages hiding individuals problems. On average, people are doing better with debt. But are sub-demographic groups struggling?
There are homeless people and there are poor people, and there have always been homeless people and poor people.
But homeless people and poor people don’t have debts because they don’t qualify for debts.
The big debts are owed by people with big incomes to support the big debts.
Subprime is NOT low income. Subprime is BAD CREDIT — and often with higher incomes that allowed them to borrow more and get in over their head.
I don’t know why this is so hard to get.
Wolf does that mean if six roommates live there in one household that household has six times the income as their next-door neighbor with one person?
Household is household, whether a single man with four kids lives in it, or a married couple with two incomes, or a married couple, both working, with four adult kids, two of whom are working, so with four incomes; or a roommate situation of however many roommates (though 6 roommates is rare). There are 132 million households in the US, and only an infinitesimally small percentage are households with six roommates. So I don’t know why you even worry about that. Why not worry about the couple with one income and two kids plus a live-in staff of five people, including a butler?
In fact, average household size has consistently and gradually continued to drop from about 2.7 in 1987 to a little over 2.5 today.
That’s probably due to a decreased birth rate tho, among other factors.
This, rather than some imagined “shortage” of houses, is the reason house prices have exploded. The family model of the household is in decline and more people are living alone.
Well, a shortage simply describes when supply fails to meet demand, regardless of whether demand increases or supply decreases.
Housing supply is the highest it’s been in years.
Yes supply is higher than recently but that’s coming from very low levels after the 8 years of massive underbuilding after the housing crisis.
Just a quick look at the graph of housing starts shows how far behind we fell from 2007-2015.
@numbers but I think it’s important to identify the cause of a gap between supply and demand. The shrinking-household explanation describes why a relatively slow-growing population “needs” far more houses than the same number of people needed a couple of decades ago. The vast majority of houses build over the past 75 years are still housing people, and new house production has more than kept up with population growth. The difference is human behavior. Will we keep facing a “shortage” until every last adult has their own 3/2 SFH in suburbia? In some people’s minds, yes. But not all supply/demand mismatches are supply-side. The demand side has a say too.
This article provides some insightful data on household debts and the increasing debt-to-income ratios. It’s concerning to see how many households are struggling with delinquencies and foreclosures. I wonder how this trend will evolve in the coming quarters.
This is not what the article says. Is this a botched AI summary of the article?
Seems like they didn’t make it past the first graph. TikTok-induced goldfish attention span epedemic.
Some info on HUD foreclosures. My office has been a major player in these foreclosures dating back to the 2008 crash and although it has been silent for years, Hud has called in agents that are still in their system. We have had two regional meetings in the last 8 months and what they are saying is there will be a rise in foreclosures from HUD going forward. We have seen it in small numbers in the last few months but as usual HUD halts proceedings prior to the holidays but indicates they will start up in earnest after the first of the year and want agents to be ready. These foreclosures probably won’t move the needle but may be something to watch.
Motorcycle, the expectations of HUD foreclosures could be more of a reflection of flat or declining house prices than of an increase in borrowers getting into trouble. As Wolf has pointed out, when prices are rising, foreclosures drop to nothing because borrowers in trouble can sell the house and pay off the loan. Now it looks like more and more borrowers won’t have that option.
We are hiring for multiple positions at my company and the number of terrible, AI generated cover letters, resumes and emails is exhausting to sort through. Some of these “applicants” don’t even bother to check what AI spit out, it’s pretty comical.
Our hiring managers and talent acquisition staff went through 90 applications for one position in one week. Only 3 applicants made it to the screening phase, of which only one made it to the interview phase.
I’m recalling when, pre-’08, irresponsible use of credit was a widespread, viral phenomenon. My college students now (in a practical subject at an affordable school) do not display that. They seem receptive to guidance on careful wealth-building. However, as a group, many are poor at timely doing assignments and showing up (and my experience is teaching since 1985). I wonder if this is their matching the bottoming of math and language skills, perhaps from the interference of the pandemic in their earlier development.
Why are you making people write a cover letter?
Great. All this good news means that houses will simply not become affordable anytime soon.
Btw, someone said that recessions give money its value or something like that. Dunno if it was a joke or a mistake.
Nothing to do with home prices:
https://wolfstreet.com/2025/10/19/the-15-bigger-cities-with-the-biggest-price-declines-of-single-family-homes-10-to-24-through-september/
Those with 25% c/c debt have higher rent and higher medical bills.
Those with no mortgage, or 4% mortgage have higher insurance cost, higher property taxes, higher maintenance and higher medical expenses. The middleclass is squeezed. Yesterday voters moved to the center. The gaussian center will expand. Bernie and AOC to the left fringes. The top 0.1% of the income will stretch further to the right, like a snake.
Houses collapsed in price after 2008 because the funny money mortgages were long gone and people had to pay actual hard money or take tough loans. Prices dropped 50-75% in some places.
Without the endless funny money Federal Student Loans kids could only pay so much for tuition and fees and prices would probably drop too. 50% maybe? No more Uncle Sugar.
The solution to the “Student Loan Crisis” is to immediately stop all new federal loans, set all existing loans at 1% interest and 10-20 year payment plans, and let the whole thing work itself out and disappear forever. If state universities and private colleges find themselves in sudden budget crises – well, welcome to the real world.
“set all existing loans at 1% interest”
Why should they get a subsidized, below market rate?
Let them declare bankruptcy and give up the degree if they can’t pay.
How about the viper nest of student loan providers gives back all the money they conned out of ignorant youngsters?
The question of subsidies is an interesting one.
Why SHOULD an individual get a subsidy? The corporates have taken them all up! The farmers, energy companies, tech, and so many more!
Besides, it’s a great job creation opportunity: DegReepo man. (Soon to be filled by AI credential destruction division)
Many would have done just that over the years, if they could have. Student loans, even private ones, have been non-dischargeable in bankruptcy for a long time.
Also 1) eliminate any federal guarantees for student loans; and 2) make them dischargeable in bankruptcy.
#2 would need to be only after a period of, say, 15 years, to stop borrowers from graduating and then filing for bankruptcy the next day, before they have accumulated any real assets.
If lenders were on the hook for repayments, none of this would have ever happened. Charlie Munger was right: never underestimate the power of incentives.
The release valve for our economy is the ever-increasing government debt, so I like to watch that as well, relative to disposable income.
$38T of gov debt/ 150M households = approximately $250k per household, or another 150% to 200% of disposable income, in addition to the 80% household debt burden.
Buy what you want it doesn’t matter you can’t afford it. HA
FYI~ the secular bull market that started in March of 2009 is over, long live the bear, we have to stop the mania. After, we get healthy and responsible with capital again. Moral hazard will be tested again and again before we reach the beginning of the next secular bull in decade or so. Inflation will rise. Yeah I am delusional don’t pay attention; the crash is coming. When the $vix closes above 20 and the spy close below 666 the machine will sell and sell and sell.
Student loan debt causes me to laugh,who in their right mind loans tens of thousands to 18 year olds with no real solid plan of any sort?
Ones who know that the state will act as insurer and enforcer.
“Student loans are treated differently than other forms of debt, such as credit card balances or medical bills, during bankruptcy. Many believe it is impossible to have these educational debts erased. While discharging student loans is difficult, it is not prohibited. The law provides a narrow path for borrowers to have their student loans forgiven, but only under specific and rigorously applied circumstances. This high threshold means that only those facing the most severe financial difficulties have a chance at relief.”
Sharks that can get laws passed turning gullible students into debt slaves came up with modern day student loans. Two of the earliest biggest providers were based in Tennessee, Al Gore’s home state. All pigs get a turn at the trough.
The same kind of people who insure homes in hurricane zones, flood zones, and fire zones.
People who have that shit subsidized and backstopped by the government.
Not sure where you’re getting those numbers.
Government debt did increase the way you described, but household debt has decreased (as Wolf showed in the post) from 95% of GDP to 67%. And business debt is largely unchanged over that period (67-72% of GDP).
Student Loan debt will be an ongoing problem.
Students without STEM or Nursing, PT degrees, etc., are going to have a difficult go of it. Even many STEM degree holders will run into difficulty!
I once asked a kid with a newly minted degree in political science what he could offer to a business that made widgets.
He was dumbfounded that he could not come up with an answer.
I think I asked him if AI could do many of the things he could do, and he became upset and felt that many people lied to him.
The median student loan balance is $25,000. This means that half of the student loans are under $25,000 and half are over $25,000. That’s the price of a decent used car, or a very low-end new car. People pay off their car loans in six years no problem.
There is a small number of $100,000-plus loan balances out there, and they’re a harder nut to crack, but many of them are carried by people with professional degrees (doctors, lawyers, etc.), that have good incomes, expensive cars, and big homes.
Mechanical Engineering and English degrees here from 08’ (great timing I know!) I honestly think the English degree was the more valuable of the two for me as I was naturally mechanical but weak in liberal arts. No student debt, because college is a great time to learn to live on the cheap.
College should teach you bigger lessons not practical skills. Once you learn how to learn can question things for yourself, and find independence, there isn’t much that can stop you.
I think too many pay a lot for an education and never learn the basics. There are also those that don’t need college to realize these things. I would never go back to school now.
Employers now are staying far, far away from anyone with a new “useless” degree.
If you don’t need the degree for your job specifically you’re better off without one at all.
The smartest money man I listened too, Bob Brinker on the radio show Moneytalk, said never go into debt the first 2 years of college. Go to a junior college if you have to.
Excellent article Wolf, challenges the fintwit and mainstream narratives. I really really hope you can bring back the “Wealth Disparity” analysis you did few years ago just to complete the picture some more, I’m very curious where that has gone since.
“Subprime” means bad credit, not “low income.”
I had to read this 20 times before I began to understand, Wolf. Thank you for repeating it so often.
Thank you!!! Yes, it’s funny. In the media, subprime is always equated with low-income because it makes for clickbait… Oh Look, low-income people are in trouble with their debts… when low-income people can hardly borrow at all.
I have said this line here in my articles and in the comments about 1,398 times, and people just don’t see it. Or it doesn’t sink in.
I’m wondering if these numbers look so good because we’re at full employment? I wonder what they’d look like at like 5.5% unemployment?
In a HCOL city most people below 40 seem to be feeling poor, even ones who bought houses in the few years before 2020. That being said my parents generation is thriving.
From what I see, young people in that age group are thriving and making lots of money. I now have doctors in that age group, LOL.
I mean doctors are notoriously the worst with money if you ask any CPA. I wasn’t doubting that high income individuals exist. Just saying that cost of living has become problematic. For many people the cost day care is more than their mortgage.
And that it’s easy to pay your bills on time when everything is good. But if unemployment goes up, I wonder if the graphs will change?
Like in 2008 how many mortgage foreclosures started off the crisis, and then how many foreclosures were a result of the layoffs from the crisis.
On another note, when I wonder how the economy is doing, I see ask my hair stylist. Suddenly I can get appts last minute. She said people are spreading colorings out further and further, etc. Similarly last year to get a facial I’d have to book 3 months out, now I can call 2 days in advance… I think the consumer is okay, but getting cautious.
If you try to track the vast US economy and consumer spending by just one business, esp. a tiny business, you WILL be misled.
I meant discretionary services in general, usually the first to go. I can also get a table for dinner without a reservation now.
And in general, what I’ve heard is net negative. Spent a decent amount of time in Vail and Aspen this summer and I’d sit at non-tourist coffee shops and just eaves drop while I worked and the sentiment was pretty negative amongst the rich. Vail village was quiet for prime tourist season.
Not saying we’re in a recession just that things are slowing
Wolf does the BEA have a paper that explains the formula for the disposable income number? It’s not obviously placed on their website.
I gave you the formula in the article.