Balance Sheet as % of GDP: Fed, ECB, BOJ, BOE, and Central Banks of Canada, Australia, New Zealand, and Sweden
By Wolf Richter for WOLF STREET.
This came up in our illustrious comments today on the ECB’s accelerated balance sheet QT. The ECB and the Bank of Japan have this year accelerated their QT, while the other central banks have slowed QT (such as the Fed) or have ended their QT (such as the Bank of Canada).
And the question was: Are the ECB and the BOJ seeing something different that the Fed and others don’t? This can best be answered by showing where each of these central banks’ balance sheet is in comparison to the others – and there are vast differences.
The big central banks that for years had huge QE programs and piled on assets for whatever rationale – Federal Reserve, ECB, Bank of Japan, Bank of England, Bank of Canada, etc. – flipped to QT in about 2022.
Except for the Bank of Japan, which took a lot more prodding from surging inflation and the plunging yen before it too kicked off QT at the beginning of 2024. It has been accelerating QT since then and is now shedding assets at a substantial clip.
The best measure to compare central bank balance sheets to each other, is in terms of the size of their balance sheet compared to nominal GDP, so their total assets in local currency expressed as a percentage of that country’s nominal GDP in local currency.
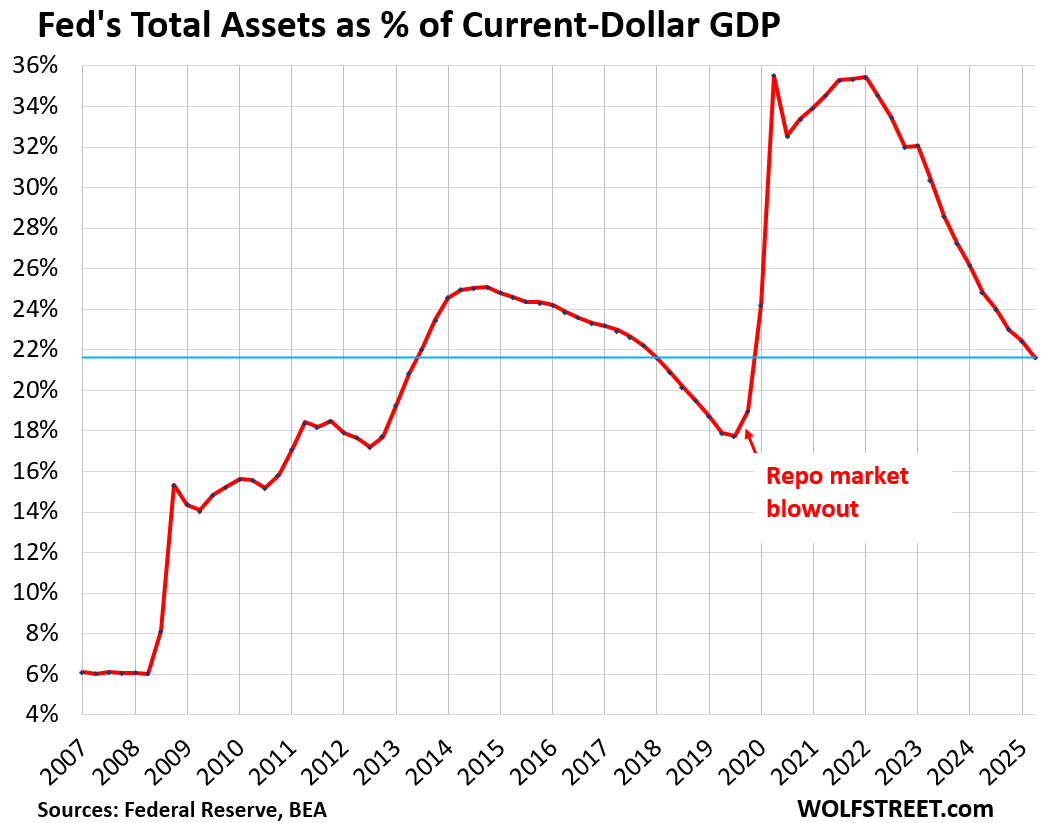
We’ve been discussing the Fed here, and its total assets have dropped to 21.6% of nominal GDP, where it had first been in Q3 2013 (total assets divided by “current dollar” Q2 GDP).
One of the questions in our comments was about QT by the Reserve Bank of Australia, which I don’t cover. So I gave the RBA’s website a look-see. In its chart deck as of October 2025, there is a chart of the assets-to-GDP ratios for eight central banks, in two parts, side-by side:
Left side:
- Bank of Japan
- ECB
- Bank of England
- Federal Reserve
Right side:
- Reserve Bank of New Zealand
- Sweden’s Riksbank
- Reserve Bank of Australia
- Bank of Canada
The reason they’re in two different parts is the vastly different magnitude of the ratios (chart from the RBA).
Massive joint backtracking on QE.
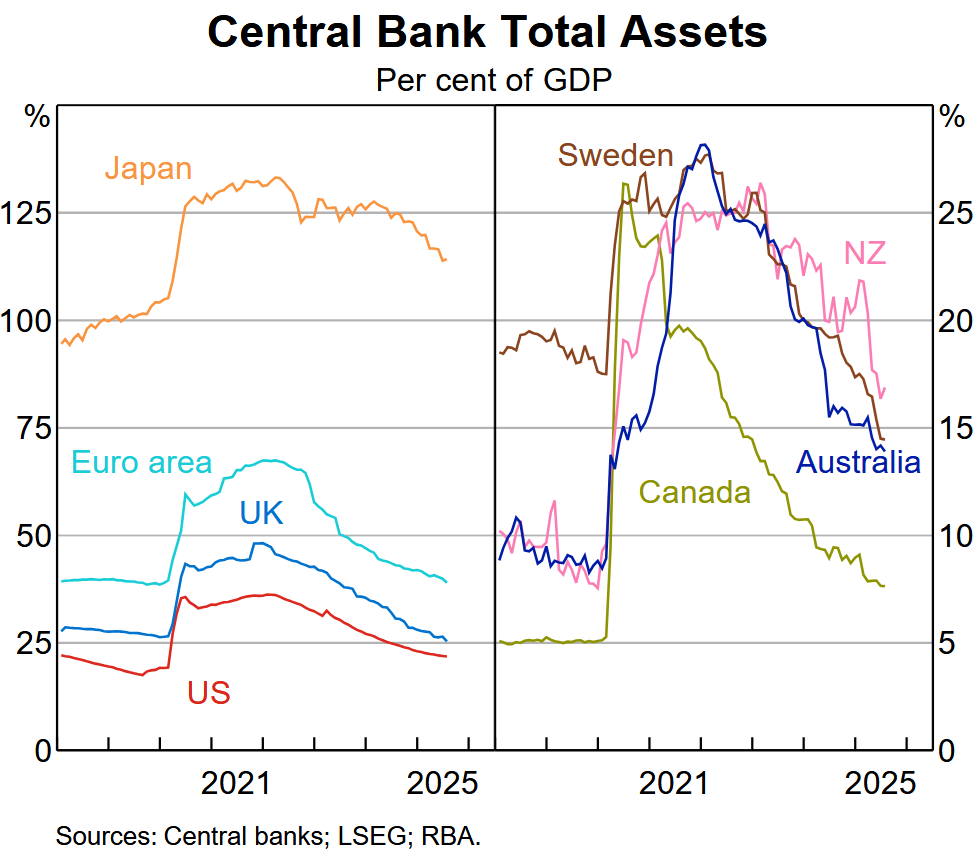
The mega-QE central banks are on the left side, whose balance sheet at the peak of QE ranged from 35% of GDP at the Fed to over 130% for the Bank of Japan. The BOJ is still above 110% of GDP, while the Fed is below 22% of GDP.
The central banks in the right chart never did that much QE, with the Bank of Canada maxing out at 25% of GDP. The others maxed out in the 26% to 28% range.
The Bank of Canada has ended QT as its assets are now at around 8% of GDP, which is where the Fed was before 2008. Assets of the Riksbank and RBA are now at around 14% of GDP.
Japan really belongs into a chart of its own. Its ratio dwarfs the ratios of the other three – ECB, BOE, and Fed – and distorts the view.
But they’re all seeing the same things: The continued threat of inflation and huge distortions and risks in asset prices. And they’re trying to walk back from those threats. The BOJ sees the additional risk of the yen plunging even further against other currencies.
Enjoy reading WOLF STREET and want to support it? You can donate. I appreciate it immensely. Click on the mug to find out how:

![]()
Thanks Wolf, it’s helpful to see those other countries ratios.
At first glance I didn’t pay attention to the % axis on the right side of the chart. I thought, hey Look at the USA, we’re doing great!
Then I noticed the scale is different, Lol!!
I told you in the text that the scale is different because Japan is in the left chart, and it went over 130% so the scale on the left chart goes to 150% and the right chart goes to 30%.
I also told you in the first chart (my own) that the Fed went from over 35% at the peak to 21.6% now, while Canada’s BOC barely got to 25% at the peak and is now at 8%. Of the four big central banks, the Fed has the lowest assets-to-GDP ratio, though it’s far higher than the four in the right chart.
You could have just read the text?
Japan and the JCB is going to test out the concepts of “inflation is good” and a declining currency helps exporters. The other concept is that the carry trade is low risk. I expect Japan will have a crisis decade where the foolish Japanese government debt bingeing will bring severe consequences. Like a college party where beverages are flowing and the food and entertainment is “on the tab”, the Japanese economic strategy looks risky to me.
Wolf, you have much more contact with Japan and its reality than I. What to do see as the future of Japan, its easy money JCB, and the Liberal Democrats that have pandered to Japanese voters.
Warren Buffett and company have acquired some Japanese holdings. Perhaps you should keep an eye on their perspective.
Thanks for the RBA info.
I just wanted to comment on the excellent video, the combined valuation of the top eight tech stocks (Broadcom has passed Tesla into number 7) is now $22.6 Trillion, it is very interesting to me that so many people are ranting about the national debt being so outrageously high but don’t see any bubble in the stock market (!!!)
And top 10 are 39% of SP500.
I’ve read an article today that theres is now an AI bubble in bonds as well. That Morgan Stanely or some such estimated bonds by AI companies to be 14% of all “investment grade” bonds from SP500, and AI is now the biggest sector in IG bonds. For perspective the banks are at 11%.
I honestly do not know what the above means. But I do observe now that (somehow) June NVDA deep out of money puts I bought at $182 are 20-30% more expensive now that NVDA is at $192. These were in the green practically same day as I bought them. I’ve seen this with Amazon once in the previous “bubble” – otm puts I bought for $500 (that was when Amazon got to $2400 pre-splits) sold for $10K at the bottom. I of course got out way too early at around $4K.
For the record Nvidia is now priced at $4.7 Trillion.
This has been going on for a long time. People predicted this twenty years ago, some since August 15, 1971.
QT has been going on since 2022. That’s what the article is talking about. I don’t know what you’re talking about.
I think what Otto is talking about is the day that the dollar stopped being convertible to gold (had to google), going to fiat, and how that could lead to excesses in monetary policy due to lack of natural controls on the money supply and thus on the monetary policy authorities.
Currency is a mutually valued object which has evolved from elaborate sea shells, livestock, etc (there’s a great list if you google “Smithsonian forms of money” and “historic forms of money”) to metal coins to paper to digital. I call it a “shared hallucination”. Gold is kind of in the middle between commodity and the shared hallucination concept of value because it has use as adornment.
I find the “shared hallucination of value” quality of paper and digital money, stocks, crypto to be quite interesting. IMO demand pressure keeps the whole structure stable, like gravity forces the stones of arches together, keeping that structure stable, even though it seems like it should fall.
Wild then, that the period since 1981 marks the most stable period of inflation in US history. And the average inflation rate before 1971 and after 1971 are exactly the same!
“Huge distortions and risks in asset prices.” Also known as the Wealth Effect, the goal of the Fed under Bernanke and Yellen. Strange to say, the Wealth Effect is not mentioned in the Federal Reserve Act, which talks about maximum employment, stable prices and moderate long term interest rates. I suppose that when the Fed is saving the world from the consequences of its own actions, legal technicalities don’t matter. If Trump ends the Fed’s supposed independence, will his appointees be worse than the current members of the Board of Governors and the FOMC? I doubt it.
Here here! The Fed has been the single greatest enabler of bad behavior the world has ever known. Nixon removed the last real monetary restraints in 1971.
Wild then, that the period since 1981 marks the most stable period of inflation in US history. And the average inflation rate before 1971 and after 1971 are exactly the same!
Perhaps I am reading it wrong, but the chart makes it look like the Bank of Canada reaches a maximum slightly above 25%, while the article says it reached a maximum below 20% of GDP. Regardless, it’s impressive that the BoC was able to complete their QT at this pace. Per the BoC website, CPI-trim is at 3% which is at the upper bound of their total-CPI range.
“slightly above 25%”
Correct. thanks
Wolf, does this mean US dollar will become stronger? Any positive news regarding less QE
The dollar is doing just fine against other currencies. Many currencies have plunged against the dollar, such as Russian ruble, Indian rupee, Turkish lira, yen… to list just a few of the larger countries. The EUR-USD exchange rate is roughly in the middle of the 25-year range.
What is going on is inflation. That’s the problem – not the USD exchange rates. Inflation is now a problem more or less everywhere.
Wolf, you’re a good dude. Someone asks for Australia’s central bank numbers and you give them the numbers in the next article. It’s Wolf’s kitchen, but you do like to show people that you can cook anything.
I’m convinced that Wolf is like Remy from Ratatouille and in the Fed’s kitchen helping them cook. Not only does Wolf have his own kitchen (Wolfstreet), he’s cooking under the hat for the benefit of us all.
One can dream…
I now have my own charts about the big 10 central banks, including China and India (and of course Australia), just spent hours doing it. This is really interesting stuff. I’ll post something in about a month or two.
Super interesting charts!
Yet they leave me with many more questions than answers.
How did BOJ manage to get to 100% pre pandemic without much inflation, while US got major problems at 35%? Does Canada reaching 8% mean US has a lot of room for QT? I think you mentioned a few times recently that there’s actually not that much room for QT for the Fed. Maybe it’s the rate of change in these time series that correlates better with inflation? Or maybe the underlying systems are too complex to try and reason about from looking at just a few variables.
Good questions!
Because inflation is complex and has many causes, of which QE is only one?
Four days ago this article came out:
“Reuters
PM Orban says Hungary should not adopt euro as EU is ‘disintegrating'”
This leader of Hungary apparently has “the inside scoop.” Hungary is getting a lot of pressure from the EU to conform on everything, must be why PM Orban went public.
Orban is a Putin stooge and doesn’t belong in the EU. He needs to see if his people want to exit the EU and join Russia or something. Or his people could vote him out of office and stay in the EU. He says no matter what BS. The EU has never been more solid (except Orban). Even the UK is coddling back up to the EU. Putin has done a wonderful job uniting the EU (except Orban).
This mainstream view is not well-supported by evidence. It is highly likely that Orban is correct, and the EU is in danger of disintegrating.
It is also of note that the supposedly united EU, along with the US, have invested jaw dropping amounts of money in the war against Russia, in addition to all the sanctions, which btw are regularly breached by western companies (in the energy market). This huge efforts have not paid off, the war is very far from being won. This in itself is a sign that there is something very wrong with the way the allocated funds are being used in the war effort.
Time will prove that taking such an aggressive stance against Russia was a very bad idea, people in Europe will be very unhappy with the results. The war will most likely be lost, the “loans” will never be paid off, and there will be no Ukrainian resources left to be seized as compensation. It will also most likely provoke a huge loss of confidence in the EU and NATO as effective structures.
I know you will most likely admonish me for writing this, but I don’t actually understand why someone like you would ignore the red flags with this whole issue.
Thanks for the excellent graphics. Having these in all one place is soothing for the eyes to look at, even if we know the numbers individually.
The next shoe to drop will be an end to fiscal profligacy. As the monetary tightening continues, long-term yields may no longer be artificially suppressed and Bond vigilantes will ask for higher yields unless the fiscal deficits are pruned. Japan will be the first one in my view – it is simply impossible to manage a 250% debt if yields are not artificially suppressed by the Central Bank. US will follow, their size is so astronomical that I just don’t see how they can continue to spend like there is no tomorrow without causing nominal assets to shoot through the roof – Gold is showing the way.
Once the Central Banks and the governments get their act together, maybe we can go back to the happy 90’s – low inflation, low growth.
Or maybe we won’t – a short recession and everyone will back to printing money.
Total inflation from 1990-2000 was 32%. Total inflation from 2015-2025 was 36%.
Total GDP growth from 1990-2000 was 70%.
Total GDP growth from 2015-2025 was 66%.
Nice charts!
Were there any central banks that did not perform QE?
It’s no longer the central banks that are fueling risk investment. Investment isn’t being rotated from the rest of the S&P500 companies into the top AI companies. The money isn’t coming from cashed-up individuals who are enjoying low but safe returns. The risk investment money must be coming from loans. Those loans are secured by assets. The problem arises when some of those loans start to be called in or investments become worthless and the securing assets have to be sold. We have not yet seen a black swan event that can cause the unraveling to happen, but they have happened in the past. There was the Long-Term Capital Management collapse and the Lehman Brothers collapse. When such an event happens, the Fed will cut rates and stop the financial system from imploding, but that won’t support the prices of overvalued risky investments. We wait.
What’s amazing to me in this article is the central bank that’s conspicuously absent: the People’s Bank of China.
I won’t claim to understand how the Chinese financial system works, but my impression is that they use different tools, such as directing state banks to issue loans to businesses directly, instead of using QE.
Is there any reliable published statistic for the PBoC that could be considered equivalent to the Western central banks’ QE? With China facing deflation, I’m guessing they are not doing any reduction in their balance sheet.