Germany, France, Italy, Spain, Netherlands, Poland, Belgium, Sweden, Ireland, Austria, Norway, Denmark, Romania, Czech Republic, Finland, Portugal.
By Wolf Richter for WOLF STREET.
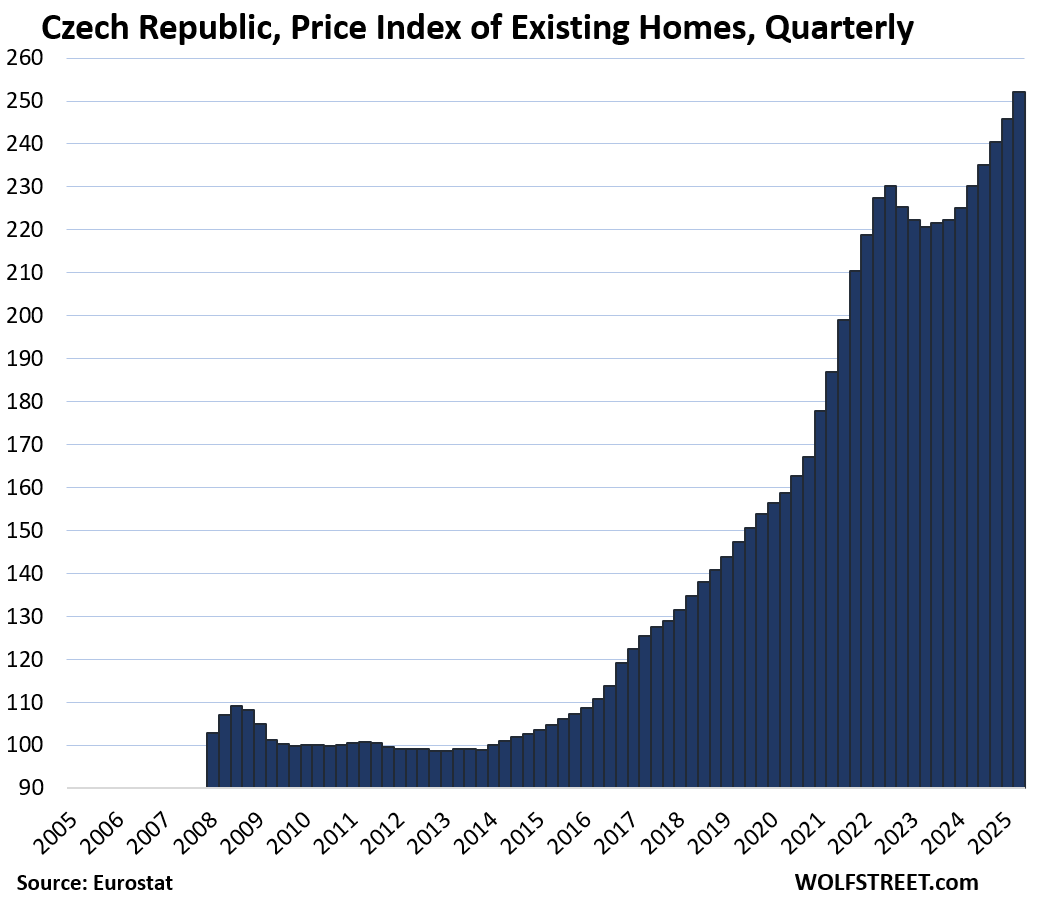
Prices of existing homes of all types (“dwellings”) in the 16 largest countries in the European Union (EU) or in the European Economic Area (EEA) by GDP have varied substantially. Some of these countries have splendid housing bubbles. While prices of a few of them have deflated some, in others, prices continued to explode, such as in the Czech Republic, were prices have spiked by 155% in 11 years.
Some countries had the most splendid housing bubbles 15 or more years ago, which then imploded with dramatic effects, only to reignite again.
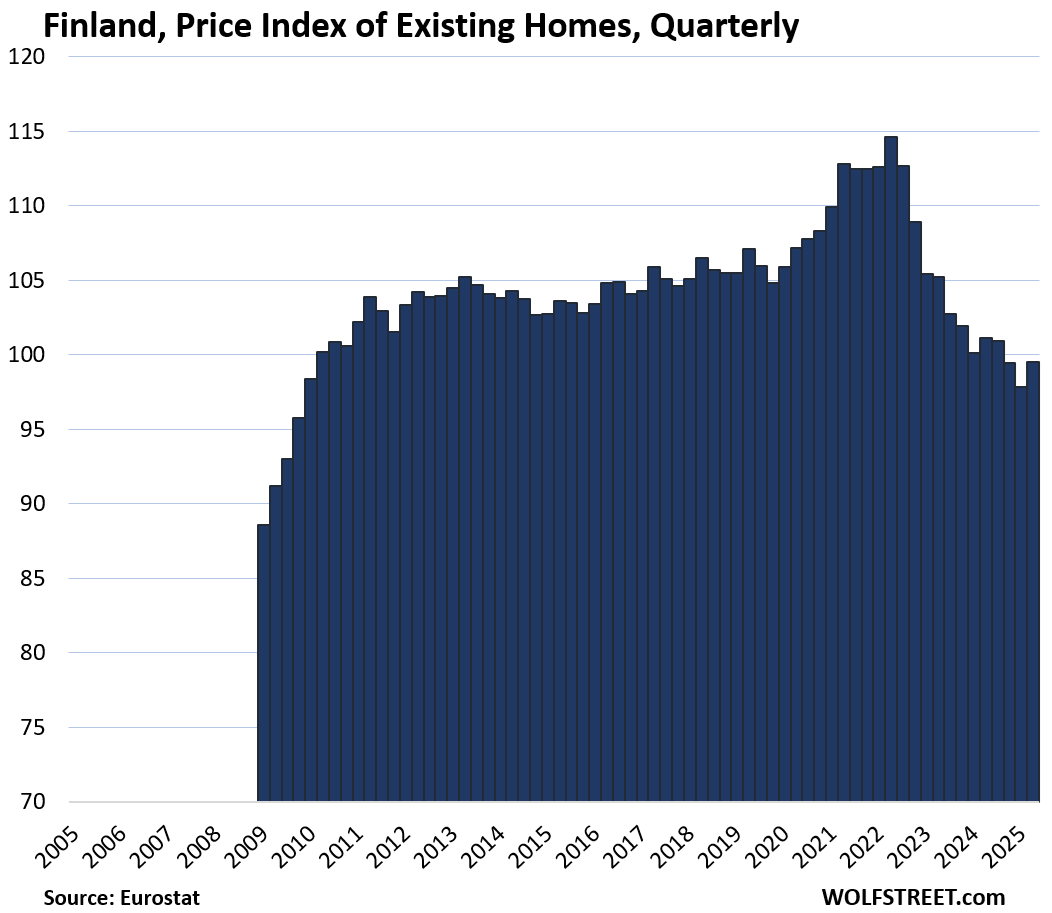
In one (Finland), home prices have fallen back where they’d been in 2010. In another (Italy), prices are still well below 2010 though they’re surging now. And in another (Spain), prices just now rose above the prior bubble peak 18 years ago, whose dramatic implosion had shaking the country.
So a wild ride across the spectrum, with the most recent iteration reported by Eurostat through Q2 on Friday. The data goes back to 2005 for some countries, and less far for other countries.
Biggest price declines from the peak, and year of peak:
- Finland: -13.2% from Q2 2022, back to 2010 levels.
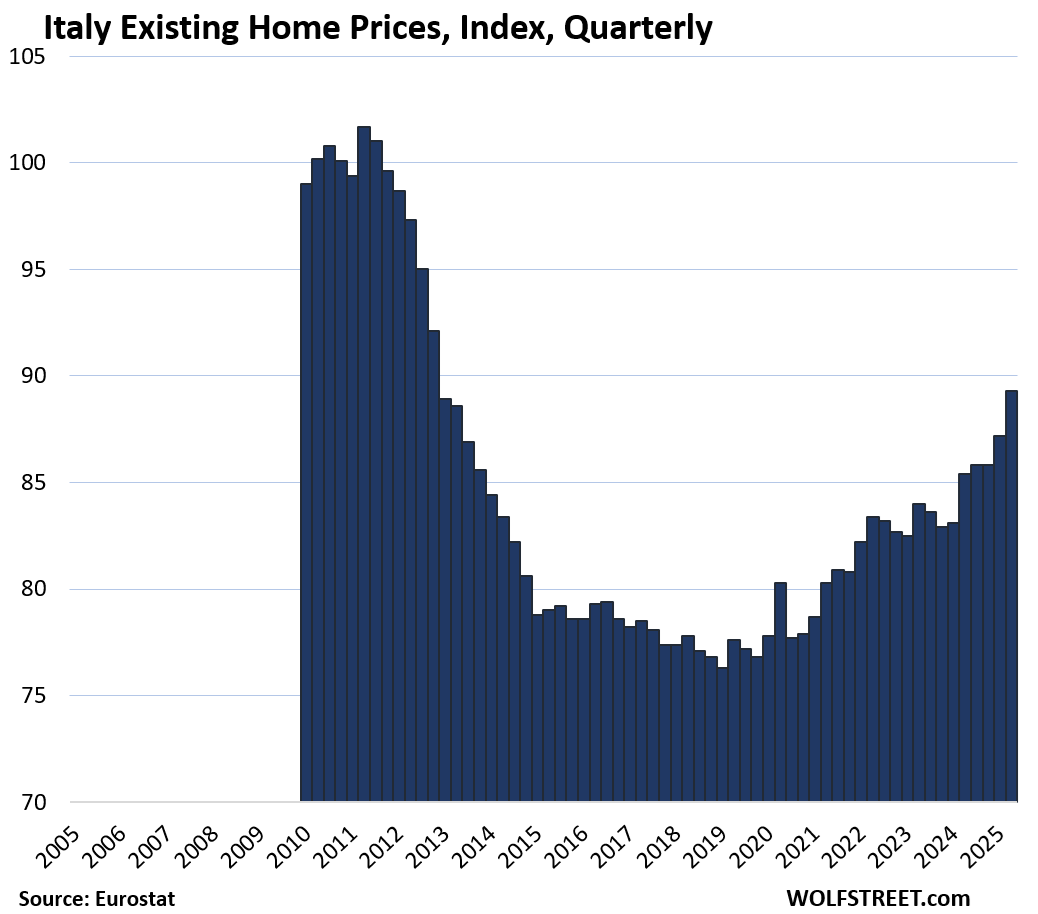
- Italy: -12.2% from Q2 2011, still, despite a 5-year price surge
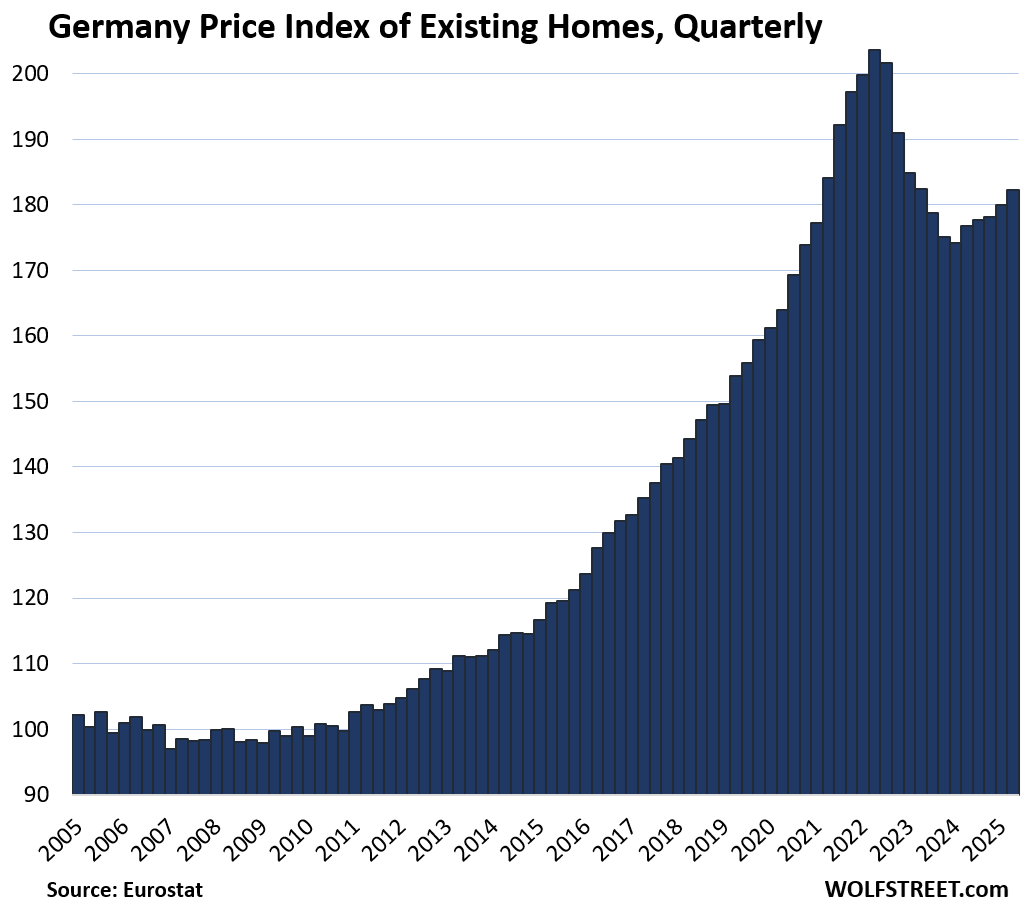
- Germany: -10.5% from Q2 2022
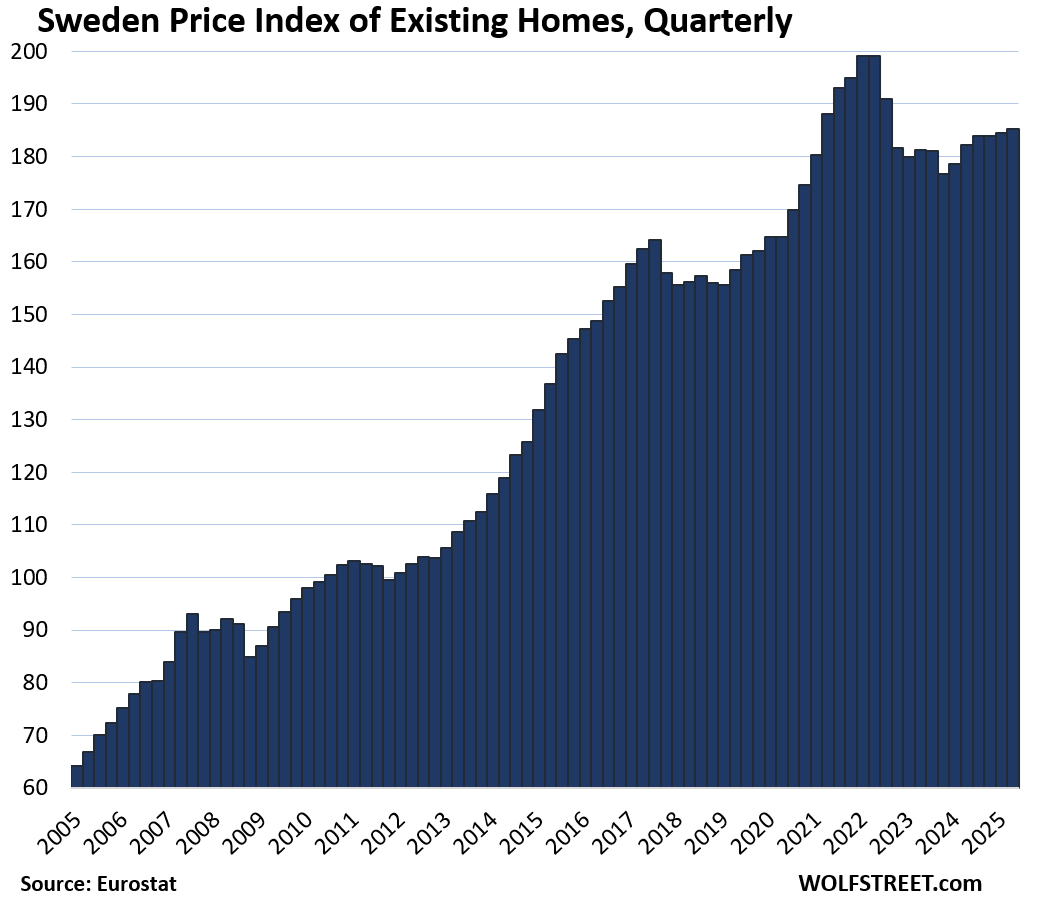
- Sweden: -6.9% from Q2 2022
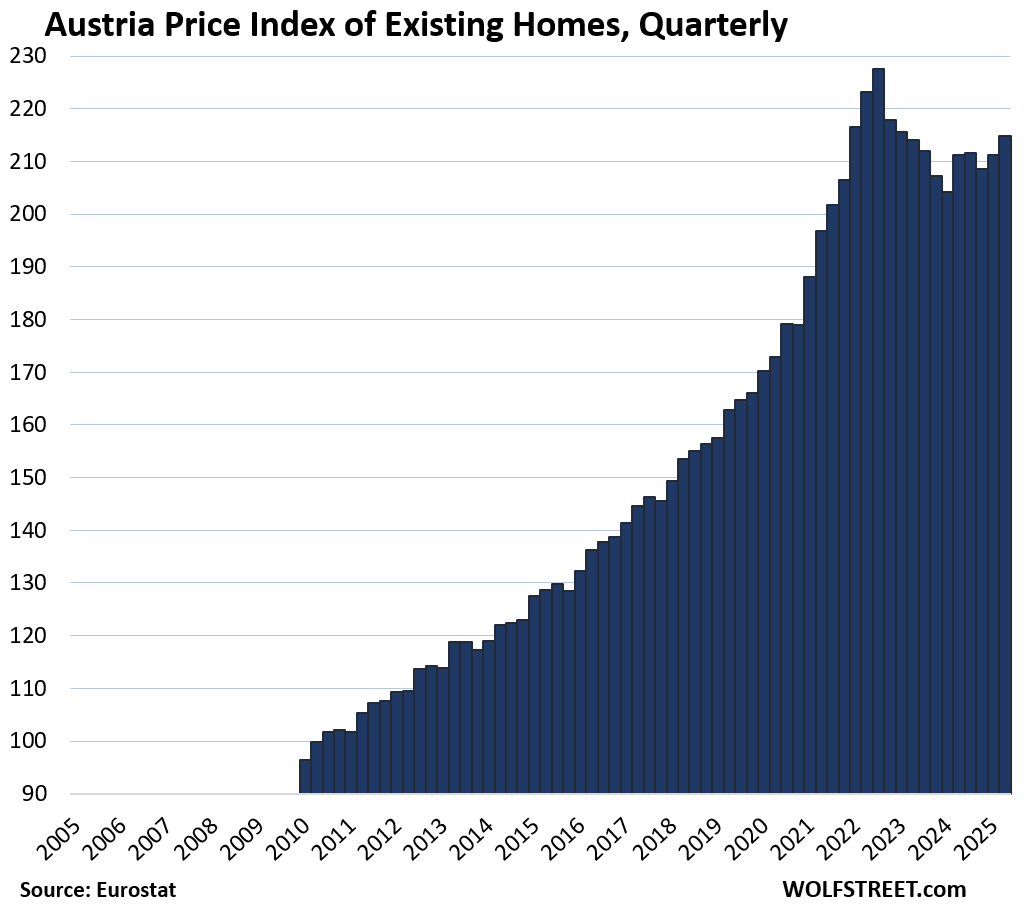
- Austria: -5.6% from Q3 2022
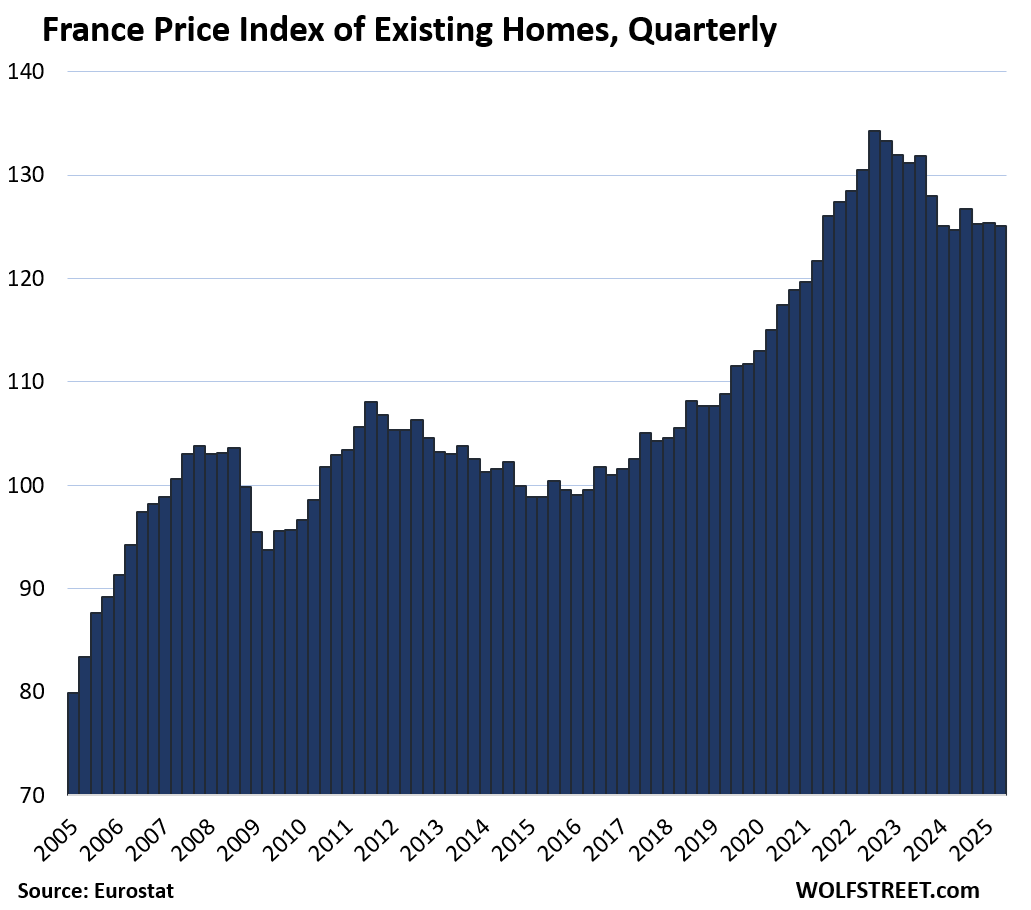
- France: -6.8% from Q3 2022
Biggest price gains since 2010:
- Czech Republic: +152%
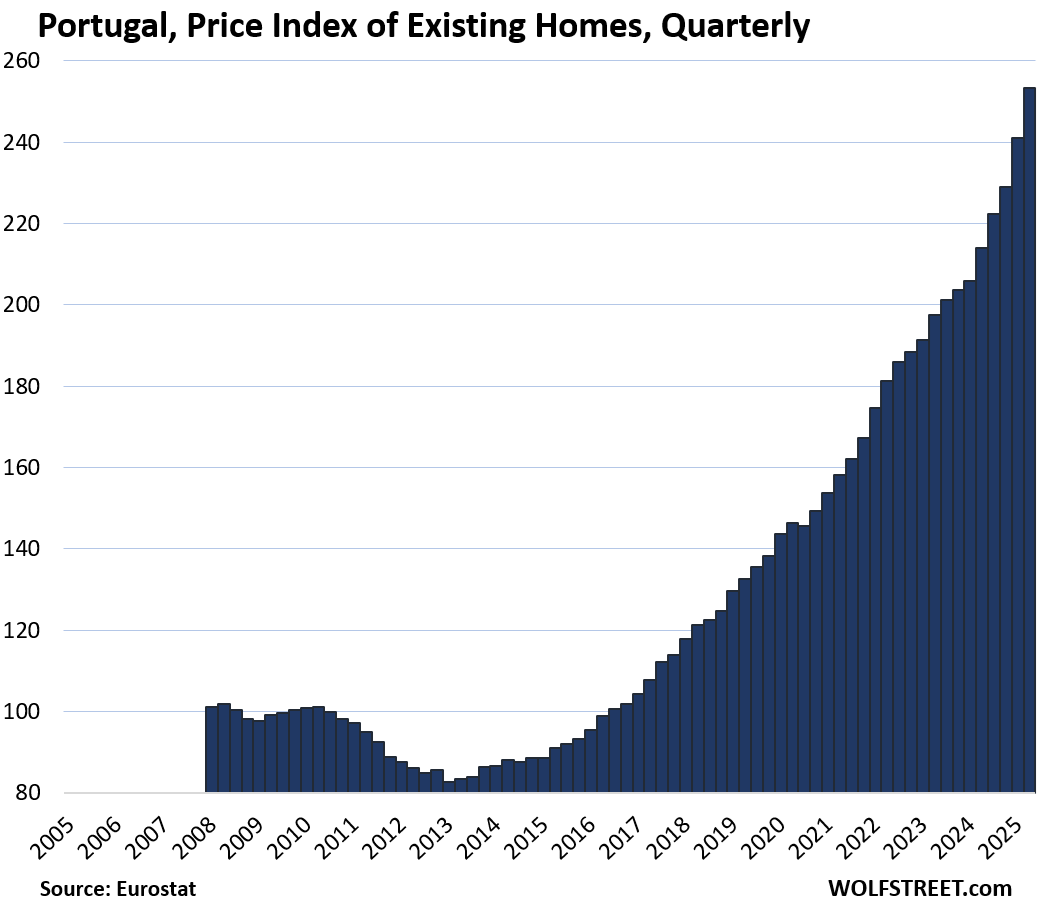
- Portugal: +151%
- Austria: +123%
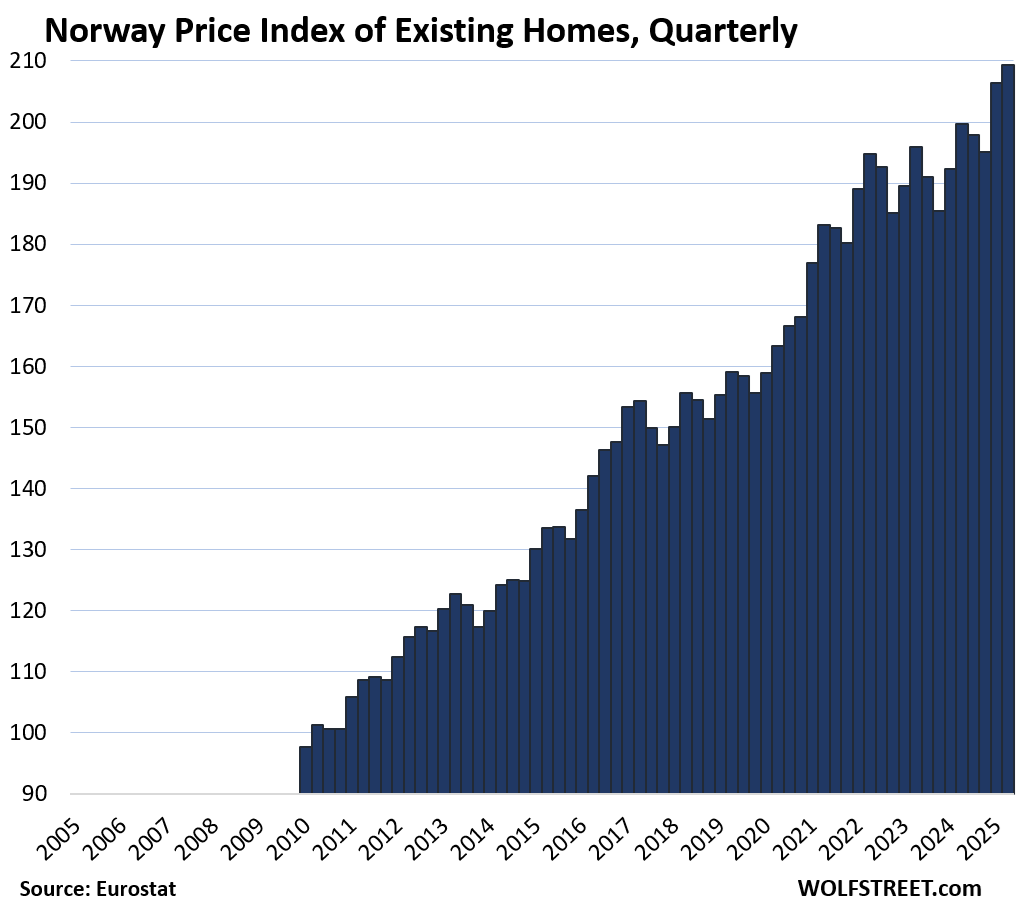
- Norway: +114%
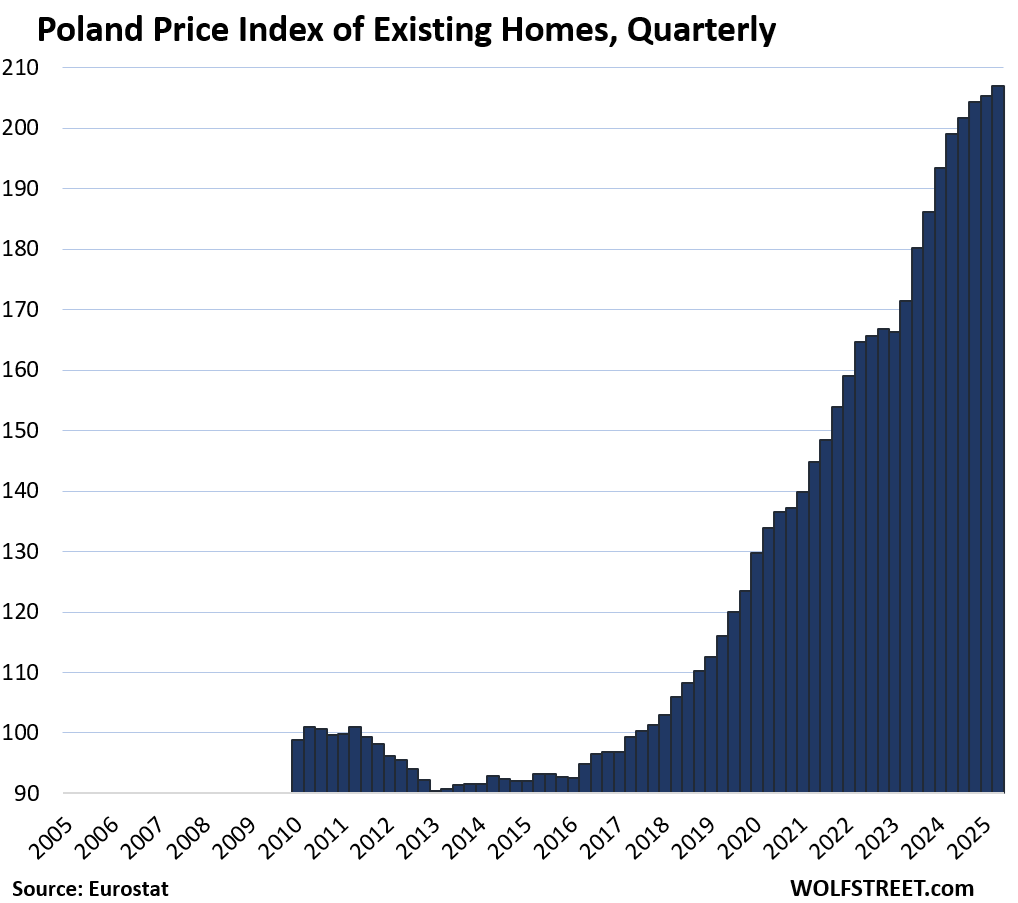
- Poland: +109%
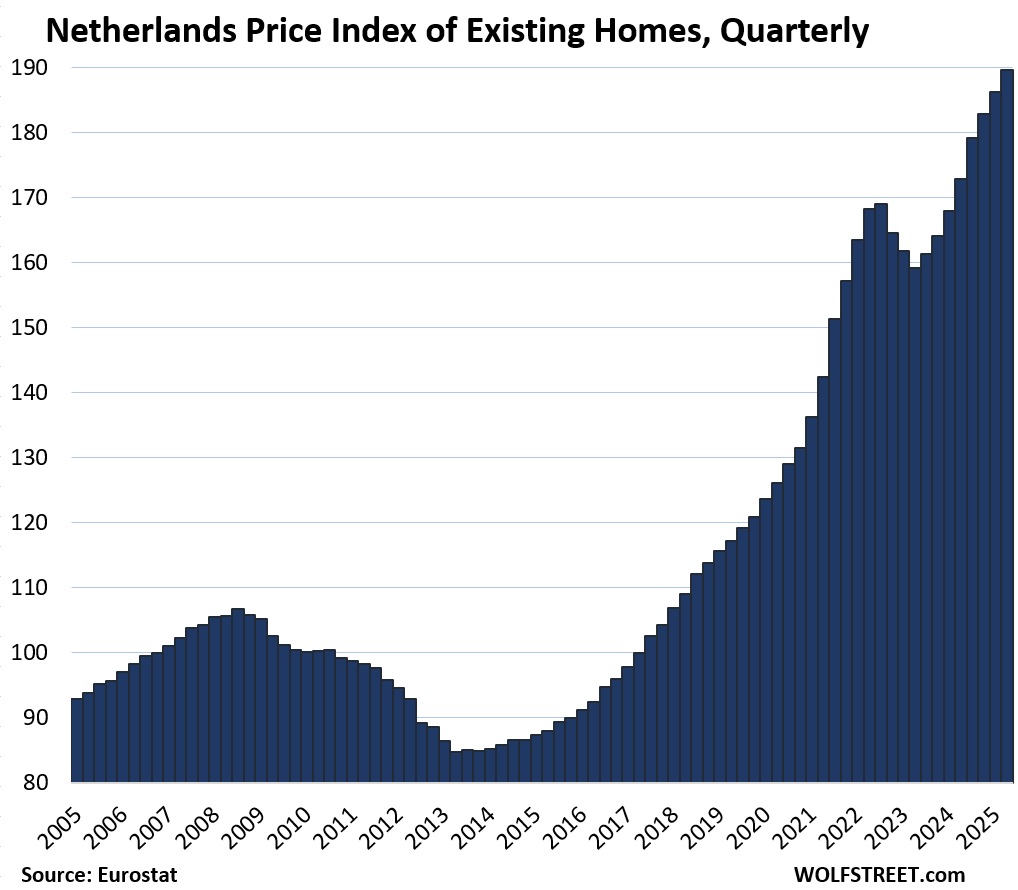
- Netherlands: +89%
- Sweden: +89%
- Germany: +84%
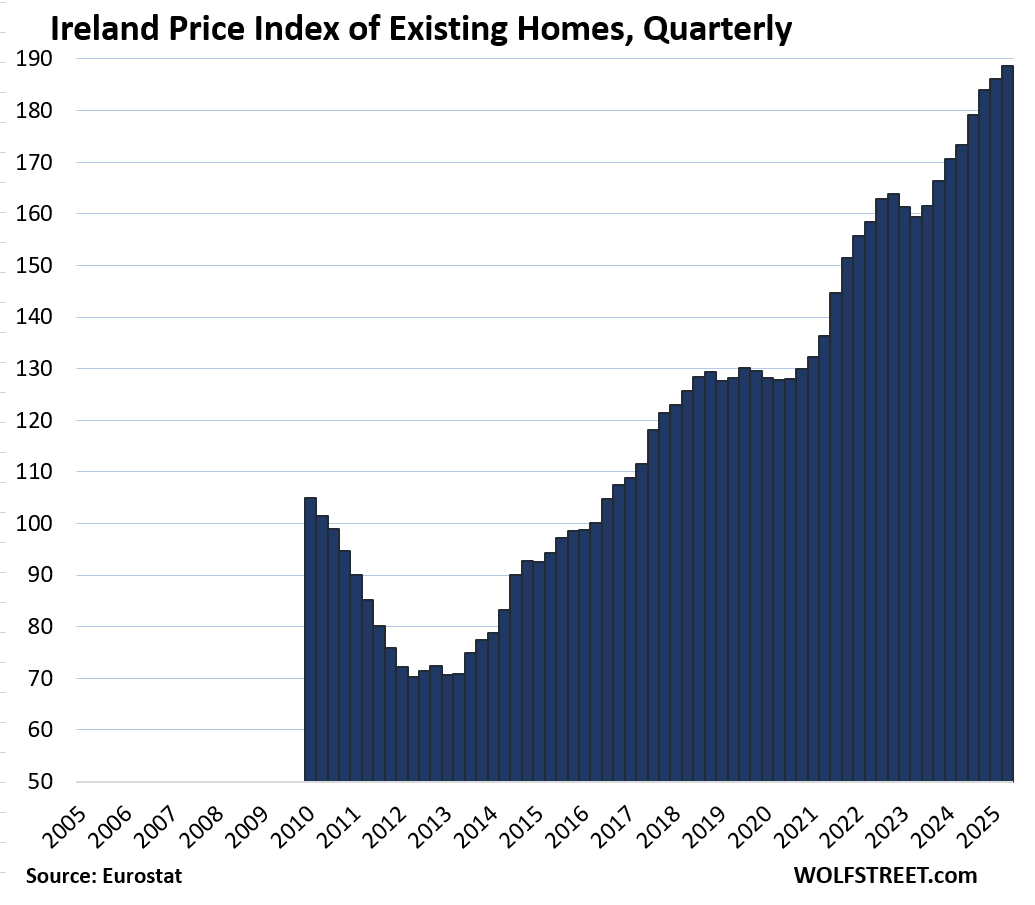
- Ireland: +79%.
Biggest year-over-year gains:
- Portugal: +18.3%
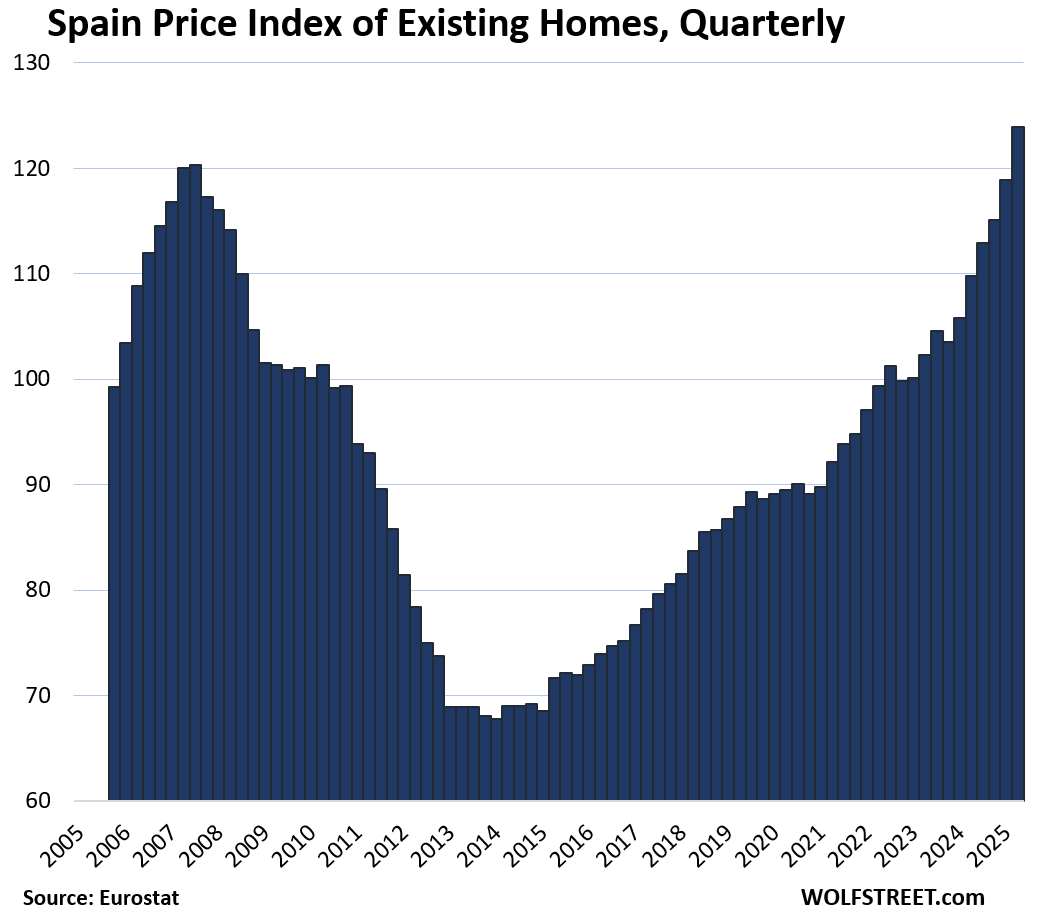
- Spain: +12.9%
- Netherlands: +9.7%
- Czech Republic: +9.5%
- Ireland: +8.8%
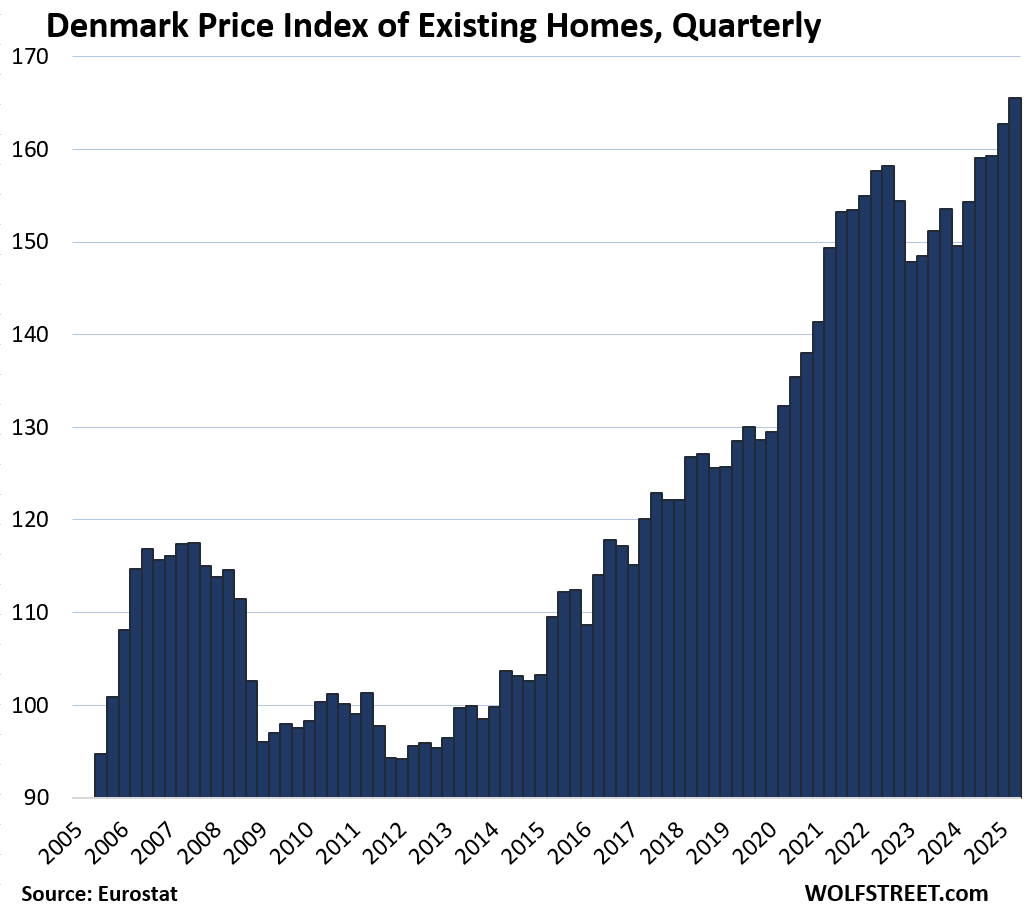
- Denmark: +7.3%
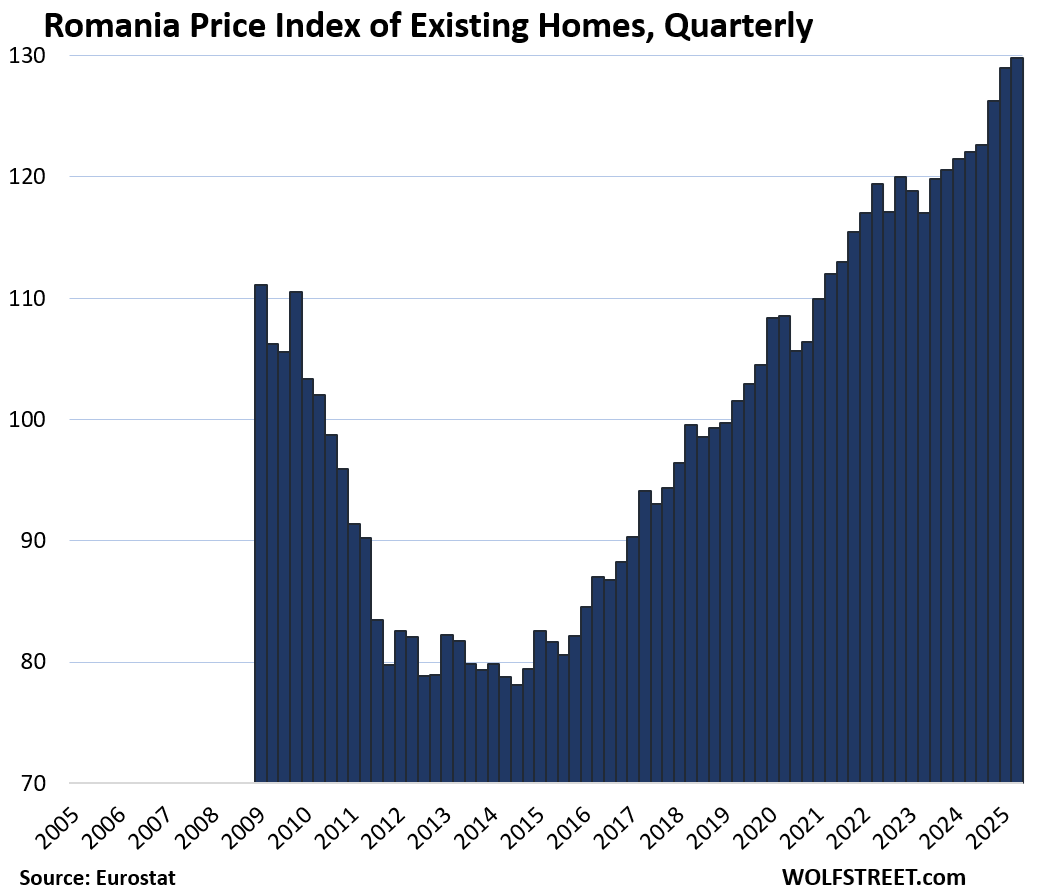
- Romania: +6.4%
Biggest quarter-over-quarter gains:
- Portugal: +5.1%
- Spain: +4.2%
- Czech Republic: +2.5%
- Italy: +2.4%.
The home price indices for the 16 largest countries in the EU or EEA:
The little tables show either three or four columns, from left to right: % change since 2010; quarter-over-quarter (QoQ) % change; year-over-year (YoY) % change; and % decline from the peak, if applicable.
| Germany, Prices of Existing Homes | |||
| since 2010 | QoQ | YoY | From peak |
| 84% | 1.2% | 3.1% | -10.5% |
The index is where it had been in 2021.
| France, Prices of Existing Homes | |||
| Since 2010 | QoQ | YoY | From peak |
| 29% | -0.2% | 0.3% | -6.8% |
Where prices had been in 2021.
| Italy, Prices of Existing Homes | |||
| Since 2010 | QoQ | YoY | From peak |
| -10% | 2% | 4.6% | -12.2% |
The recovery started during the pandemic. Eurostat’s data for Italy only goes back to 2010.
| Spain, Prices of Existing Homes | ||
| Since 2010 | QoQ | YoY |
| 24% | 4.2% | 12.9% |
For the first time above the peak 18 years ago.
| Netherlands, Prices of Existing Homes | |||
| Since 2010 | QoQ | YoY | |
| 89% | 1.8% | 9.7% | |
| Poland, Prices of Existing Homes | |||
| Since 2010 | QoQ | YoY | |
| 109% | 0.8% | 4.0% | |
The Eurostat data for Poland begins in 2010.
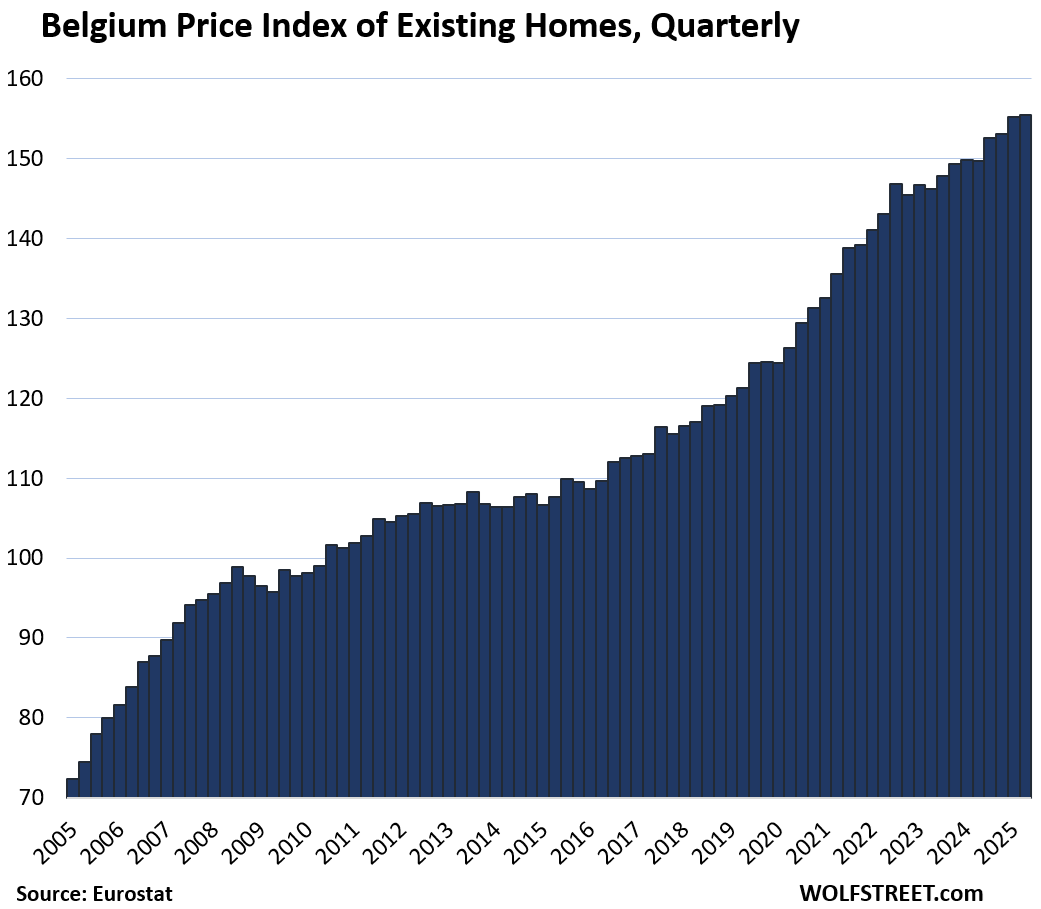
| Belgium, Prices of Existing Homes | |||
| Since 2010 | QoQ | YoY | |
| 59% | 0.2% | 3.8% | |
| Sweden, Prices of Existing Homes | |||
| Since 2010 | QoQ | YoY | From peak |
| 89% | 0.4% | 1.7% | -6.9% |
Also back to 2021.
| Ireland, Prices of Existing Homes | |||
| Since 2010 | QoQ | YoY | |
| 80% | 1.4% | 8.8% | |
| Norway, Prices of Existing Homes | |||
| Since 2010 | QoQ | YoY | |
| 115% | 1.4% | 4.8% | |
| Austria, Prices of Existing Homes | |||
| Since 2010 | QoQ | YoY | From peak |
| 123% | 1.7% | 1.7% | -5.6% |
The index is also back where it had first been been in Q1 2022.
| Denmark, Prices of Existing Homes | |||
| Since 2010 | QoQ | YoY | |
| 69% | 1.7% | 7.3% | |
| Romania, Prices of Existing Homes | |||
| Since 2010 | QoQ | YoY | |
| 26% | 0.7% | 6.4% | |
| Czech Republic, Prices of Existing Homes | |||
| Since 2010 | QoQ | YoY | |
| 152% | 2.5% | 9.5% | |
| Finland, Prices of Existing Homes | |||
| Since 2010 | QoQ | YoY | From peak |
| 1% | 1.7% | -1.6% | -13.2% |
The index is back to where it had first been in 2010, essentially not having gone anywhere in 15 years.
| Portugal, Prices of Existing Homes | |||
| Since 2010 | QoQ | YoY | |
| 151% | 5.1% | 18.3% | |
Enjoy reading WOLF STREET and want to support it? You can donate. I appreciate it immensely. Click on the mug to find out how:

![]()
In Italy, location matters even more than it typically does in the US. In areas like Tuscany, Florence and the prime countryside around it, prices never appeared to even fall. And now they appear to be well into the ATH category. Similar for places with high name recognition like Milan, Amalfi, etc. It’s always difficult to tell, given no clean Zillow/Redfin, etc., but you can get a pretty good idea from their sites and broker sites showing listings that have sold.
Other areas, “off the run” to use a fixed income term, are way down, and some areas with withering populations literally worthless (the 1EUR deals are not “deals”).
Obviously, differences in local housing markets are rule in all country-wide indices, including in the US.
Wonder if all or any of these countries have 30 yrs fixed, would any of the charts look more favorbly to current decline?
Varies dramatically from country to country. Generally, the US standard 30-year mortgage with a rate that remains fixed for 30 years and without pre-payment penalty is rare. But there is a great variety of other mortgages. The most common mortgages have either shorter terms such as 10 or 20 years, and some of those have rates that are adjustable at some point in the future. Variable rate mortgages are common.
I wonder if European wages have kept up….
In Italy, no. Real wages are about 2% lower than 20 years ago.
I tend to think that Europe is older than the US and not particularly trustworthy.
yup 30 years is a rare beast around the world, kind of similar to how Prop 13 is a rare thing in the world of property tax, both can have a myriad of downstream impact.
We kind of know the fundamental drivers for the current US housing bubble (lowest mortgage rates in history during CV19 era, MBS..etc) Are there one common theme for the EU that drove up most these markets to insanity level again? Can’t be population growth or even foreign investors right?
Wolf, sorry this is off topic, just a quick update..
The circular financing in AI industrial complex continues unabated. This time it’s OpenAI and AMD. They are not even promising non-existing $Billions this time, just some sort of stock swap. AMD was up 35% at one time today.
I’m beginning to think by the time this is all said and done, Sam Altman is going to make Sam Bankman-Friedman look like a choirboy.
Started small position in triple-short semiconductors etf SOXS today.
Yes, and what’s funny (or scary) about these deals is that they cause stock prices to jump like this. I mean, it’s just hocus-pocus money they’re announcing, and WOOSH goes the stock.
Right you are.
Nvidia + Broadcom + AMD + TSMC = $8 Trillion
Combined revenue is $350B (with AI mania already in these sales). And of course TSMC just sells to the other three, so real new sales are $240B-ish.
So we’re talking 30+ p/s on $8 Trillions of “value”. Back of a napkin math. Has to be a record of sorts, I won’t even ask AI about it.
I wouldn’t even care if the AI nonsense just led to an AI investor crash. But at this point, I think it has the potential to bring down the world economy, as too much is riding on it.
TSonder305,
“…bring down the world economy…”
sounds a little harsh.
But I do think that we will get a recession in the US about a year after the AI investment bubble begins to slow and stocks begin to tank, that was the timing of the Dotcom Bubble and Dotcom Bust. After this investment bubble ends, along with stocks ratcheting down, over a multiyear period, like they did during the Dotcom Bust (Nasdaq -78% by Sep 2002), a recession is just about inevitable. That’s how business cycles evolve over time.
As was the case during the Dotcom Bust, banks aren’t heavily involved here. These are largely investor funds that would get creamed, and only to a small extent bank funds, and so the Fed can just sit there and watch markets and investments return to normal, while cutting short-term rates some as it would for any run-of-the-mill recession, like it did in late 2000 through May 2004, when it cut all the way to 1.0% and was criticized for having cut too much…. It started hiking again in July 2004, eventually to 5.25%.
Actually it’s 39% up at of day…yup totally normal here, nothing to see, welcome to our new norm….as Lisa Su said “AI critics are ‘thinking too small’ after massive OpenAI deal” I would argue if Lisa is wanting to think bigger, then she is already behind just jumping onto AI bandwagon, she would be better off dreaming up the next undiscovered hype. Kind of like coming up with AI wetdream when Crypto mining mania was just at its peak…
The other thing is the narratives aren’t even internally consistent. If this deal was a gamechanger for AMD and AI, shouldn’t NVDA have plummeted? After all, there is a finite amount of money to be spent on AI.
But no. It’s all priced as though there is no limit, and that every company can end up on top.
Looks like a good time to dump anything that isn’t nailed down in the EU and go to cash outside the EU to wait it out.
One thing pretty uniform in the charts is the explosion in price action correlates to unbridled money printing.
I think the charts will look MUCH different in 2028 as the Euro accelerates its implosion as the war goes hot in European NATO theater. The elites MUST have the ‘cover for action’ for of war, whereas they can blame their default on Russia.
I watch capital flows on a daily basis as part of my work managing capital for a wealth fund. France is likely to be the initial contagion that makes the whole of the EU catch a bad flu.
I am not worried. The ECB will bring back home prices to new record levels. Cutting, cutting is the old-new mantra, and wither the inflation. The only question is, which country will be the canary in the coal mine.
Biggest price gains since 2010:
6. Sweden: +103%
8. Sweden: +89%
Are you talking North Sweden & South Sweden or West & east Sweden?!
Thanks. That first Sweden went astray and ended up where it didn’t belong.
No wonder the Portuguese have had enough. Salaries have risen something like 10% in the past 10 years. Austerity dug a hug hole in the charts post-GFR. Golden visas, being the nouveau retirement destination, and unfettered migration is not being kind to the average resident there. The new right-of-center party there, Chega! (literally ‘Enough!’) went from no seats in 2018 to over 20% of the parliament today over this animosity.