Germany, France, Italy, Spain, Netherlands, Poland, Belgium, Sweden, Ireland, Austria, Norway, Denmark, Romania, Czech Republic, Finland, Portugal.
By Wolf Richter for WOLF STREET.
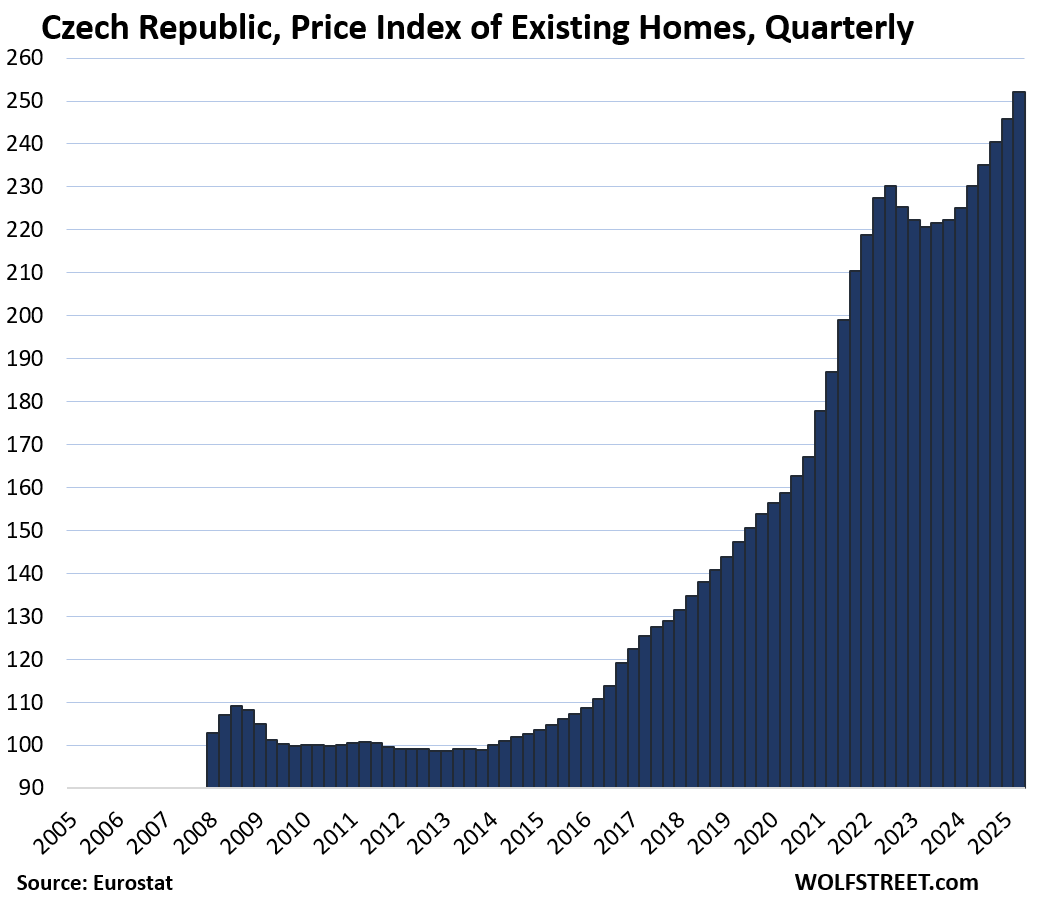
Prices of existing homes of all types (“dwellings”) in the 16 largest countries in the European Union (EU) or in the European Economic Area (EEA) by GDP have varied substantially. Some of these countries have splendid housing bubbles. While prices of a few of them have deflated some, in others, prices continued to explode, such as in the Czech Republic, where prices have spiked by 155% in 11 years.
Some countries had the most splendid housing bubbles 15 or more years ago, which then imploded with dramatic effects, only to reignite again.
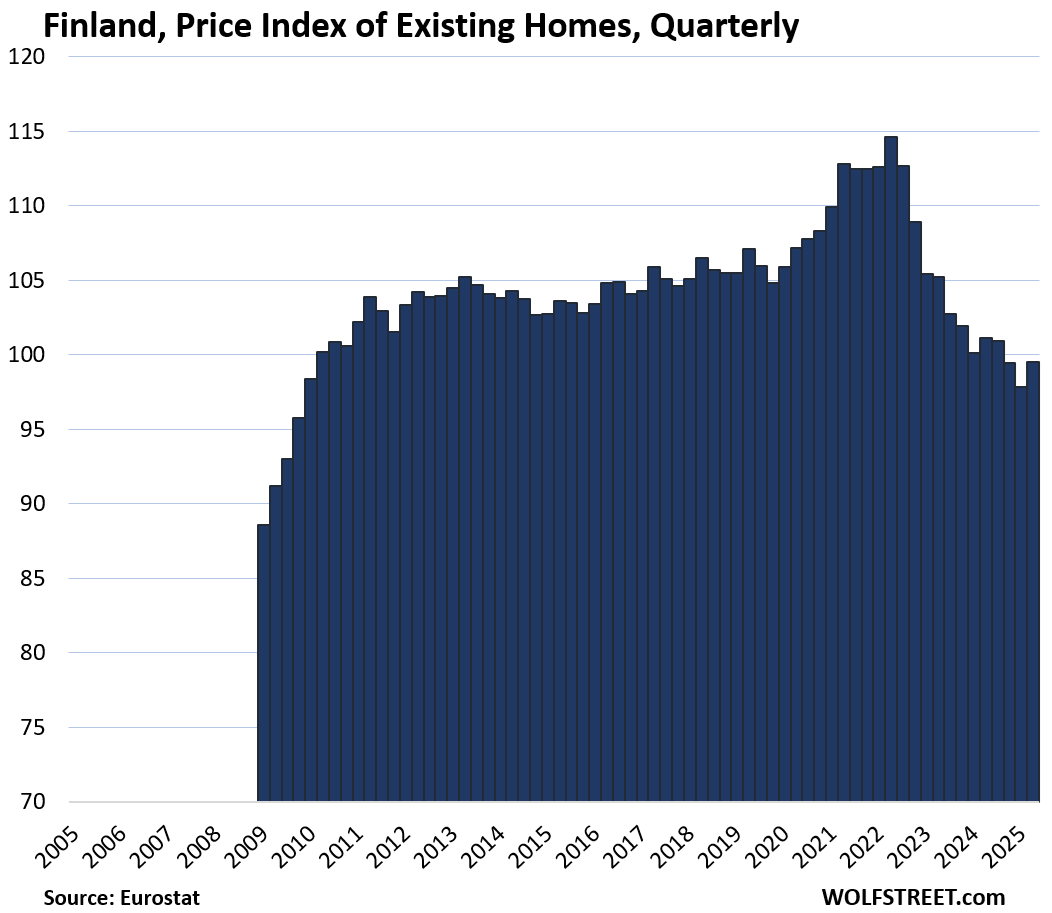
In one (Finland), home prices have fallen back where they’d been in 2010. In another (Italy), prices are still well below 2010 though they’re surging now. And in another (Spain), prices just now rose above the prior bubble peak 18 years ago, whose dramatic implosion had shaken the country.
So a wild ride across the spectrum, with the most recent iteration reported by Eurostat through Q2 on Friday. The data goes back to 2005 for some countries, and less far for other countries.
Biggest price declines from the peak, and year of peak:
- Finland: -13.2% from Q2 2022, back to 2010 levels.
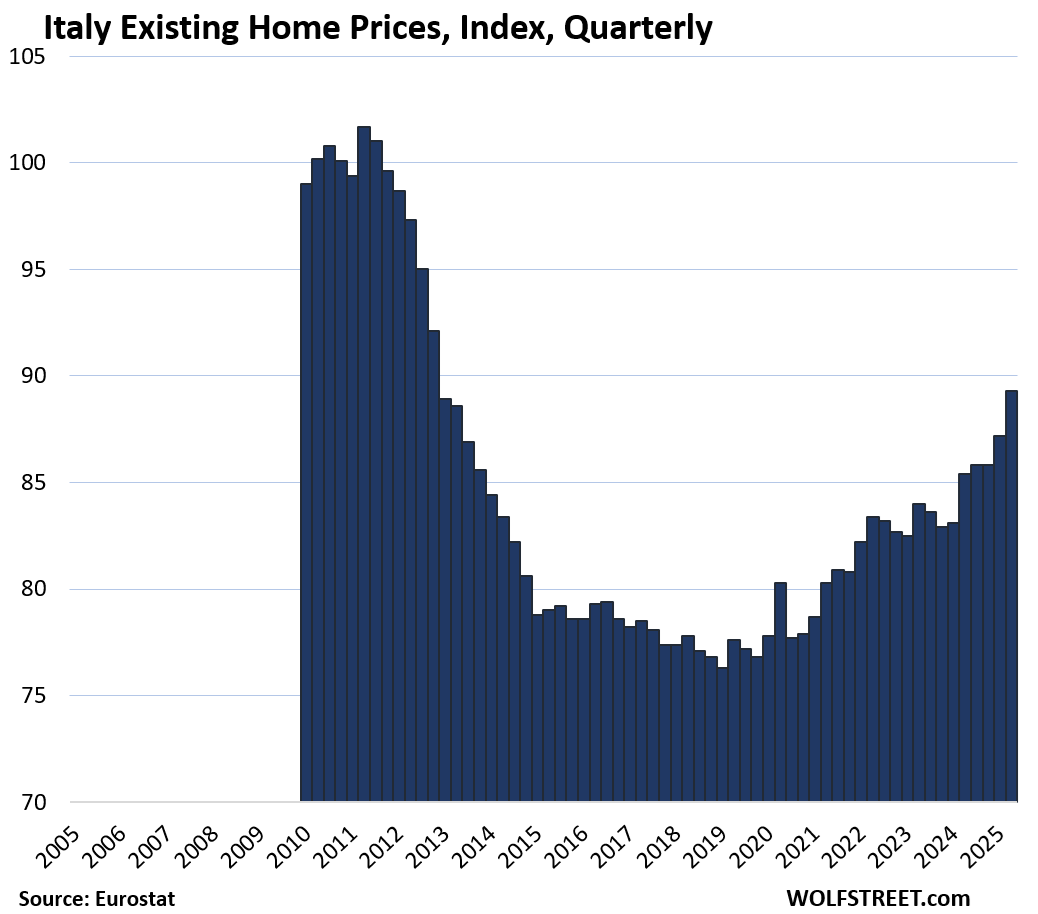
- Italy: -12.2% from Q2 2011, still, despite a 5-year price surge
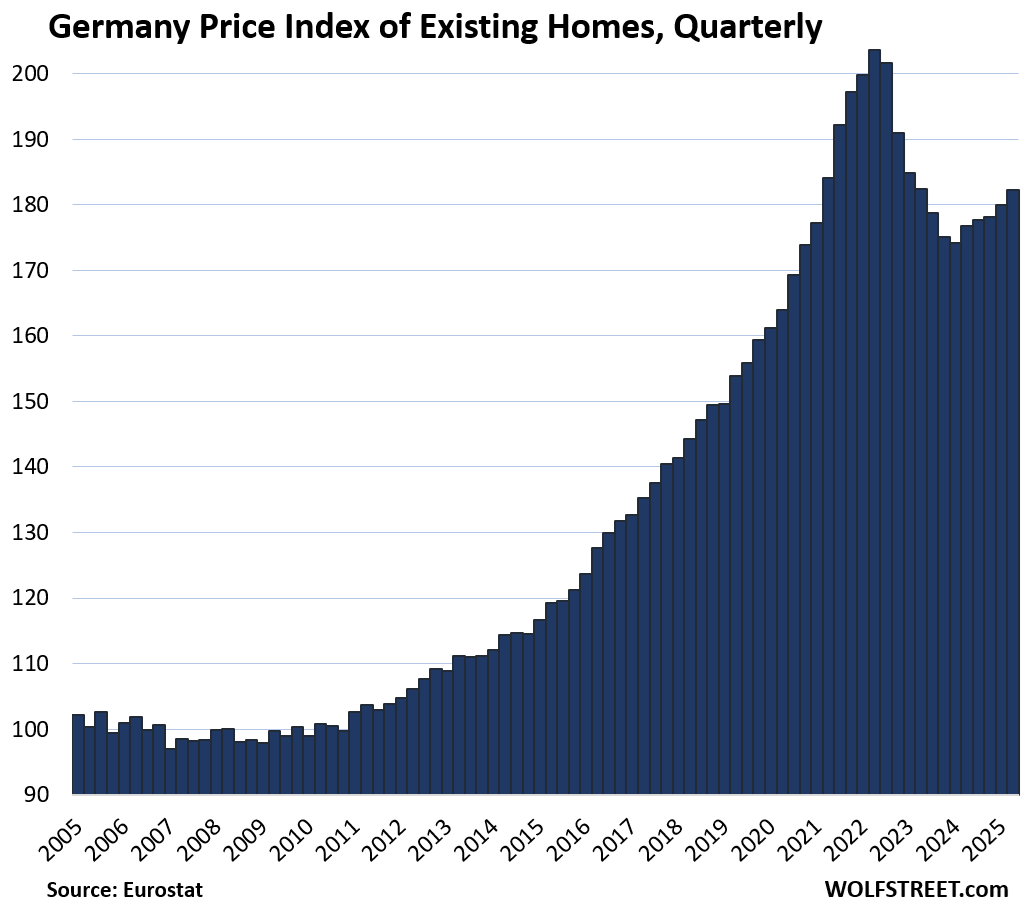
- Germany: -10.5% from Q2 2022
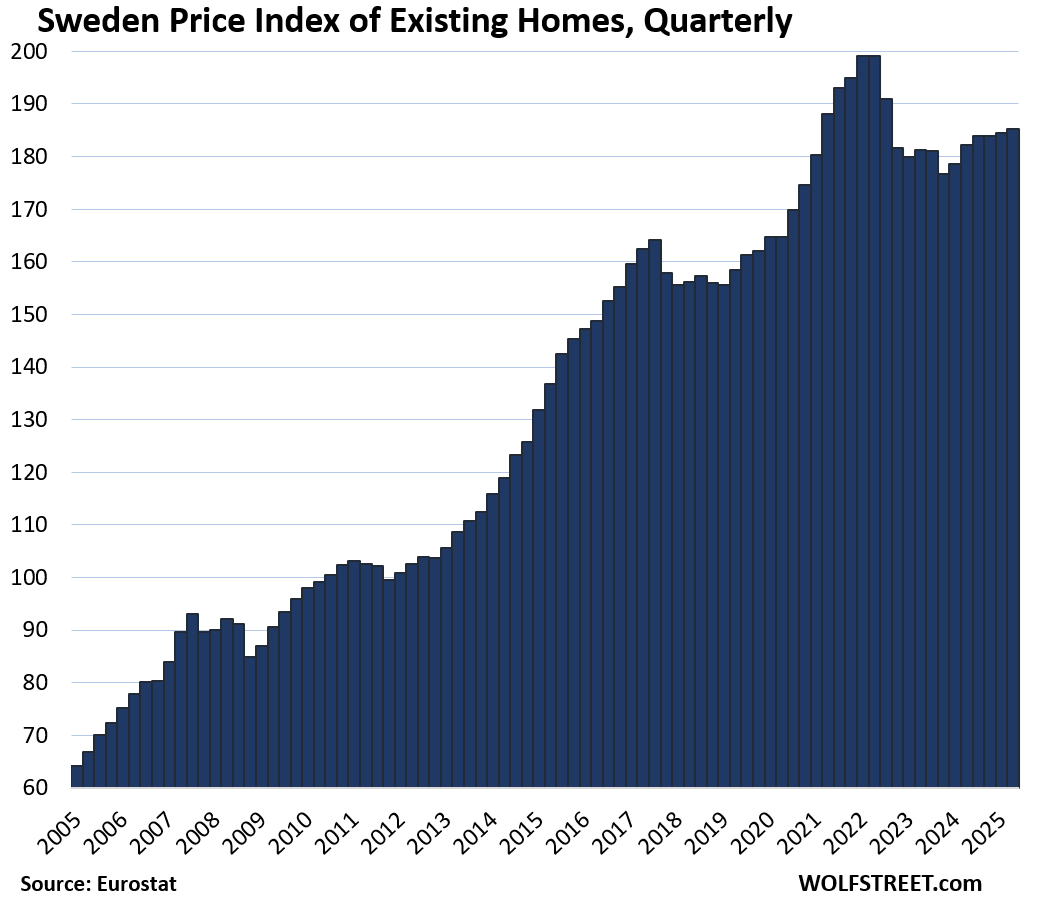
- Sweden: -6.9% from Q2 2022
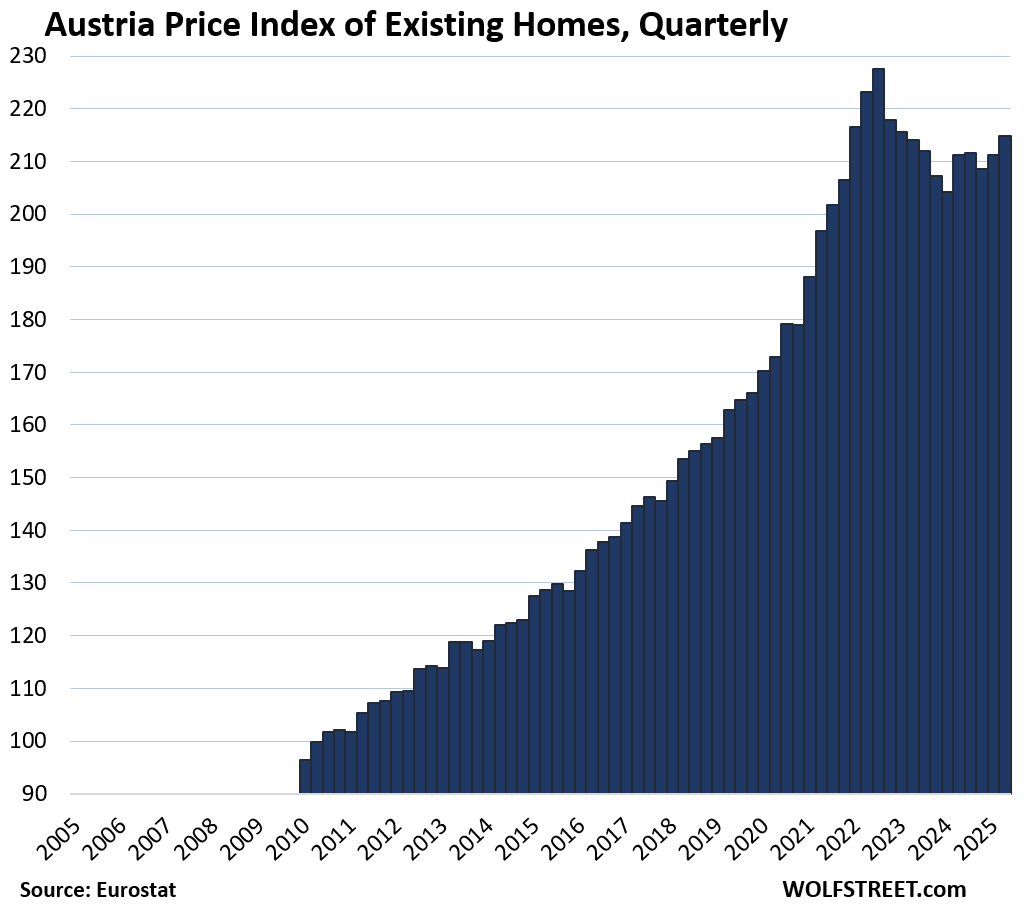
- Austria: -5.6% from Q3 2022
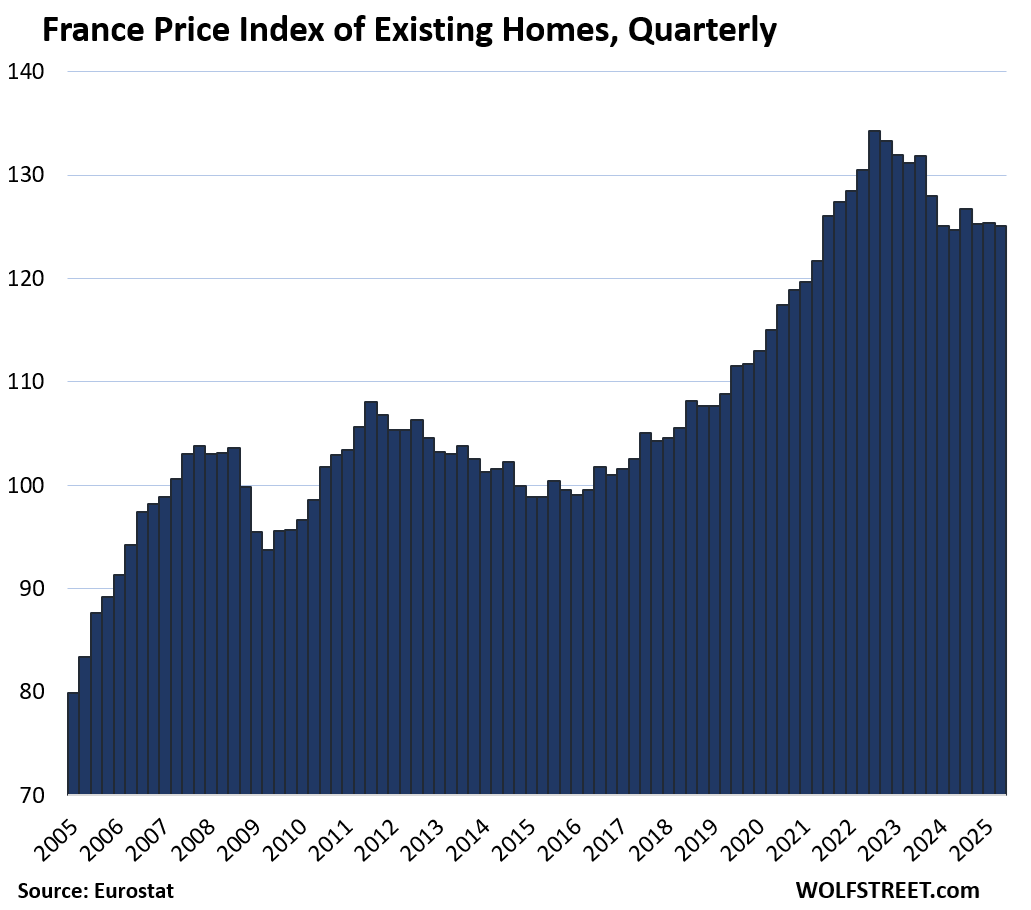
- France: -6.8% from Q3 2022
Biggest price gains since 2010:
- Czech Republic: +152%
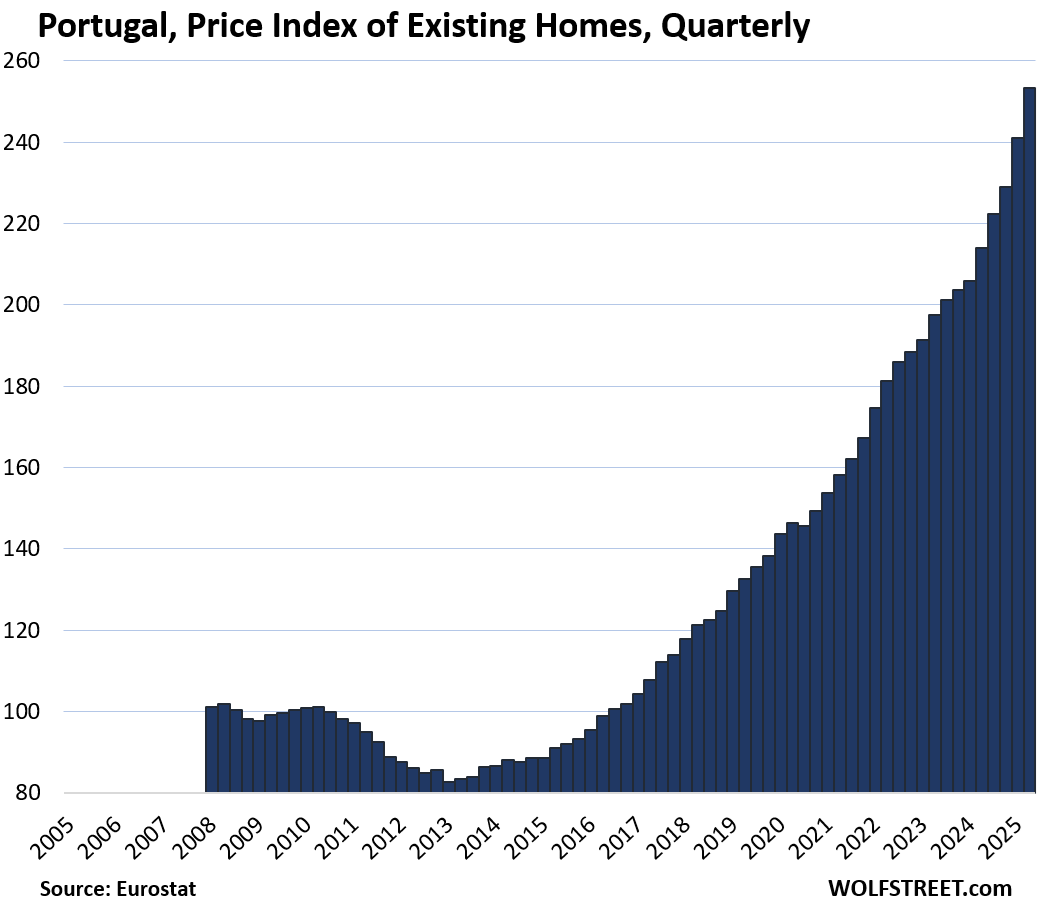
- Portugal: +151%
- Austria: +123%
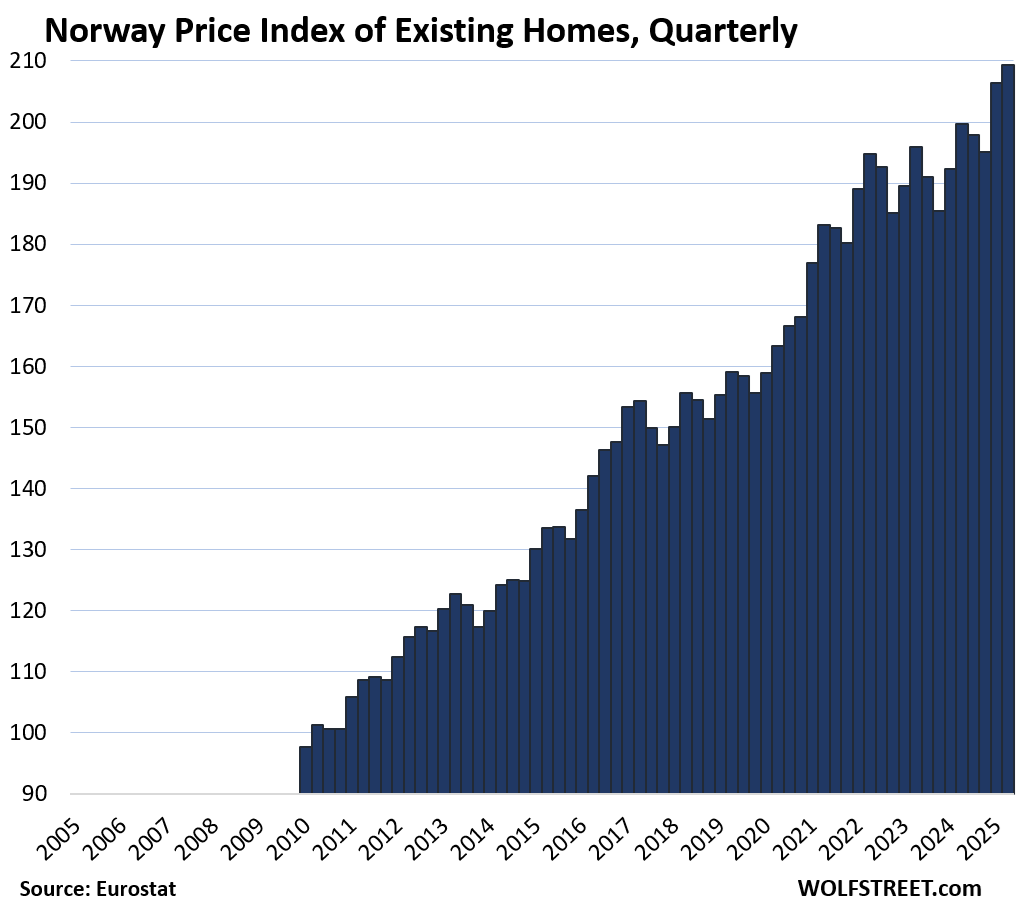
- Norway: +114%
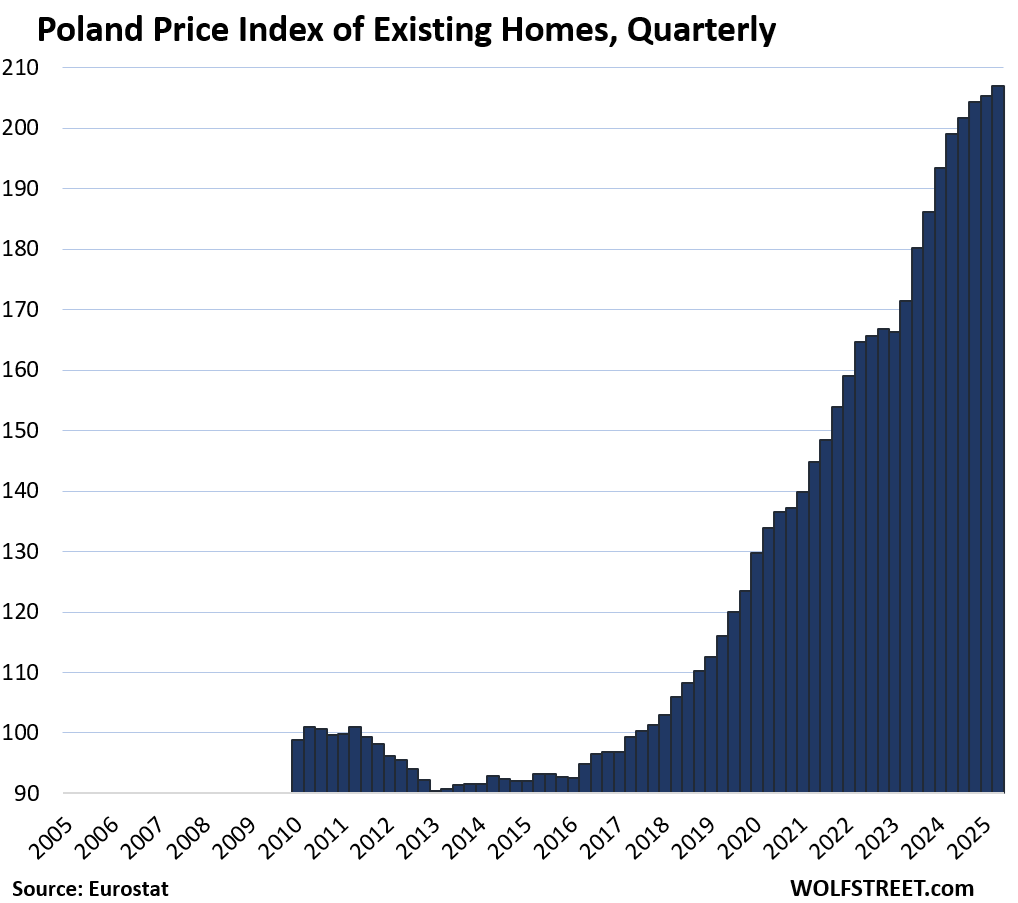
- Poland: +109%
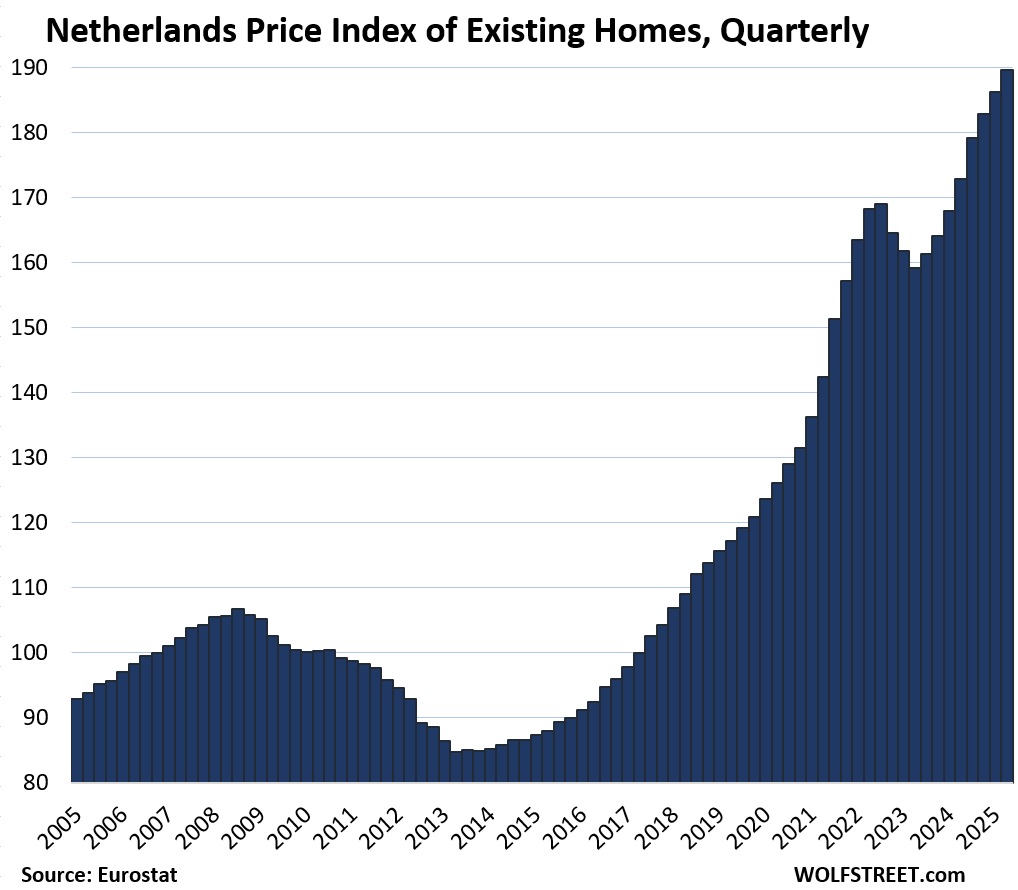
- Netherlands: +89%
- Sweden: +89%
- Germany: +84%
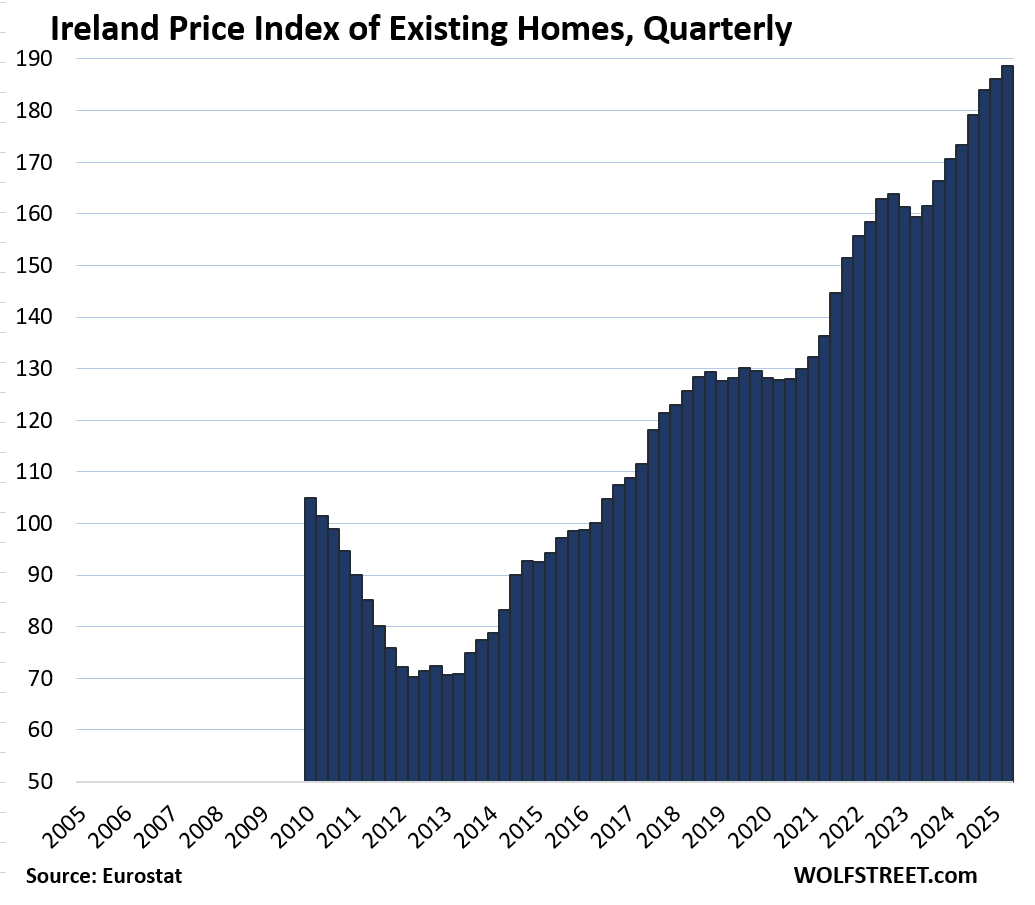
- Ireland: +79%.
Biggest year-over-year gains:
- Portugal: +18.3%
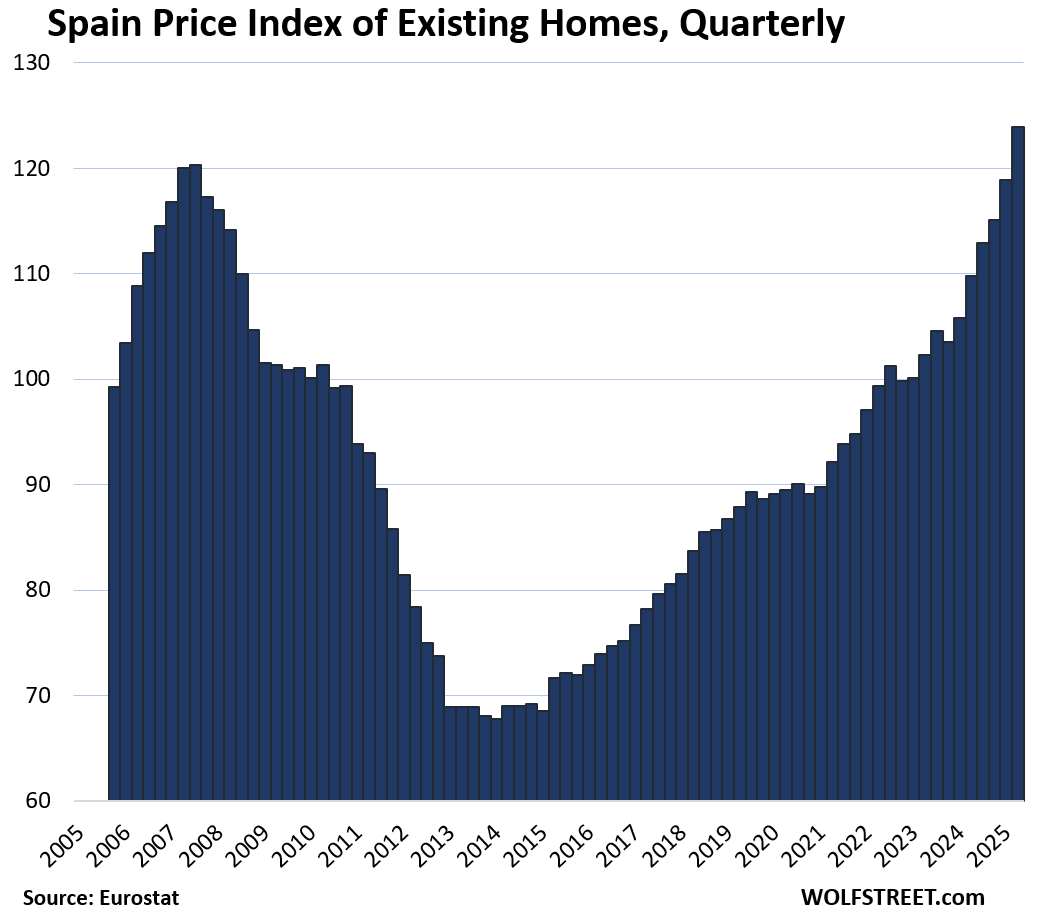
- Spain: +12.9%
- Netherlands: +9.7%
- Czech Republic: +9.5%
- Ireland: +8.8%
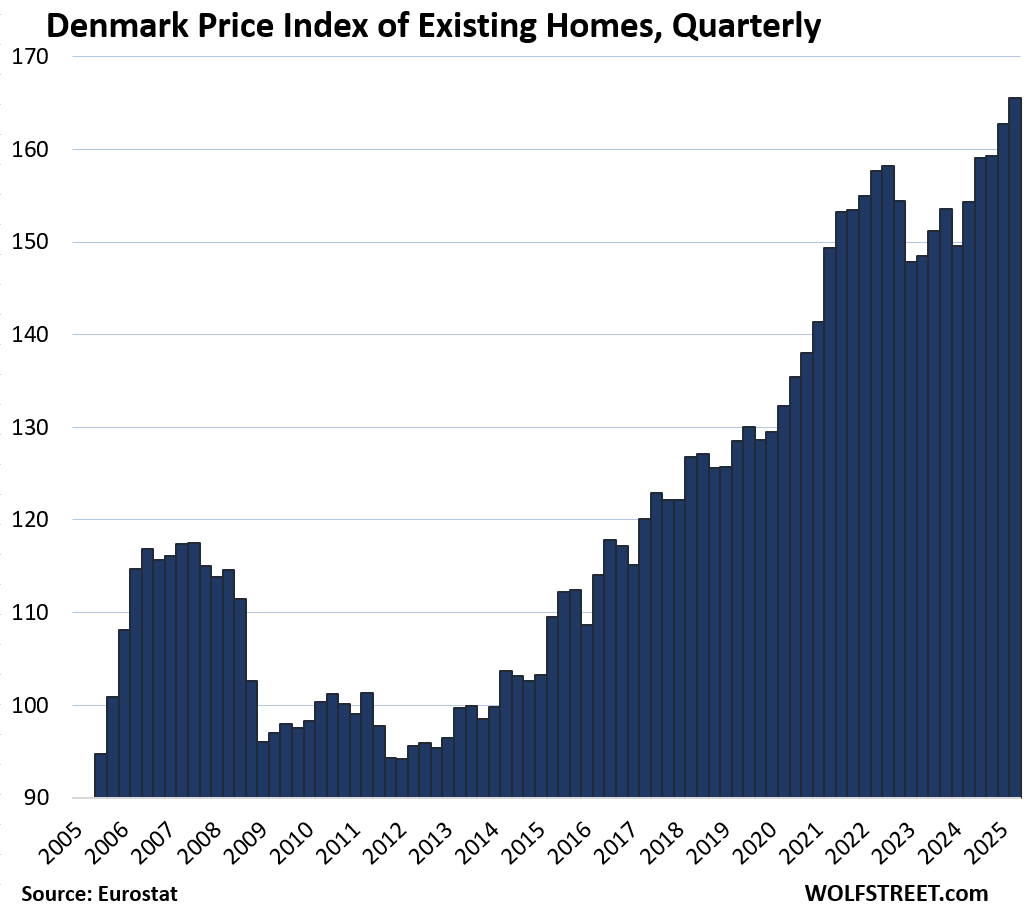
- Denmark: +7.3%
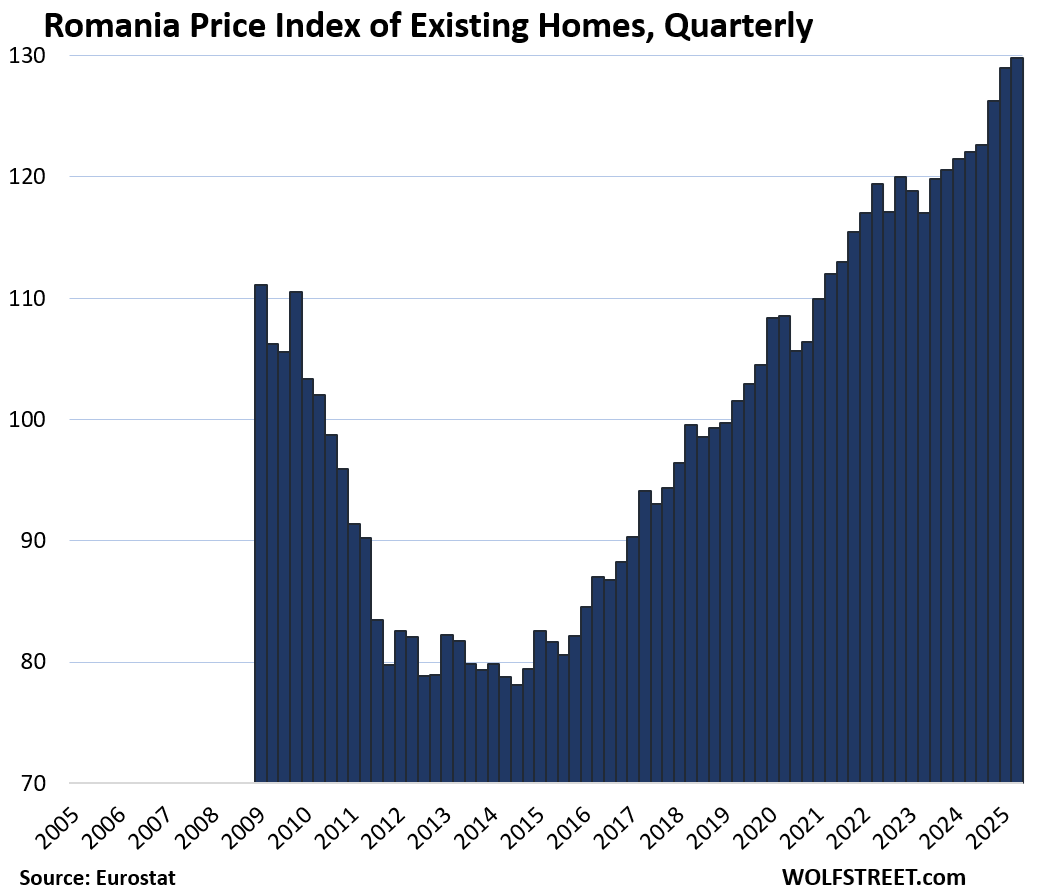
- Romania: +6.4%
Biggest quarter-over-quarter gains:
- Portugal: +5.1%
- Spain: +4.2%
- Czech Republic: +2.5%
- Italy: +2.4%.
The home price indices for the 16 largest countries in the EU or EEA:
The little tables show either three or four columns, from left to right: % change since 2010; quarter-over-quarter (QoQ) % change; year-over-year (YoY) % change; and % decline from the peak, if applicable.
| Germany, Prices of Existing Homes | |||
| since 2010 | QoQ | YoY | From peak |
| 84% | 1.2% | 3.1% | -10.5% |
The index is where it had been in 2021.
| France, Prices of Existing Homes | |||
| Since 2010 | QoQ | YoY | From peak |
| 29% | -0.2% | 0.3% | -6.8% |
Where prices had been in 2021.
| Italy, Prices of Existing Homes | |||
| Since 2010 | QoQ | YoY | From peak |
| -10% | 2% | 4.6% | -12.2% |
The recovery started during the pandemic. Eurostat’s data for Italy only goes back to 2010.
| Spain, Prices of Existing Homes | ||
| Since 2010 | QoQ | YoY |
| 24% | 4.2% | 12.9% |
For the first time above the peak 18 years ago.
| Netherlands, Prices of Existing Homes | |||
| Since 2010 | QoQ | YoY | |
| 89% | 1.8% | 9.7% | |
| Poland, Prices of Existing Homes | |||
| Since 2010 | QoQ | YoY | |
| 109% | 0.8% | 4.0% | |
The Eurostat data for Poland begins in 2010.
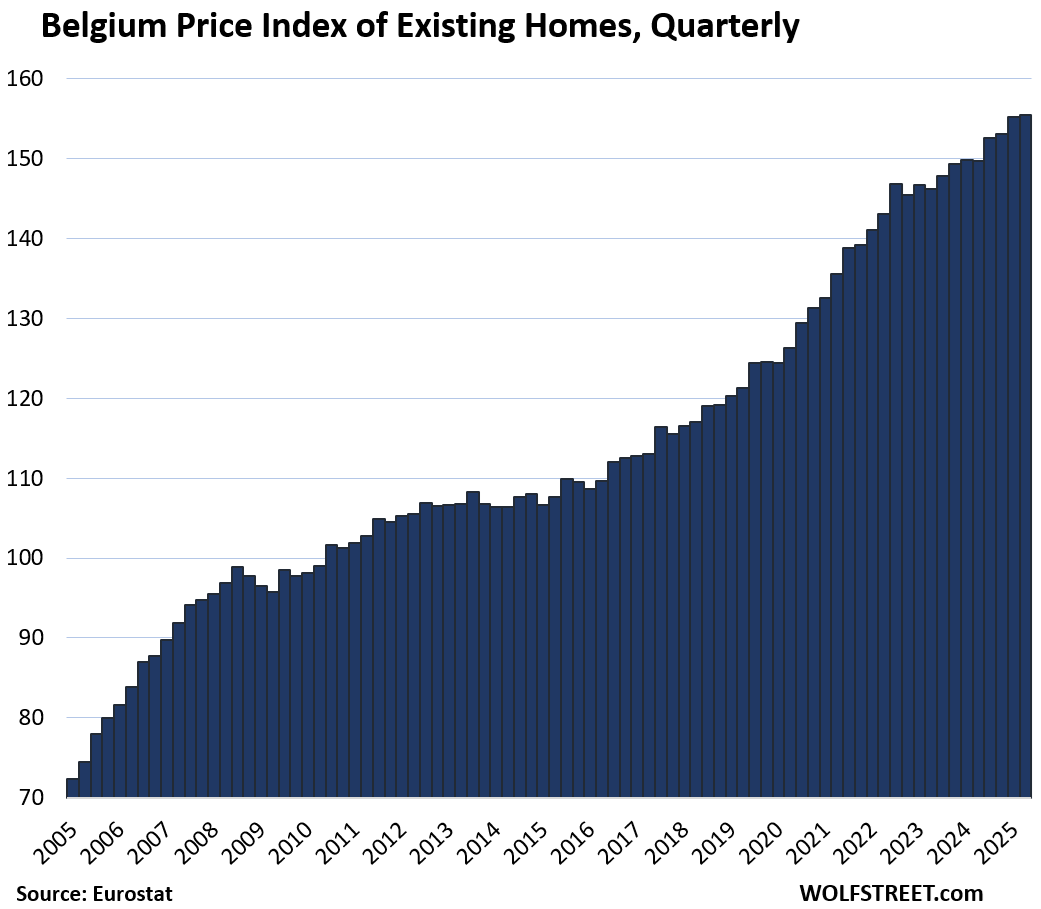
| Belgium, Prices of Existing Homes | |||
| Since 2010 | QoQ | YoY | |
| 59% | 0.2% | 3.8% | |
| Sweden, Prices of Existing Homes | |||
| Since 2010 | QoQ | YoY | From peak |
| 89% | 0.4% | 1.7% | -6.9% |
Also back to 2021.
| Ireland, Prices of Existing Homes | |||
| Since 2010 | QoQ | YoY | |
| 80% | 1.4% | 8.8% | |
| Norway, Prices of Existing Homes | |||
| Since 2010 | QoQ | YoY | |
| 115% | 1.4% | 4.8% | |
| Austria, Prices of Existing Homes | |||
| Since 2010 | QoQ | YoY | From peak |
| 123% | 1.7% | 1.7% | -5.6% |
The index is also back where it had first been in Q1 2022.
| Denmark, Prices of Existing Homes | |||
| Since 2010 | QoQ | YoY | |
| 69% | 1.7% | 7.3% | |
| Romania, Prices of Existing Homes | |||
| Since 2010 | QoQ | YoY | |
| 26% | 0.7% | 6.4% | |
| Czech Republic, Prices of Existing Homes | |||
| Since 2010 | QoQ | YoY | |
| 152% | 2.5% | 9.5% | |
| Finland, Prices of Existing Homes | |||
| Since 2010 | QoQ | YoY | From peak |
| 1% | 1.7% | -1.6% | -13.2% |
The index is back to where it had first been in 2010, essentially not having gone anywhere in 15 years.
| Portugal, Prices of Existing Homes | |||
| Since 2010 | QoQ | YoY | |
| 151% | 5.1% | 18.3% | |
Enjoy reading WOLF STREET and want to support it? You can donate. I appreciate it immensely. Click on the mug to find out how:

![]()
In Italy, location matters even more than it typically does in the US. In areas like Tuscany, Florence and the prime countryside around it, prices never appeared to even fall. And now they appear to be well into the ATH category. Similar for places with high name recognition like Milan, Amalfi, etc. It’s always difficult to tell, given no clean Zillow/Redfin, etc., but you can get a pretty good idea from their sites and broker sites showing listings that have sold.
Other areas, “off the run” to use a fixed income term, are way down, and some areas with withering populations literally worthless (the 1EUR deals are not “deals”).
Obviously, differences in local housing markets are rule in all country-wide indices, including in the US.
It also depends on what you want if your goal is to find a place to live independent of investment value. I am in northern Veneto in a gem of a town where prices are a fraction of those in Tuscany, Florence, Milano, and Amalfi, to name the places you mentioned, which hold little charm for me.
Florence, and its surrounds, all good. The rest, agreed. But I’m more of a Puglia, NW Sicily, Naples kind of guy myself.
Wonder if all or any of these countries have 30 yrs fixed, would any of the charts look more favorbly to current decline?
Varies dramatically from country to country. Generally, the US standard 30-year mortgage with a rate that remains fixed for 30 years and without pre-payment penalty is rare. But there is a great variety of other mortgages. The most common mortgages have either shorter terms such as 10 or 20 years, and some of those have rates that are adjustable at some point in the future. Variable rate mortgages are common.
I wonder if European wages have kept up….
In Italy, no. Real wages are about 2% lower than 20 years ago.
I tend to think that Europe is older than the US and not particularly trustworthy.
yup 30 years is a rare beast around the world, kind of similar to how Prop 13 is a rare thing in the world of property tax, both can have a myriad of downstream impact.
We kind of know the fundamental drivers for the current US housing bubble (lowest mortgage rates in history during CV19 era, MBS..etc) Are there one common theme for the EU that drove up most these markets to insanity level again? Can’t be population growth or even foreign investors right?
well in spain 20% of the sales in the first semester of 2024 were from foreign investors.
so maybe they help a little.
same for rates here, we did not have the raise in rates from zero to 5-7 % as US had. We were more between 0 to 3, maybe 4 but now they are again in the 2-3% range.
Drivers? inflación, mucha inflación y los marineros borrachos
Wolf, sorry this is off topic, just a quick update..
The circular financing in AI industrial complex continues unabated. This time it’s OpenAI and AMD. They are not even promising non-existing $Billions this time, just some sort of stock swap. AMD was up 35% at one time today.
I’m beginning to think by the time this is all said and done, Sam Altman is going to make Sam Bankman-Friedman look like a choirboy.
Started small position in triple-short semiconductors etf SOXS today.
Yes, and what’s funny (or scary) about these deals is that they cause stock prices to jump like this. I mean, it’s just hocus-pocus money they’re announcing, and WOOSH goes the stock.
Right you are.
Nvidia + Broadcom + AMD + TSMC = $8 Trillion
Combined revenue is $350B (with AI mania already in these sales). And of course TSMC just sells to the other three, so real new sales are $240B-ish.
So we’re talking 30+ p/s on $8 Trillions of “value”. Back of a napkin math. Has to be a record of sorts, I won’t even ask AI about it.
I wouldn’t even care if the AI nonsense just led to an AI investor crash. But at this point, I think it has the potential to bring down the world economy, as too much is riding on it.
TSonder305,
“…bring down the world economy…”
sounds a little harsh.
But I do think that we will get a recession in the US about a year after the AI investment bubble begins to slow and stocks begin to tank, that was the timing of the Dotcom Bubble and Dotcom Bust. After this investment bubble ends, along with stocks ratcheting down, over a multiyear period, like they did during the Dotcom Bust (Nasdaq -78% by Sep 2002), a recession is just about inevitable. That’s how business cycles evolve over time.
As was the case during the Dotcom Bust, banks aren’t heavily involved here. These are largely investor funds that would get creamed, and only to a small extent bank funds, and so the Fed can just sit there and watch markets and investments return to normal, while cutting short-term rates some as it would for any run-of-the-mill recession, like it did in late 2000 through May 2004, when it cut all the way to 1.0% and was criticized for having cut too much…. It started hiking again in July 2004, eventually to 5.25%.
Wolf, I agree with this that the banks aren’t exposed, so the Fed can in theory sit by and wait. The problem is I believe that a lot of our economic activity is “wealth effect” spending and the reduction in spending by the people with a lot of tech stocks will cause a nasty recession. I also don’t remember in 2000 the media being all in on wealth effect and pump the stock market, so the pressure on Congress and the Fed to “do something” when the S&P drops by 50% will be enormous.
The average American won’t be as affected, but the media does a great job in making John Q. Public think that as goes the stock market, as goes his job and livelihood.
The Fed could just sit back and let the investment bubble sort itself out, but memories of 1929 when they tried to do just that will interfere.
More importantly, the Fed has bailed out the American economy and currency enough times now that most Americans believe it is their job to do so, and that any recession represents a failing. Now that the Fed is under political manipulation, they will be pressured to “do something!!!” to make the stocks and jobs numbers go back up around elections.
The Fed put is why we’re so eager to trade our dollars for shares. The dollar will decline, but the shares have the full faith and credit of the US government.
Chris B, exactly.
It’s not just stocks, but everything. Why are people paying $4,000 an ounce for gold? Why are people paying $125,000 for a Bitcoin? Why are people paying $1,000,000 for small houses?
People don’t trust the Fed. Whether or not that’s justified is up for debate, but the next crisis is going to be a big challenge for the Fed, as they’ll have enormous pressure to “do something” all while they have to prevent the bond market from blowing out.
TSonder305
nothing to do with “trust” in the Fed. Most Americans don’t even know what the Fed is and what it does. But people DO want to make money, and they LOVE manias and scams because that’s where the money is, and so they love to participate in manias and scams… stocks (such as meme stocks, penny stocks, AI stocks, IPOs, SPACs, latest-fad stocks, etc.), cryptos, bonds, gold, silver, real estate, NFTs… everyone chooses their own mania and scam that they want to get rich on. That’s the American Dream.
Fair point. Maybe most Americans don’t know about the Fed, but it seems like many investors, both individual and institutional, are investing based on the “Fed put,” which motivates other, less sophisticated people, to also get in on the mania.
It is true that manias have existed for centuries, but the unwavering belief in Congress and the Fed to fix any problems seems to be new, at least to me.
I read an interesting article a day or two ago that said they’re beginning to see connections between video games that have a certain type of reward system and risk-taking among those game players as they get older.
Something to do with how the brain is wired to reward a certain type of activity.
It is leading to a substantially higher amount of risk taking activity/gambling addiction problems in younger adults who grew up playing video games like fortnight and stuff like that. From there you can see how it translates to risky investing strategies…
Just another way that society is screwing up the next generation or two of kids, I guess.
See I think Americans have come to trust the Fed *more* not less. We trust them to come to the rescue when the politicians we vote for screw things up, and we fully expect monetary actions to save our jobs and portfolios.
If we didn’t have trust in the “Fed put” we wouldn’t be bidding asset prices so high, and we’d be buying TIPS or hiding out in cash. E.g. what would you do if you knew the Fed would do nothing in the next crisis? There is no political ideology in the US that thinks the Fed should do nothing.
I dont think the Fed or Congress is fixing anything or bailing anything out as I dont think bubble asset prices support the long term stability or prosperity of a country. I think theyre instead causing a lot of unnecessary waste and damage. The economy would have a chance to grow in a healthy way if all the malinvestment crashed and wasnt rescued. Hopefully our country and liberty can survive the financial drug fixes.
Actually it’s 39% up at of day…yup totally normal here, nothing to see, welcome to our new norm….as Lisa Su said “AI critics are ‘thinking too small’ after massive OpenAI deal” I would argue if Lisa is wanting to think bigger, then she is already behind just jumping onto AI bandwagon, she would be better off dreaming up the next undiscovered hype. Kind of like coming up with AI wetdream when Crypto mining mania was just at its peak…
The other thing is the narratives aren’t even internally consistent. If this deal was a gamechanger for AMD and AI, shouldn’t NVDA have plummeted? After all, there is a finite amount of money to be spent on AI.
But no. It’s all priced as though there is no limit, and that every company can end up on top.
Wolf, another great article and discussion. Thanks
Kind of reminds me of that saying, the bigger they are, or the harder they come, the harder they fall. Probably some of the mag 7 and other high flyers will fade in time like some of the nifty fifty. Currently at all time high valuations according to Hussman’s measure.
Looks like a good time to dump anything that isn’t nailed down in the EU and go to cash outside the EU to wait it out.
One thing pretty uniform in the charts is the explosion in price action correlates to unbridled money printing.
I think the charts will look MUCH different in 2028 as the Euro accelerates its implosion as the war goes hot in European NATO theater. The elites MUST have the ‘cover for action’ for of war, whereas they can blame their default on Russia.
I watch capital flows on a daily basis as part of my work managing capital for a wealth fund. France is likely to be the initial contagion that makes the whole of the EU catch a bad flu.
That wouldn’t make a lot of sense.
For commercial real estate perhaps, but that’s not what Wolfs charts were about.
For homes or dwellings, you can’t compare the US market and it’s buble to the sum of the European markets. People don’t migrate from country to country as they would from state to state, and many of these bubbles are offset or sustained by country specific dynamics. For example Italy struggles mainly with the growing divide between cities & rural areas, much like Japan, so average country prices are skewed down by hundreds of thousands of empty homes in the countryside. Spain & Portugal are currently climbing hard out of an economic downturn, but the big cities are plagued by foreign investors buying up appartments and driving up the prices. UK is struggling keeping amenity standards up in the countryside, while the city of London is literally completely being bought up by internationals (primarily Honkong, but UAE is rapidly expanding last few years). The Netherlands is struggling with emision restrictions and other regulatory red-tape slowing down building projects.
Meanwhile, the EU has already brought central rates down further than the US as the inflation peak from Covid has passed in almost all countries. So mortgage rates are stable between 3 & 4.5% depending on your location.
They already have the flu. Greece, Italy, France, and Spain in that order have borrowed way over 100 percent of GDP. But we have borrowed more than 100 percent of GDP. So is this the new normal? No wonder gold has doubled in price recently.
I am not worried. The ECB will bring back home prices to new record levels. Cutting, cutting is the old-new mantra, and wither the inflation. The only question is, which country will be the canary in the coal mine.
Biggest price gains since 2010:
6. Sweden: +103%
8. Sweden: +89%
Are you talking North Sweden & South Sweden or West & east Sweden?!
Thanks. That first Sweden went astray and ended up where it didn’t belong.
Reminds me of the top ten list of reasons to follow Arkansas when they left the old SW Conference for the SEC.
6. Have you seen the Tennessee cheerleaders.
10. Have you seen the Tennessee cheerleaders.
No wonder the Portuguese have had enough. Salaries have risen something like 10% in the past 10 years. Austerity dug a hug hole in the charts post-GFR. Golden visas, being the nouveau retirement destination, and unfettered migration is not being kind to the average resident there. The new right-of-center party there, Chega! (literally ‘Enough!’) went from no seats in 2018 to over 20% of the parliament today over this animosity.
Right wing party Chega has nothing to do with real estate… just disinformation… the fact that you speak of golden visa, which comes from 2023, 540 M invested, in a total of 34Bilion transaction, really can’t get how come this make a change in real estate prices… you should get to numbers and info… golden visa was only applicable in Lisbon and Porto, every city in Portugal had a huge rise, what’s the relation here???
Has nothing to do other golden visa, and CHEGA is just a party anti-woke movement, which comes trying to fix the mess that socialist ideas had brought financially, economically, and for the last, socially for the people.
So you’re saying that golden visa was only for Lisbon and Porto, and that didn’t have a ripple effect on other cities?
You learn something new every day.
Golden Visa applied everywhere in Portugal, commercially, and only was limited to residential in smaller areas and on the islands. So it pushed the pressure into smaller places that other foreigners matched in the big cities.
What about no restrictions on foreign ownership of homes? Did that have any effect? Visas for digital nomads? How about that. Those have no effect on housing? How did prices rise more than 150%, then?
I have news for you, Chega is not as far right as people make them out to be. Sure, some of them are as wacky and out there as can be. They’re right by Portuguese standards, but comparing them and lumping them in with the truly out-there parties in places like the UK or France is lazy and misleading. Portuguese constitution forbids far right parties – no fascists or racist ideology is allowed. That fact gets omitted in all discussions.
Their base isn’t made up of skinheads or chaos-seekers. It’s mostly working and middle-class families, people who pay taxes, raise kids, and feel like the system stopped caring about them a long time ago.
They’ve gone over 20% because what do they talk about – housing prices, law and order, cleaning up corruption, immigration reform and putting Portuguese families first. They’re not calling to rip up democracy or sell off the state.
Lisabon is more expensive than Berlin. Though Vienna is probably the most afordable capital in the world.
I’m jealous of their political flexibility.
One observation from me in The Netherlands is that for the last 3 months or so houses seem to be on the market longer than a month before they get sold. It looks like the asking prices, based on last year’s prices, are too high for today’s buyers.
Uncertainty about political choices is a big thing. Prices became outrageously high for small apartments and houses. Existing houses got split up into small studio’s, and went for sale for 350k per floor. Unaffordable for the middle income. In university cities studio’s got bought by parents of students who then ‘rented’ it out to their children. After study ended the studio’s got sold on. Most of the time at a profit. The costs were the interest paid. This was already cheaper than renting something. And the profit made it even more attractable.
The last kabinet (government) changed the rules on renting out dwellings. Before there was no income tax on rent. Now there is (36% if i recall correctly). Which made the “renting student” construction expensive. ‘Normal’ landlords are selling their properties because it is no longer profitable to rent out a studio. So there are a lot for sale and they don’t go like the proverbial “hot buns” any more.
Yes, the lack of US-style property taxes is something outsiders often misunderstand about the EU residential real estate market. Most taxation is done at the time of sale via “stamp-duty” transaction costs rather than ongoing holding costs. Combine with high taxation of rental income and pro-renter eviction policies and it’s very common for homes to stay unoccupied but on the market for very long periods.
I live in Luxembourg and it’s not uncommon for property to sit on the market for years, price unchanged. Literally dozens of homes in just my neighborhood like this–empty with for-sale placards.
Keep in mind that Eurostat provides statistics on property prices in certain countries. But prices in different regions and cities of a given country vary greatly. For example, prices in Portugal in Lisbon and Porto are many times higher than those in smaller cities.
As the Wolf says, every local market beats to its own drum.
Portugal has very few major major metropolitan areas. After Lisbon and Porto, comes Braga and it’s a huge drop off in size. Even still, no part of urban Portugal is escaping these price increases. Yes, the hottest neighborhoods in Lisbon and Porto have gone off the charts, but the overwhelming majority of homes in places where actual Portuguese people live and work are now unattainable. That 150%+ increase is just an average across the whole country, while wages have only gone up 10-15% during that same time.
I have Portuguese friends in a small village with less than 1,000 people, far removed from any major city, that we stay with frequently. Internationals have been buying the very few houses available and now prices are insane. What could be had for less than 50,000 euros twenty years ago now fetch 300,000 or more. The village is out of land (everything outside of the center is protected farmland, so the locals can continue to be able to afford to eat), so even ruins (no roof, noting left but some stone walls for decades — essentially a rebuildable lot) now go for close to 100,000 euros.
These homes never sold to internationals before, because in order to live and work there you needed to be fluent in Portuguese, and willing to work for local wages. Now with work-from-home and stratification of wealth, no problem for the haves buying up everything in site.
I guess the Portuguese can just go back to the ways under their pre-1974 dictatorship and send their population around the world as emigrants. Except these aren’t Catholic families with 10 kids anymore. The country bought into all the EU-will-help-everyone hype and now the kids believe in higher standards of living and birth control and the number of children-per-family has plummeted. And they still can’t afford housing. It’s not pretty.
A relatively recent addition to the UK’s property porn TV output is Channel 4’s ‘Help! We Bought a Village’.
Since 2022 viewers have followed ‘Intrepid Brits’ as they ‘restore empty and unloved settlements heading steadily for collapse’, and ‘breathe new life into remote villages, hamlets, borgos and cortijos abroad’..
YMMV
It’s interesting how so much of that problem has concentrated in Portugal. The Algarve had been like little England. for awhile, but what’s so attractive about the rest of the country to attract so many buyers? France, Greece and Italy have just as many charming and cheap places to buy derelict homes. And they’ve all had similar golden visa offerings.
Gattopardo, digital nomads and wealthy retirees have convinced themselves that quality of life there is unsurpassed. Then they spend all their other time with expats, barely learn the language, complain that they can’t make friends with locals, complain about the lack of access to the foods that they want (apparently rustic portuguese cooking isn’t as fancy as they thought it would be), complain about bureaucracy, and are mostly ignorant to the fact that the are the ones ruining housing for everyone else.
Hello Wolf! Interesting data! I noticed Hungary isn’t included in the charts. Any chance you could add to the comparison? Prices have really blown up there.
You’re looking at the largest 16 by GDP. Greece, Hungary, and a bunch of others didn’t make the cutoff. And I’m going to keep it that way for now.
There are quite a few interesting real estate policies in europe.
The netherlands made the money printer the solution to housing prices (just give anyone any loan), the swedes have to wait multiple decades on waiting lists, in vienna they mananged to build the only afordable city, in Lisabon they are cursed by golden visas and underdeveloped country side.
The price increases in poland and other “central” european countries are just repricing due to economic development. Germanys prices went up a lot but they had stagnated quite a bit so I guess they continue to stagnate again. The morgage rates went down again so I guess whats holding people back is the economic situation.
What’s holding people back are the ridiculously high prices that don’t match the zero interest rates on loans in the Covid era. Interest rates won’t fall any further than they are now. Prices have to fall to make economic sense.
Prices will not fall if the currency is being devalued by inflation. If we stay on the current course of 3% plus inflation, median houses in the U.S. will cost over $500k in 7 years. It is not that the value of what you derive out of the house has gone up, it is that it takes more currency to buy the same thing.
In relations to Gold, SP500, BTC, housing prices are dropping fast. LOL
In 1999 it would cost me 301 gold coins to buy my house. Now it takes 110 gold coins even though my house price is up 110% during this time. Heck, a coke in a vending machine costs 70 cents in 1999 and now it is $2.50. The value I get from drinking a coke has not gone up, I just had to pay more for the same value.
My income has not kept up with this inflation because I am not in the top 10%. Maybe their income has kept up.
Now measure home prices in relationship to stocks.
Hi ! It’d be interesting to see Switzerland.
Maybe after Switzerland joins the EU or the EEA. Good luck with that. Same with the UK.
Looks like the bubble in Europe is still inflating in most countries…
Interesting indeed.
You see, the biggest price increase in the first quarter of 2025 is in Bulgaria. In the second and third quarters, Bulgaria ranks after Portugal in price growth. It’s just that the article doesn’t cover all countries.
For your information, Bulgaria is the poorest country in the EU but has the second fastest declining population in the world. Unlike Portugal and Spain where people from all over the world buy properties, Bulgaria has a negative trade balance in real estate. So not only are foreigners not buying properties, but those who have bought are also selling and fleeing.
Bulgaria and Romania are also at the top of the rankings in terms of the number of properties per capita and at the bottom of the rankings in terms of the number of people living in rental housing
This is a replay to Digger Dave
How about the people in Borat’s village, Glod, Romania? What do they think of this craziness? How has it affected them?
1) This article is about price changes, but I think price/income ratios tell the story of economic and political frustration on the continent. Whereas price/incomes only exceed 5 in the priciest coastal markets of the US (a), in European cities it is relatively normal for price/incomes to be in the teens and twenties (b). And this is in a world of 5 year mortgages and much less government subsidization than in the US!
(a) https://www.jchs.harvard.edu/blog/home-prices-surge-five-times-median-income-nearing-historic-highs
(b) https://www.numbeo.com/property-investment/region_rankings_current.jsp?region=150
2) Plowing wealth into European housing seems like an odd long term investment choice, given the older demographics and low birth rates. I.e. many of today’s European home owners will be dead in ten years. The only chance for there to NOT be an oversupply of houses in the long run is if immigration takes off or if something completely shuts down construction. It’s worth noting here that European houses are typically built from concrete, and made to last centuries, not a few decades as in the U.S. So their housing stock does not require as much constant replenishment.
3) The idea that Europe has a housing bubble has counterevidence in the sense that it’s always been this expensive. The following site did a ratio of the price/income ratios from now back to 2000, and most countries are near 100, meaning there’s not much difference between past and present price/income ratios. Europe still offers democracy, low crime rates, and some of the highest standards of living in the world, and is constantly attracting investors and immigrants for those reasons. That said, instability could be on the horizon for the continent, as democracies seem to be dropping like flies these days, and Russia is working hard to destabilize their rivals.
https://ec.europa.eu/eurostat/databrowser/view/tipsho60/default/table
It’s obvious that you’re not European and you judge incomes and prices in Europe solely from stupid brokerage articles.
@Julian do you have a more reliable data source?
If so, why not post it?
Hi Chris,
thanks for that data. What is making a direct comparison of price to income ratios difficult if one compares the US and Europe is a different tax and social security sceme.
Net salarys are much lower in Europe compared to the US as mandatory health and pension contributions are paid. That is why people are paying much higher percenteges of their income for housing. On the other hand we (in europe) need much less personal wealth for health emergencys or retirement savings.
Just back from Spain and can attest to real estate prices in Madrid being totally bonkers. If the proposed 100% surcharge on foreign investors without Spanish tax residency goes forward (on top of new Airbnb restrictions in many cities), this could turn around big time.
Are they considering this “in retro” too? If so, how far back?
Overpriced RE isn’t such a bad deal compared to even more overpriced equities and bonds. It’s an everything bubble.
No wonder metals and Bitcoin are skyrocketing. I think it will continue until they crack the door and let a little austerity peek in.
Unlike in a gold-backed system (where one’s gain was another’s loss),
in a fiat-credit system:
People can save more,
Companies can invest more,
Stock prices can rise,
Govts can pay benefits
all at the same time — because new money keeps entering the system and hence the elasticity of stock market, bond market, crypto etc
Spains 2007 high and 2013 low matches the United States any idea why its not matching anymore.
It didn’t match back then either. The low in the US was in late 2011 or Jan 2012. The low in Spain was in Q1 2024
Spains housing appreciation is not stopping. I’m waiting for the musical chairs sound to stop.
If you want to learn the language and do some renovations there’s an enormous amount of housing available in rural western Europe. Cheap by US west (or east) coast standards. Houses for under $200,000 are easy to find, as are apartments under $120,000 (for sale).
I quit looking at Portugal 5 years ago as prices got stupid. Now I’m looking at France and Germany. Looked at a place last week; 1100 sq ft with tile terrace that adds another 600 sq ft on the edge of a vineyard, across the street from a winery, with the tourist road and bike path going by and 3 Michelin restaurants in walking distance for $330,000 US @ 3% for 10 years. In Napa (where I lived for 7 years) this would be 4-5 times more. I may never go back.
If you’re used to Napa, make sure you spend November through March at this place you pointed out — if it’s in Germany or elsewhere in northern Europe — to see the drizzly, cold, gray short days, months without sun, or on lucky days, the sun barely above the roofs, but you’re not feeling its warmth, it’s just decoration…. If you’re cool with that, cool! Some people love it, others don’t. There are reasons why expats (even Germans!) are drawn to southern Europe.
Wolf, he could be talking about Provence. Not quite so gray/drizzly/cold there!
Note: as you know, Napa actually gets snow/hard frost now and then. Plenty cold!
Roger
While you show the large differences between various countries, you never show the huge differences between counties in the USA. There are counties that have had huge appreciation including Eagle County, CO which have had 21% appreciation since the baseline you use in 2022.
“you never show the huge differences between counties in the USA.”
Sure. All you need to do is read the articles I post here, rather than blame me for your refusal to read my articles. They go by city, by metro, condos or single-family, national too.
https://wolfstreet.com/category/all/housing/
For example this article of Sep 23:
The 14 Bigger Cities with the Biggest Price Declines of Single-Family Homes (-10% to -24%) through August
Each city with its own chart: Oakland, Austin, New Orleans, Cape Coral, San Francisco, Birmingham, Washington DC, Fort Myers, Denver, Portland, Phoenix, Sarasota, Naples, Hayward.
or this article of Sep 19:
Condo Prices Dropped by 12%-27% in these 25 Bigger Cities through August: Condo Bust Update
Each city with its own chart: Oakland, Cape Coral, Austin, San Francisco, Denver, Tampa, Seattle, New York City, St. Petersburg, Fort Myers, Sarasota, Boise, Jacksonville, Detroit, New Orleans, Portland, Arlington (TX), Naples, Mesa, Aurora (CO), Reno, Scottsdale, Phoenix, Orlando, Garland
Or my long-running series, by metro. This one from Sep 16:
The Most Splendid Housing Bubbles in America, Aug 2025: Price Drops & Gains in 33 Large Expensive Metros. Overall US Home Prices Fell YoY
33 charts of 33 metros. Prices fell in 21 of our 33 metros: Tampa, Austin, Miami, San Diego, Los Angeles, San Jose, San Francisco, San Antonio, Dallas, Phoenix, Orlando, Atlanta, Denver, Raleigh, Houston, Seattle… Others up YoY: Boston, Chicago, New York, Philadelphia… A few hit new highs. Go check it out.
Coming soon, to a country near you.
Throughout the developed world, there is a drop in demand for housing. It’s caused by the long-term impact of slowing and declining population growth. It’s offset by government bailing out the housing markets by providing new tenants, specifically illegal immigrants with government housing vouchers. Note that some overseas countries with good development and bad immigrant problems don’t appear on the housing price drop list — specifically the UK and the Netherlands.
The easy reaction is to say I’m concocting a conspiracy between government, immigrants, and the mortgage/housing industry. But actually the individual homeowner benefits from an artificially high price level and equity. I guess my observation is that some of the serious social and economic problems we face are structural and enduring. Maybe someone who has an appetite for some third rail energy can hang some data on this.
The Netherlands has neither good housing development, or a bad immigrant problem. Happy to be proven otherwise with actual statistics.
It’s complicated. While in the long run you’re right that lower populations mean lower demand, in the meantime low rates of family formation and high divorce rates mean there is strong demand for small, affordable homes (think mom and their kid, solo dad, cohabitating couple in their 30s) and rapid decline in demand for large homes.
East Asia is a good model to understand coming EU dynamics. Abandoned villages and Paris, etc with strong demand for 1-2 bedroom flats.
Just a kind smile from Europe. May I remember you my remarks on your post by Sep 8, 2024? Wel, hereabove, you write : “…a recession is just about inevitable. That’s how business cycles evolve over time.” Conclusion : the historical regularity of the U1RATE makes it an excellent forward indicator.
Further, recessions begin always some months AFTER EACH UN-inverting of the yield curve (= the present situation). Economy is subject to historical laws : the day-by-day statistics and sentiment must not ignore them.
Politicians nor central banks can break the laws of the economic/financial cycle, only slightly influence the timing. In the USA, yield curve inversions occurred in the 19th century (mentions in the beginning of the dissertation by C.R. Harvey 1986) when the Fed not yet existed. In French 19th-century periodicals over economics I have found also such inversions in a time when the French central bank didn’t intervene on the interest rates. Much American analysts blame the Fed for these inversions : it is searching for a scapegoat in place of a realistic attitude towards the mainstream market-utopia.
Intuitively I would add: how longer/deeper the inversion, how severe the recession. But I have not enough historical data to confirm such a hypothesis. However, if it is correct, the coming years could be desastrous.