The Standing Repo Facility got a bit of use on Sept. 15 (corporate tax day) amid minor liquidity strains in the repo market.
By Wolf Richter for WOLF STREET.
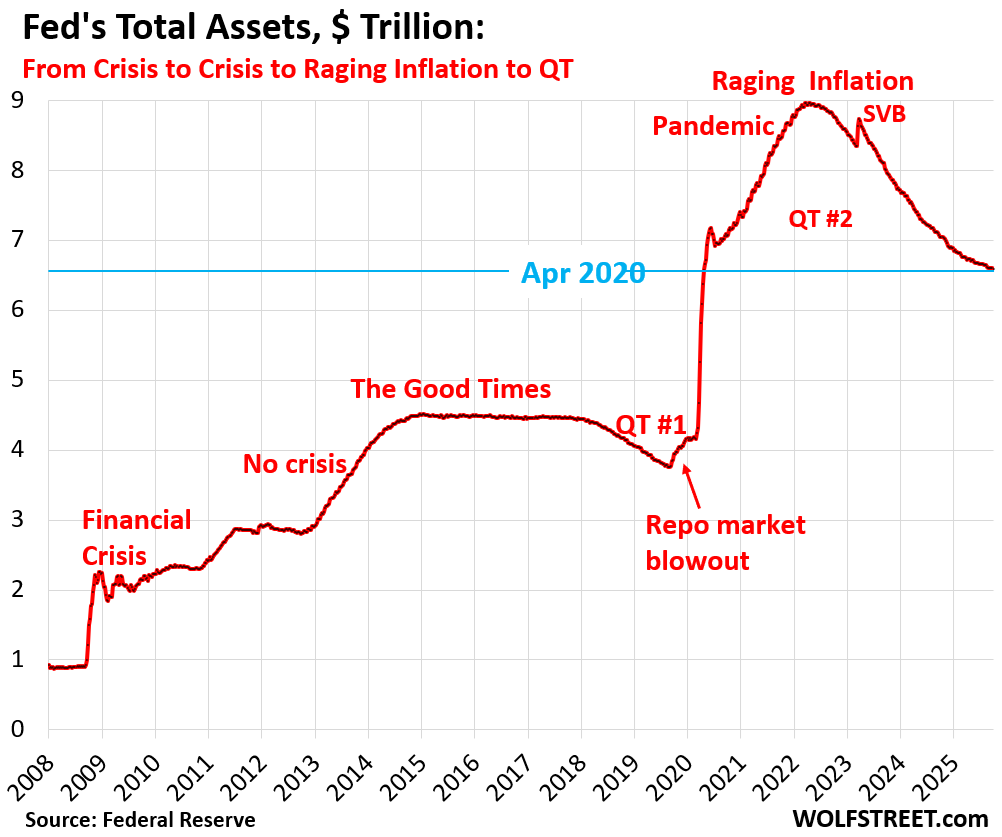
Total assets on the Fed’s balance sheet declined by $15 billion in September, to $6.59 trillion. This $15 billion decline was a mix of $24 billion of declines and $9 billion of increases:
- $24 billion of declines spread over four accounts:
- MBS: -$17 billion
- Treasury securities: -$4 billion
- Unamortized premiums: -$2 billion
- Pandemic-era SPVs: -$1 billion
- $9 billion of increases spread over two accounts:
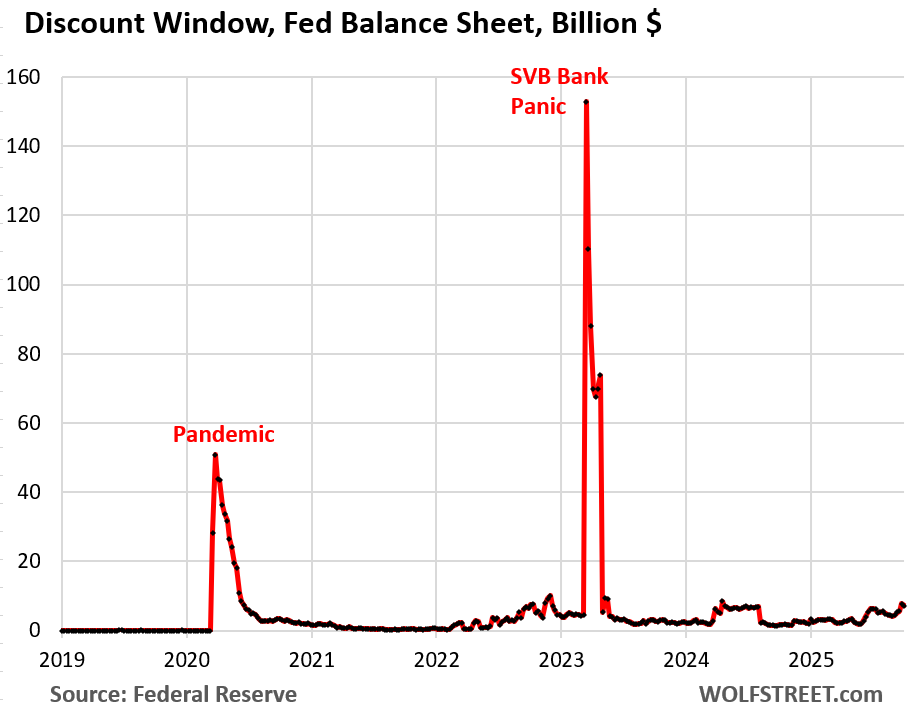
- Discount Window: +$3 billion
- Accrued interest: +$6 billion
Since the peak of its balance sheet in April 2022, the Fed’s QT has shed $2.38 trillion, or 26.5% of its total assets. In terms of the Pandemic-era QE, the Fed has shed 49.5% of the $4.81 trillion it had piled on from March 2020 through April 2022.
Since the reduced pace of QT began in June 2025, the balance sheet has declined on average per month by $22 billion.
QT assets.
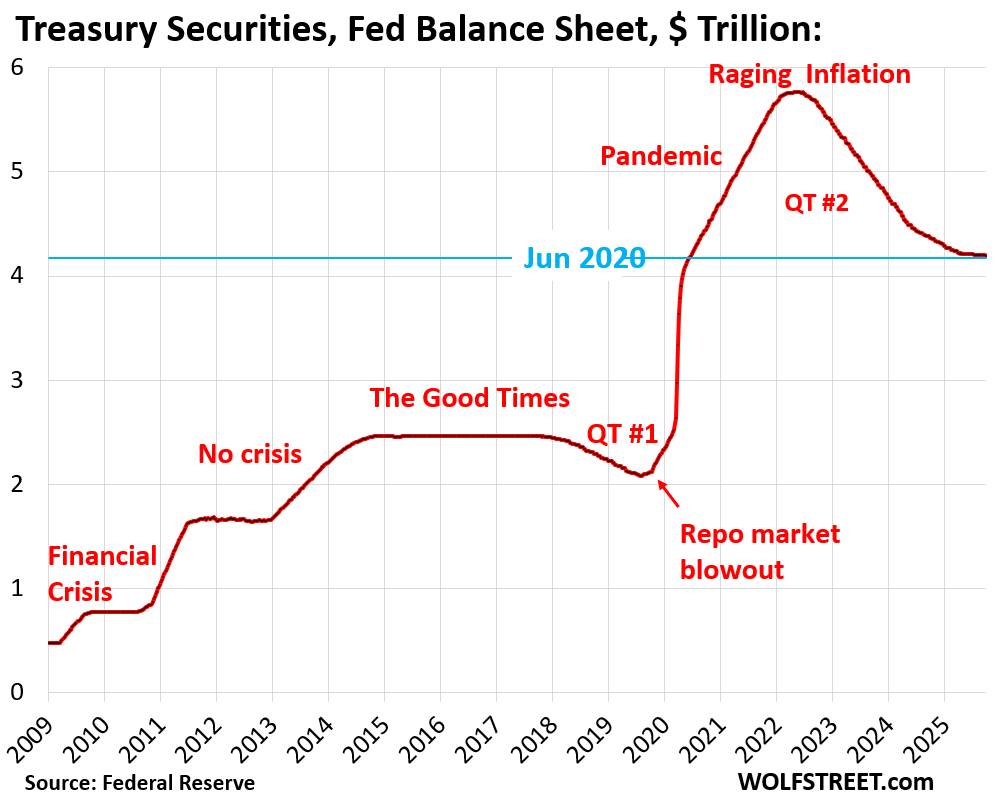
Treasury securities: -$4.4 billion in September, -$1.58 trillion (-27.3%) from peak in June 2022, to $4.20 trillion.
The Fed has now shed 48.2% of the $3.27 trillion in Treasury securities that it piled on during pandemic QE.
The $4.4 billion decline was in line with the $5-billion a month pace of QT for Treasuries. The difference was the inflation protection the Fed earned on its holdings of Treasury Inflation Protected Securities (TIPS), which is added to the principal of the TIPS, instead of being paid in cash.
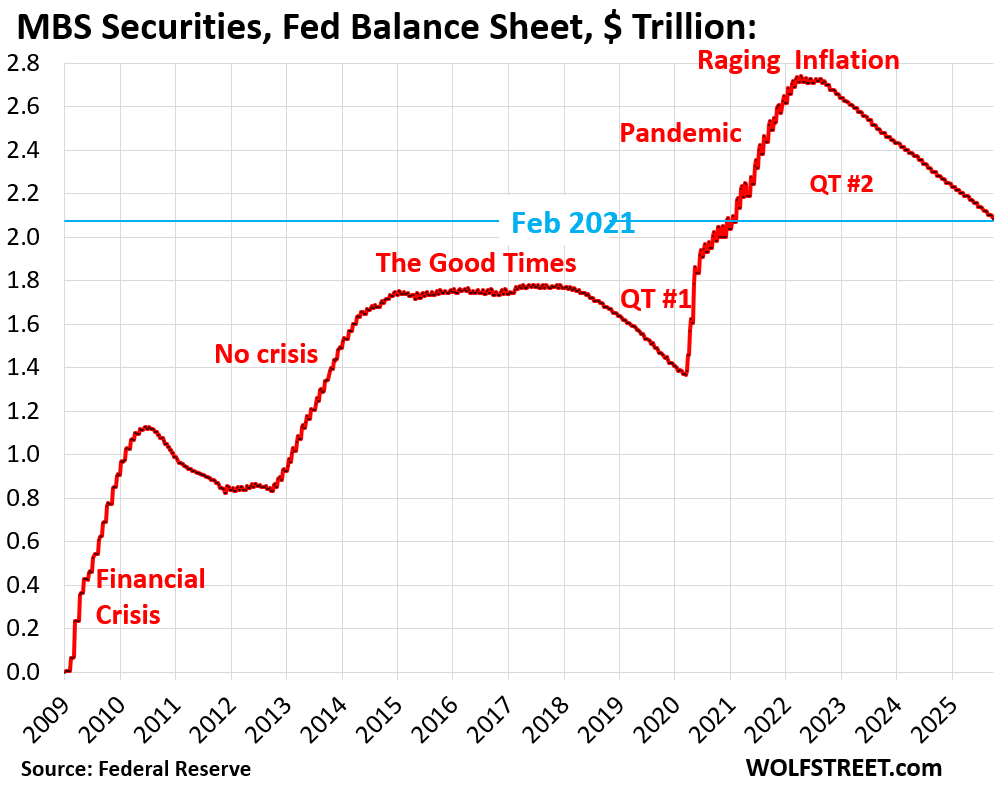
Mortgage-Backed Securities (MBS): -$16.8 billion in September, -$654 billion (-24%) from the peak, to $2.08 trillion, where they’d first been in February 2021.
The Fed has now shed 48% of the $1.37 trillion in MBS that it had added during pandemic QE.
The Fed holds only “agency” MBS that are guaranteed by the government (issued by Fannie Mae, Freddie Mac, Ginnie Mae), where the taxpayer would eat the losses when borrowers default on mortgages.
MBS come off the balance sheet primarily via pass-through principal payments that holders receive when mortgages are paid off (mortgaged homes are sold, mortgages are refinanced) and as mortgage payments are made. But sales of existing homes have plunged and mortgage refinancing has collapsed, and far fewer mortgages got paid off, and passthrough principal payments to MBS holders have slowed to a trickle.
As a result, ever since QT started, MBS have come off the Fed’s balance sheet at a pace that has been mostly in the range of $15-19 billion a month. The MBS runoff is not capped, whatever comes off comes off.
Bank liquidity facilities: a little bit of activity.
- Central Bank Liquidity Swaps ($0.0 billion)
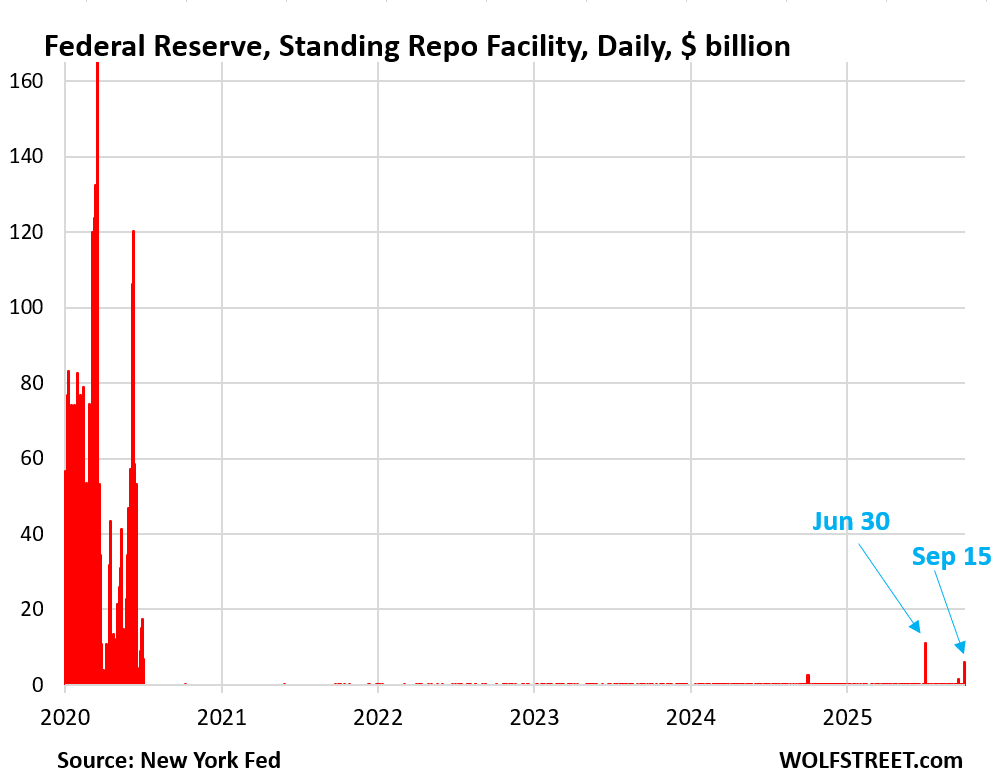
- Standing Repo Facility or SRF ($0.0 billion), but there was some activity on September 15 (corporate tax day).
- Discount Window: +2.8 billion to $7.1 billion.
Both of these dates – September 15 and September 30 – entail large liquidity flows that can cause repo market yields to rise now that the Fed’s ON RRP facility, where money markets store excess liquidity, is near zero, after three years of QT.
The SRF: The Fed has been exhorting banks to use its new SRF, implemented in July 2021, to borrow there and to lend to the repo market when yields rise under tax-day or quarter-end pressures. Banks would make money on the spread, and it would keep those yields in check.
The Fed has been improving its SRF in various ways, including recently by offering its counterparties a morning auction, in addition to the afternoon auction.
The SRF’s ability to keep overnight rates in check has been cited in recent discussions as a factor in allowing the Fed to continue to remove liquidity via QT. And so far, it has been working.
But on September 15, just for this one day, $1.5 billion had been drawn on the SRF. On June 30, for one day, $11 billion had been drawn. By the current balance sheet as of the close of business on October 1, the SRF was back to zero.
This is the daily balance of the SRF from the New York Fed. The Fed’s balance sheet is weekly as of Wednesday and doesn’t capture the day-to-day moves in between.
The Discount Window: +$2.8 billion, to $7.2 billion. The Fed has been exhorting banks to use its Discount Window, or at least get set up to use it and pre-position collateral so that they can use it to help manage their daily liquidity needs. There has recently been some uptake.
What else…
“Unamortized premiums”: –$1.9 billion in September, -$125 billion from peak November 2021, to $231 billion.
With these regular accounting entries, the Fed writes off the premium over face value it had to pay for bonds during QE that had been issued earlier with higher coupon interest rates and that had gained value as yields dropped before the Fed bought them. Like all institutional bondholders, the Fed amortizes that premium over the life of the bond.
The leftover PPP loan balance from the pandemic: –$1.3 billion in September to near zero. That was the “PPPLF” in the pandemic era alphabet soup of SPVs, and it’s essentially gone now.
The only remaining pandemic-era SPV is the MSLP, it’s declining steadily and is down to $3.7 billion. All other SPVs have been zeroed out.
“Other assets”: +$6.6 billion to $35.7 billion. This $6.6 billion consisted mostly of accrued interest from bond holdings that the Fed set up as a receivable (an asset) in September, and that will be paid in the near future, at which point the Fed destroys that money, and the balance drops again. This account fluctuates weekly up and down based on these interest payments (the Fed doesn’t have a “cash” account, like companies do; it creates money when it pays for something and destroys money when it gets paid).
This account also includes “bank premises” and other accounts receivables and will always have a balance.
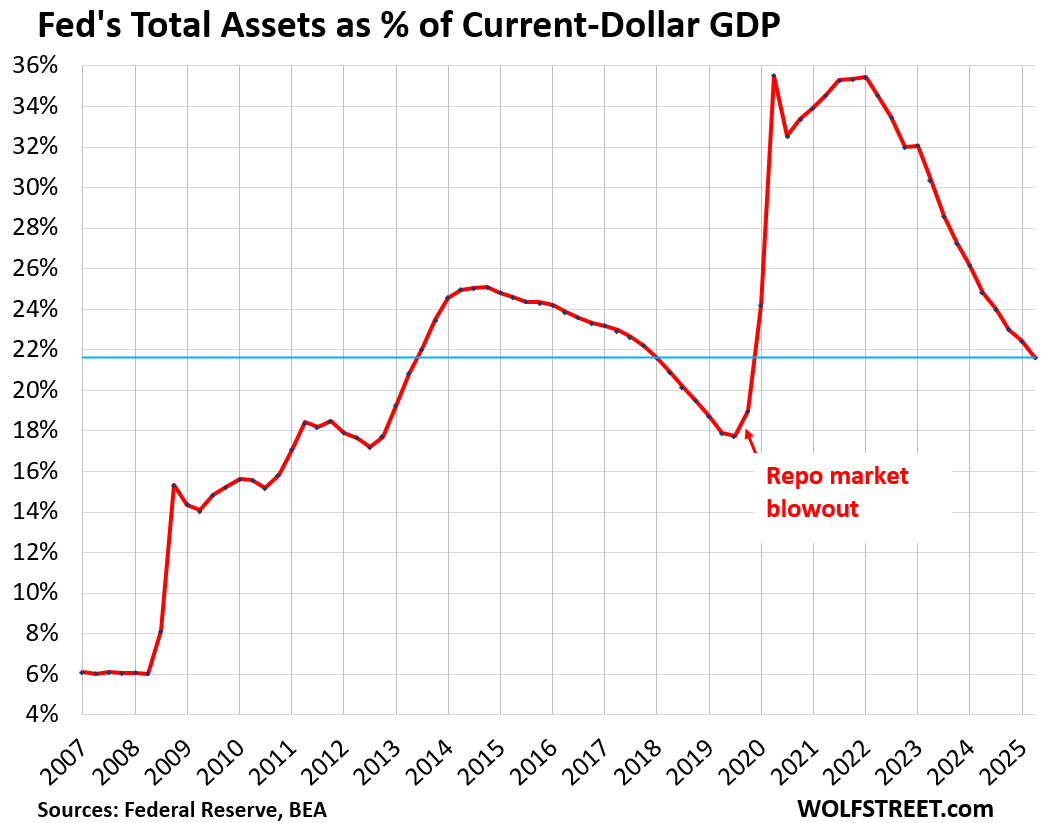
Fed’s balance sheet compared to the size of the economy. The Fed-assets-to-GDP ratio fell to 21.6% in September, where it had first been in Q3 2013 (total assets divided by “current dollar” Q2 GDP).
Enjoy reading WOLF STREET and want to support it? You can donate. I appreciate it immensely. Click on the mug to find out how:

![]()
God I remember some financial YouTuber using the m2 money supply as some economic red flag and it became clear they didn’t know anything about the Fed.
Excellent work. I still think the Fed thinks it’s risk mitigation techniques have too few unforeseen consequences.
They imperialized the world into it’s current model, what event are they planning next?? After the past 25 years anything is possible…corporate pro PAGAN da dominate peoples minds…the big lie theory dominated their minds…
I don’t understand any of this lol
Wolf, I think you told this before, but can’t remember the exact number.
What is the lowest balance Fed can have?
My calculation was $5.8 trillion back in March 2024. Fed governor Waller has then said the same thing a few weeks ago. This assumes that the Fed will stick with its “ample reserves” strategy. If it decides it can live with less than “ample reserves,” such as by relying on the SRF to provide liquidity when needed, the balance sheet could drop further.
Here is my calculation from March 2024:
https://wolfstreet.com/2024/03/23/the-feds-liabilities-how-far-can-qt-go-whats-the-lowest-possible-level-of-the-balance-sheet-without-blowing-stuff-up/
About two more years at the $30B/mo. pace. So at Thanksgiving 2027, we can toast whoever is pulling the strings at the time. Assuming there are no reductions in pace or hiccups between now and then.
So the financial system is still on Fed life support, with the balance sheet at 22% of GDP vs. just 6% before the GFC. All that was done was to take away the post Repo blow out QE while the government ramped up deficit spending. Now that the government is maxed out on deficit spending, maybe soon back to QE to keep the bubble of all bubbles alive.