A bigger rise in March got more than wiped out by a drop in April. That’s how it goes with zigzagging month-to-month data.
By Wolf Richter for WOLF STREET.
There was a lot of housing-promo hoopla in the media this morning about that 4.0% month-to-month increase in pending sales of existing homes in August, sign of a sudden burst of demand due to lower mortgage rates, or whatever, written by goofballs or AI that never look at a chart.
That 4.0% month-to-month seasonally adjusted increase in the Pending Homes Sales Index by the National Association of Realtors today was off near-record low in the prior month, and was still down by 30.1% from August 2019 and by 42.7% from August 2020.
And the index was below March 2025, when there was a bigger widely ballyhooed surge in demand, or whatever, that was then more than wiped out by the sharp decline in April. That’s how it goes with zigzagging month-to-month data (historic data via YCharts):
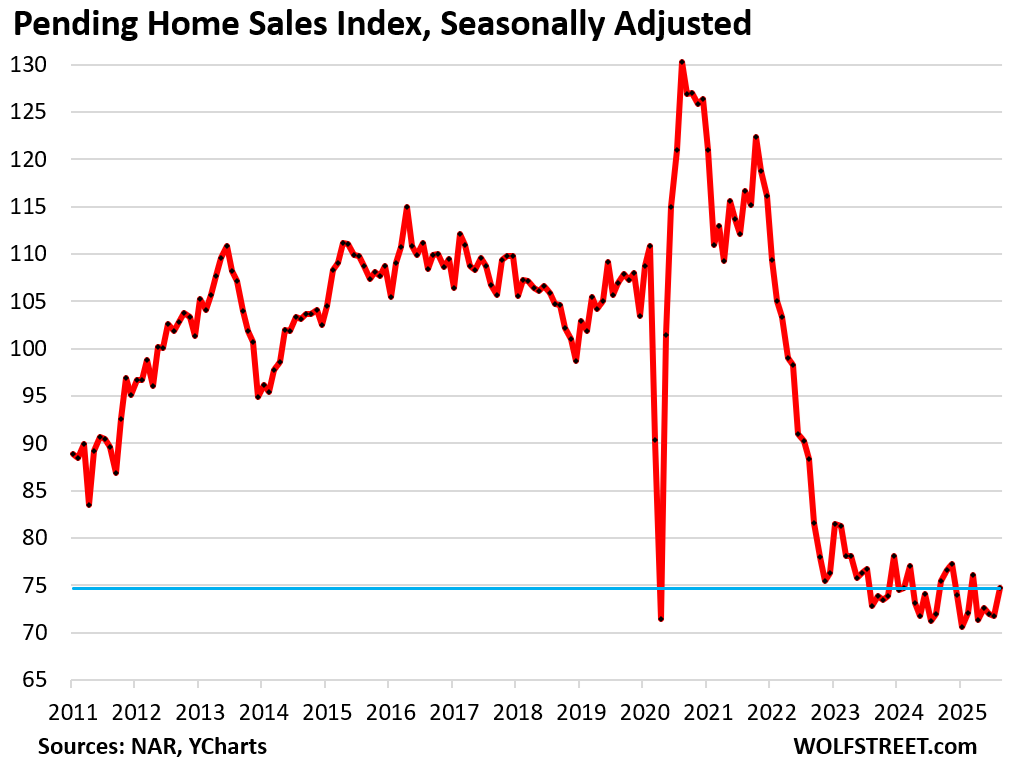
Pending home sales compared to the Augusts in prior years:
- 2024: +3.8%
- 2023: +2.6%
- 2022: -15.4%
- 2021: -35.9%
- 2020: -42.7%
- 2019: -30.1%.
Pending sales are based on contract signings and track deals that haven’t closed yet and could still get canceled because buyers cannot afford homeowner’s insurance, or cannot sell their own home, or for other reasons. Signed contracts that then get cancelled are included in the pending sales here, but are not included in closed sales reported later.
And cancellations of signed deals are running high. Redfin reported that in July, 15.3% of all pending sales fell through, the highest rate for any July in Redfin’s data on cancellations going back to 2017.
Pending sales in all four regions zigzag along near record lows.
A map of the four Census Regions is posted in the comments below.
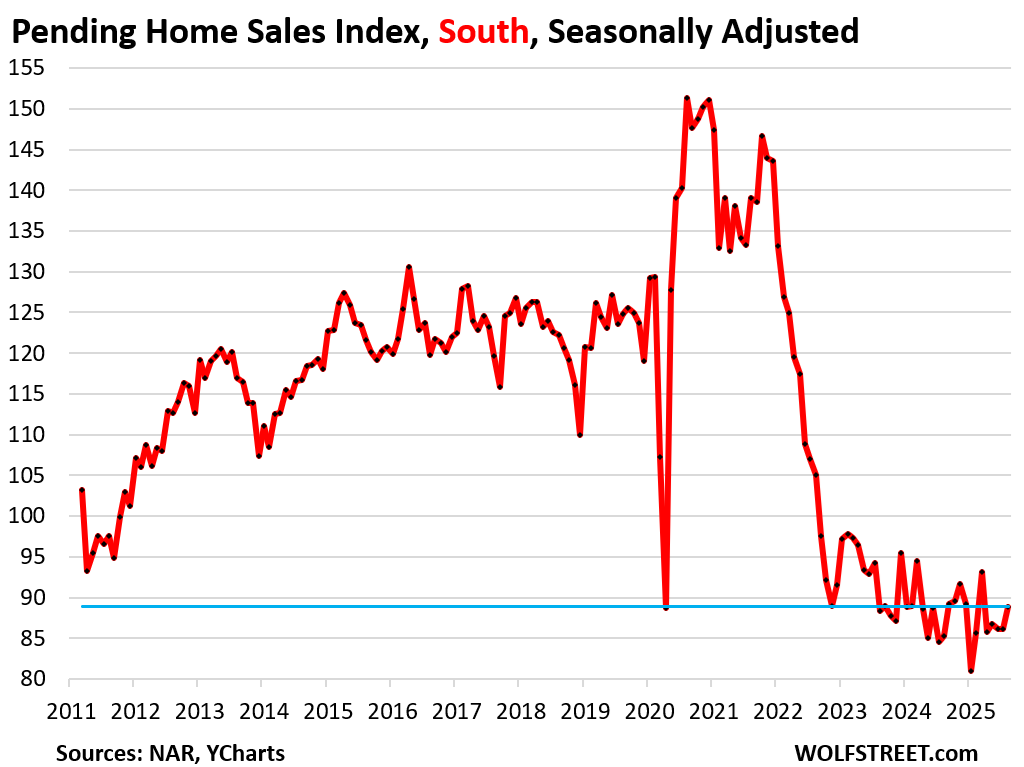
In the South, pending sales rose 3.1% in August from July, seasonally adjusted.
Compared to the Augusts of prior years:
- 2024: +4.2%
- 2023: +0.7%
- 2021: -36.0%
- 2020: -41.2%
- 2019: -28.8%.
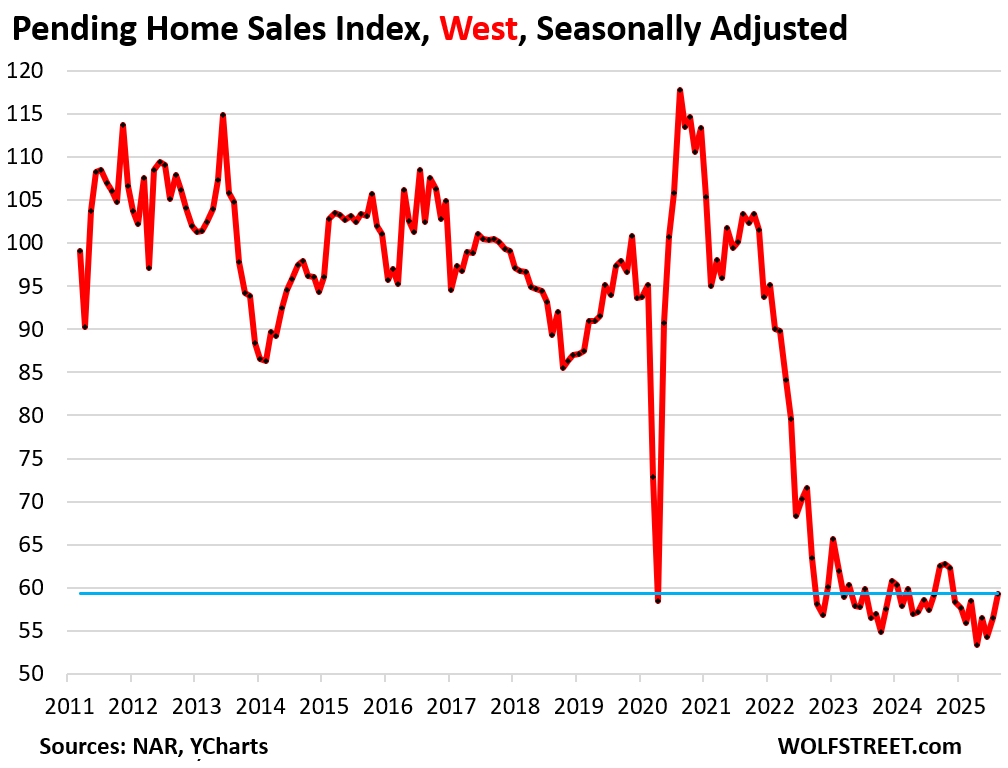
In the West, pending sales rose by 5.0% in August from July.
Compared to the Augusts of prior years:
- 2024: unchanged
- 2023: +5.0%
- 2021: -42.6%
- 2020: -49.7%
- 2019: –39.1%.
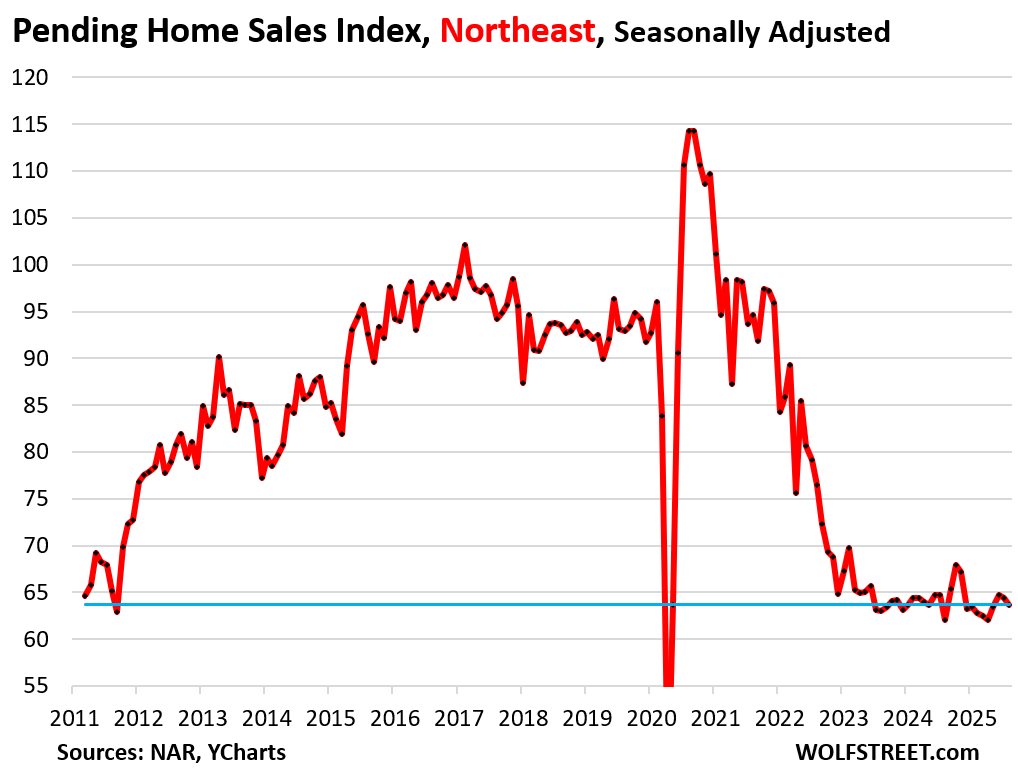
In the Northeast, pending sales dipped by 1.1% month-to-month, seasonally adjusted.
Compared to the Augusts of prior years:
- 2024: +2.6%
- 2023: +1.1%
- 2021: -32.7%
- 2020: -44.3%
- 2019: -31.4%.
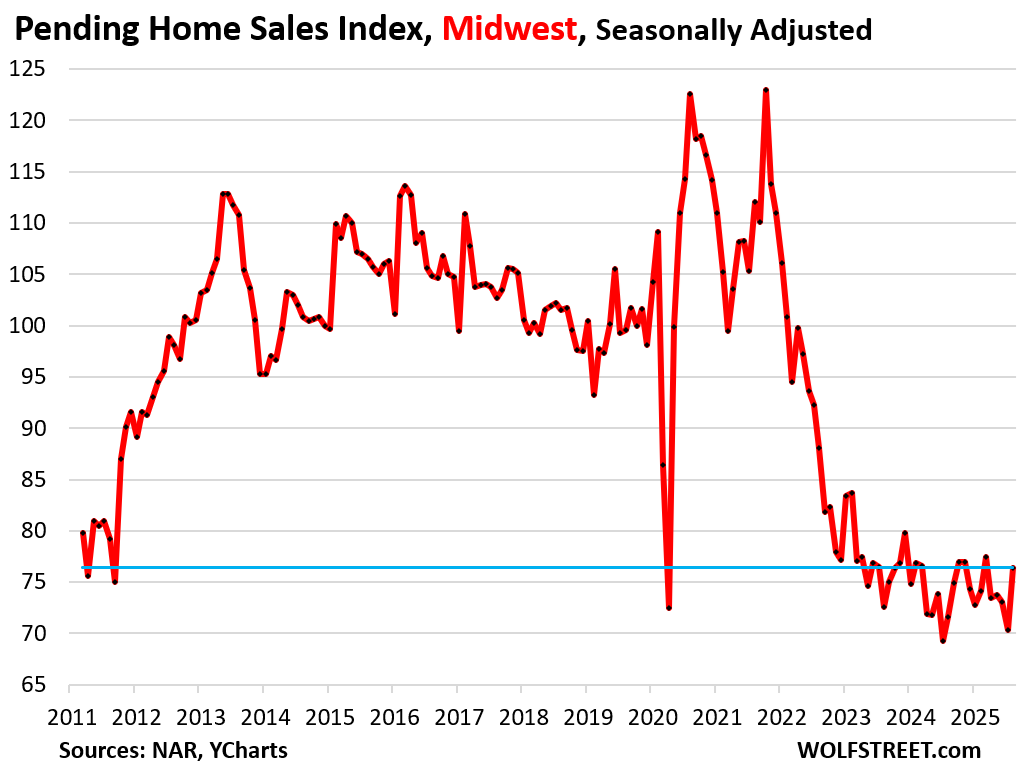
In the Midwest, pending sales rose by 8.7% in August from July, but July was the second-lowest in the data going back to 2010.
Compared to the Augusts of prior years:
- 2024: +6.7%
- 2023: +5.2%
- 2021: -31.8%
- 2020: -37.7%
- 2019: -23.3%.
Enjoy reading WOLF STREET and want to support it? You can donate. I appreciate it immensely. Click on the mug to find out how:

![]()
The four Census Regions of the US:
North South East or West… certainly looks like the same pattern to me. Encouraging ?? Not yet.
Think the only good news about the housing sales slow down the last 2 years is that the consumer economy is still somewhat holding up. People have been on the sidelines with housing for a while now the stand off between buyers and sellers and prices have not moved too much (unless over heated market). Think we will see healthy increase in 2026 in sales if Trumps Fed Chair pick can take another 1% off fed rate it will be even healthier.
” Think we will see healthy increase in 2026 in sales if Trumps Fed Chair pick can take another 1% off fed rate it will be even healthier.”
The problem is FED does not control Mortgage rates. Infact, recently, mortgage rates are going up despite FED cutting rates.
The problem is not mortgage rates but High prices!
We can thank the high end customer for holding the economy together.
And, maybe youve not noticed the correlation between fed rate and mortgage, but not so linear lately.
We’re on a debt/inflation train to hell.
Trump’s Fed pick and mortgage rates have little correlation….I don’t understand why people refuse to understand.
A bump in activity though would be reasonable from people full on hopium but doubtful it would be sustainable until a washout on prices
The 12 member FOMC at the Federal Reserve, not the Chairman of the Federal Reserve, sets the Federal Reserve’s short term overnight interest rates. As to mortgages rates, the Federal Funds Rate and related rates have nothing at all to do with mortgage rates except that the lower the Federal Funds Rate goes the higher mortgage rates rise exactly as we saw in the Fall of 2024.
What makes you think the new Fed Chair will create lower mortgage rates? Mortgage rates, like 10yr treasuries don’t always move in line with Fed rate cuts
If the Fed really cared about supporting the housing market they could start buying up RMBS again. I think they want housing prices going down with everything else going up.
Fed suppression of rates by buying, holding mbs, with dollar debasing money printing doesnt support a healthy housing market. It only supported a disastrous speculative run up in prices. They still have 2 trillion in mbs. It would actually help the housing market immensely if they got rid of all their mbs and never “bought” any of them or long term bonds, again.
yeah. Until the ultra low mortgages are paid off, there will be low sales volume. I still wonder who is holding these mortgage loans. It must feel lousy to lose money like this.
No money is lost when MBS instruments are held until maturity. Nearly all mortgages are now securitized into MBS instruments and not held by banks as used to be the case.
“Nearly all mortgages are now securitized into MBS instruments and not held by banks as used to be the case.”
i’m not sure if that is *exactly* true – I’m fairly sure that the banks hold a ton of RMBS – it is just that the RMBS they hold has Fed Agency guarantees (Wolf’s view) and therefore “cannot”/”will not” default due to those guarantees.
That might very well be the case although,
1) I don’t think we’ve seen a link to FRED/Fed/FDIC/etc. where bank asset holdings are broken down (and illustrate the full extent of the Fed backstop). I’m not saying this isn’t the case – I’m just saying I don’t think we’ve seen the actual, extensive breakdown of bank asset holdings (I know the FDIC provides this – but I’ve only seen RMBS totals, not Agency-Backed RMBS totals as a percent of banking system assets).
I’m sure it is out there – but my casual digging hasn’t turned up a simple summary of bank asset holding totals (as a percent of all bank assets) along these lines.
2) Commercial MBS is a whole other can of ugly. No Fed guarantees there – the only question is exactly how much of bank-originated ugliness (doomed loans) the banks had to retain (versus injecting into the ZIRP-starved market at large…).
“where bank asset holdings are broken down (and illustrate the full extent of the federal backstop).”
Yes, you can see that. See link below, Table 2: Federal government-guaranteed MBS (“agency securities”) are listed with Treasury securities on bank balance sheets under the heading “Treasury and agency securities,” line 3, total $4.64 trillion; of which agency MBS, line 4, $2.69 trillion. The rest are Treasuries and non-mortgage agency securities, line 5, $904 billion.
Non-government backed securities are listed starting with line 6. Loans and leases start at line 9.
https://www.federalreserve.gov/releases/h8/20250926/
Banks like agency MBS because they have the same credit risk as Treasuries (near zero) but pay more interest.
Also you have to learn how to distinguish in your writing between the Federal Reserve ( the “Fed”) and the federal government ( the “feds” or “USG” or “federal gov” or whatever)
You’re using “Fed” to describe the federal government which makes your statements about this confusing and wrong. The Fed doesn’t guarantee any of this stuff. But the federal government does.
Sure there is. The money lost is the higher interest payments that could be achieved if that low-paying bond were sold and reinvested at the higher yield. In the end, it’s a wash: the income remains the same whether you hold or sell and reinvest. (Ignoring taxes and other minor inconveniences.)
Thar is certainly not ‘money lost’ but rather just some folks now being able to jump into a new speculative position due to having prior committments. If they didn’t want that committment then they shouldn’t have made that committment. That’s life.
Typecheck,
I did the opposite. I paid down extra principle and paid off my house but could be making money if I hadn’t done so. That said, paying off a house is a nice feeling.
I will not pay off my 3.15% mortgage early. It makes no sense. CD rate is higher than that.
Typecheck – You pay taxes on CD interest and mortgage interest is deductible. It’s about a wash for me now. I just keep feeding the CDs because I need liquid assets in the near term.
Ah……finally, some normalization is starting to creep into the market.
Anecdotal from here in the Great Lakes (Cleveland) region from someone who is house hunting in the $450-$650 range: homes still seem to be moving briskly, and concessions/price cuts are minimal.
From a colleague who is looking at the $1mm and up market, it seems that there are some relatively significant price cuts going on at the upper end of the market.
In my current neighborhood, 1700-2000 sq. ft. 1920s-1950s colonials and bungalows (inner ring suburbs) are moving pretty quickly in the $165-$250 range.
In older regions of the country, where population growth has stalled, there will be a slow churn of existing property.
Things at different in the booming Sun Belt. Due to extreme levels of illegal immigration, as hispanics get out of their shared housing and look for property of their own, and as whites from the North plant roots in Florida and Texas and Arizona, there will be a competition between new housing and existing housing, with condos always doing strong business.
The best place to buy a house is Sarasota, Florida. Situated near Tampa Bay, this city is away from the Latin mania of Miami and yet basks in the warm, gentle sunlight of the subtropics. A home here will cost you a bit more but retain its long-term value as the local population grows.
“The best place to buy a house is Sarasota, Florida. … A home here will cost you a bit more but retain its long-term value as the local population grows.”
Um…
https://wolfstreet.com/2025/09/23/the-14-bigger-cities-with-the-biggest-price-declines-of-single-family-homes-10-to-24-through-august/
Scorekeeping:
Wolves — 1
Trolls — 0
lol, just gotta love how Wolf in one picture takes down this annoying and ever repeating false meme about Sarasota and Fla. general as real-estate Dreamland.
Out here in the left coast imI see the opposite of what you’re seeing. Here the high end is moving at above asking and the low end at below asking. Perhaps the AI money is starting to flow at the high end and buyers just want in?
It is surprising prices have not fallen a lot more than they have with pending sales near 2012 levels. It’s like a tree branch that is weakening under pressure, but hasn’t snapped yet. When it does snap, look out below.
Hard to say, however in my area, there are a lot of people that are sitting out for lower rates. Reality would be the dollar lost a ton of value in 5ish years due to inflation and debasement of currency units. Places that intentionally restricted building are seeing the price cuts.
When this branch snaps, there will be another branch a little further down, and another branch after that. It’s not 2008. Long, slow, boring slog sideways for years to come.
People are definitely still buying and in some hot markets like SoCal, even though there’s drop, some of the transaction is simply bonker, makes you wonder if the people buying now are the last one in the crowd theatre before the fire or this is the new FOMO norm…
Case in point, saw a house in LB listed for 1.26M, sold for $1.3M on Refin and no the house is not under price to begine with. Surprise to still see selling over listing in this day and age without it being a bargain. Needless to say this will be a long drag out fight in some markets unfortunately, some like Austin…not so much.
But there maybe a push pull on prices in front us — if mortgage rates drop a ton (like 200bps) that will quickly cause buyers to jump back in and may start causing prices to rise. Just a thought. Also, I’m still not sure how the price of housing filters into the CPI
Mortgages rates won’t drop 200 bps unless the Fed starts QE again or we enter a brutal recession.
It just ain’t happening.
I anything, mortgage interest rates will rise from where they are now.
That is closer to what I have been thinking
Thank you for the 30k ft. view and good perspective on the “huge” 4% MoM / 3.8% YoY increase in Aug., ’25 PHS. A picture – or chart in this case – is indeed worth 1k words. In my view, and the take-away from this post is that sales are still bouncing along the bottom of the 30 yr. low.
My view on prices: Used/Existing/Resale homeowners are still holding out for pandemic era prices, when mortgage rate were sub 3%, but now rates are super 6% (6.38% today for 30 yr., fixed-rate). NEW home sellers (i.e. builders) are cutting prices so that they’re now BELOW USED home prices, which is just another indication that the U.S. RRE housing market is massively distorted and FUBAR. Let’s not forget about the other dumpster fire in CRE. I probably don’t need to mention the AI bubble in stonks, but I will.
Here are the options, absent any additional interventions, by .gov and/or the Fed:
Door #1: Incomes need to rise by more than 60% – Capital tells labor that’s not happening (family friendly version).
Door #2: Mortgage rates need to fall to 2.35% – Bond vigilantes tell long bonds that’s not happening with $37T in debt and spending continuing at recessionary levels. I think someone said “out the wazoo.” The Fed raised the FFR in Sept. ’24 and again just now in Sept. ’25. 10 yr. (mortgage tied to this) and 30 yr. long bond rates rose soon after.
Door #3: Prices (Used) need to fall by 38% – Only option left, and is what history says happens to asset bubbles. They (eventually) burst. An inconvenient truth.
These numbers are “according to Fannie Mae calculations,” but I’ve also run the numbers and they’re close to what I have, based on mortgage P+I monthly mortgage payment only. Let’s not forget that in addition to P+I, T+I are very high also, as are HOA, maintenance, and repairs. Oh dear!
Summary: PHS – a leading EHS indicator – are still stuck in the mud. Prices are sticky to the downside. Just like in HB 1.0.
House prices are still unaffordable to the avg. shelter buyer. That’s the real problem that – in my view – only lower prices will fix.
Door #4: the market limps along until wage inflation opens door #1.
This is what happened in the 90s real estate bust and is the most likely to happen now. My guess is about 5 years of flat housing prices and 3-4% wage inflation will just about get you there. If a recession hits in the meantime, it’ll take longer or require some actual drop in prices.
Revision: this may actually take closer to 7-10 years (it was about 7 years of almost no increase in house prices in the 90s).
The 90’s real estate bust really isn’t a good analogy to Housing Bubble 2 right now though because the home prices to income ratio is so much more outrageously lop-sided compared to the 1990’s. As bad as it was then, housing costs weren’t really that far outside historic norms. While now in post-COVID US in the 2020’s, home prices are 5 to 6 times median incomes, or worse in some regions–that’s even worse than Housing Bubble 1 leading to GFC in 2008, the worst in history in fact.
So the slow burn you’re describing of 1990’s doesn’t work for a much worse inflated bubble on the top of all kinds of other bubbles and much higher inflation eating into Americans incomes and savings. There simply isn’t any realistic way for Americans incomes to even come close to catching up to outrageous housing prices like this, esp now with layoffs increasing and much more international competition in key tech areas where it’s harder to maintain profit margins like before. Back in the 1990’s there weren’t really other international centers for what was clearly value added tech (even with the dot-com bubble), while now we have an even worse AI bubble for tech with much more questionable ROI for all the costs (see the MIT study) and much higher energy costs, and much smaller moats with more competitors domestically and abroad. And offshoring and tech layoffs still rising.
No realistic way for wages to close a gap when housing prices are 5 to 6 times average incomes, and then you have bubbles and higher costs for so many other things from healthcare to senior and childcare and then college in addition, and ongoing inflation higher than Fed target on the top of previous inflation waves. This is not only more like the 2007-2008 housing bubble but in a lot of ways even worse in proportion compared to incomes. And there is no free lunch here, even if the Fed was to go fully corrupt and try and protect speculators against market forces with ZIRP or QE again, that would just bring the bond vigilantes out and destroy what’s left of America’s dollar as a reserve currency, make things 100 times worse. And the US birth rate is crashing fast due to high housing prices. The only solution is for home prices to come way down, to historical ratios compared to incomes.
Ah but you’ve missed the main point, namely that house price to income ratio doesn’t matter – house payment to income ratio does. And that is currently just about as bad as the early 80s and would only house prices to drop by 20-30% (or incomes to rise accordly) from current levels to return to something normal
Mortgage rates in the US will likely stay around 7% and then go higher.
Have you ever hear of the ol’ ‘rug pull’?
I think it will be a rug pull with the housing market. We are chugging along, albeit at a very slow, sluggish pace but some could say that all appears normal. And it does! Chief word being ‘APPEARS’.
But when the rug pull trick is performed, it will be like a Jenga tower falling down. Game over. Millions underwater. Prices crashing. Sales almost nonexistent. The good ol’ rug pull. 🤔 Coming soon to a neighborhood near you.
Is it like one of those saying “”Slowly at first, then all at once”?
Was thinking something similar, to both analogies your’s and Pablo’s. Like a slow tug of the rug at first that starts things tipping over, followed by a fast snatch away. The problem is the speculators (not just in real estate) are so outrageously over-leveraged right now, thanks to the irresponsible Fed free-money policy and fiscal over-stimulus of the pandemic–that it’s the kind of thing quickly leads to a nasty domino effect when things unwind.
There’s massive amount of margin debt and speculation right now propping up bubbles, a huge amount of over-leverage with auto loans going delinquent and we’re already seeing cracks in the dam, ex with the Tricolor bankruptcy recently and all their AAA-rated debt packages being exposed as just wrapped up bad debt just like in 2008 GFC. This leads to the same pressures, starts small with a few over-leveraged players unwinding and then gets contagious. At least the banks are comparatively insulated compared to 2008 due to GFC reforms, but investors and over-leveraged speculators are not, and margin calls and other unwindings can quickly snowball hard.
Pablo,
More a tablecloth pull kind of person myself but have to do it just right.
“Look at the shiny object” they’ll breathlessly proclaim. Reality… if you’re awake?
Lipstick on a pig
Thanks a million for being the voice of reason and the antidote to AI slop…I made a donation and I always really appreciate all your writing!
Thank you!!