Homebuilders rant about the tough market.
By Wolf Richter for WOLF STREET.
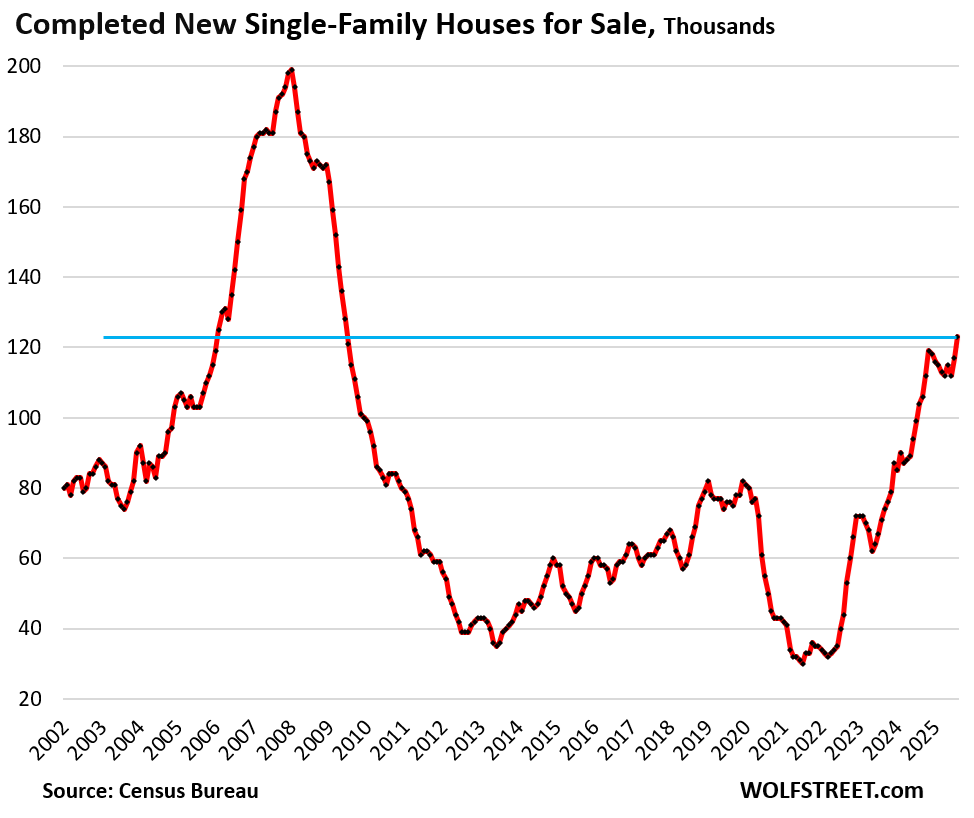
Inventory of completed new single-family homes for sale jumped to 123,000 homes in August, the highest since June 2009, up by 18% year-over-year, and up 62% from August 2019, according to data released today by the Census Bureau.
These essentially move-in-ready “spec homes” form the part of the inventory that homebuilders are most motivated to sell since they have a lot of capital tied up in them.
But inventory of homes at all stages of construction dropped by 14,000 homes in August from July, to 490,000 homes.
All of that plunge occurred in the South, where inventory plunged by 15,000 new houses for sale, a huge outlier (more in a moment).
This plunge was powered by the inventory of homes under construction, which plunged by 23,000 homes (-8.1%), to 262,000 homes, even as the inventory of completed homes jumped. That -8.1% was the biggest month-to-month plunge since December 2008.
But even at 490,000 homes, total new home inventory for sale was still up by 51% from August 2019, and by 3.4% year-over-year. And
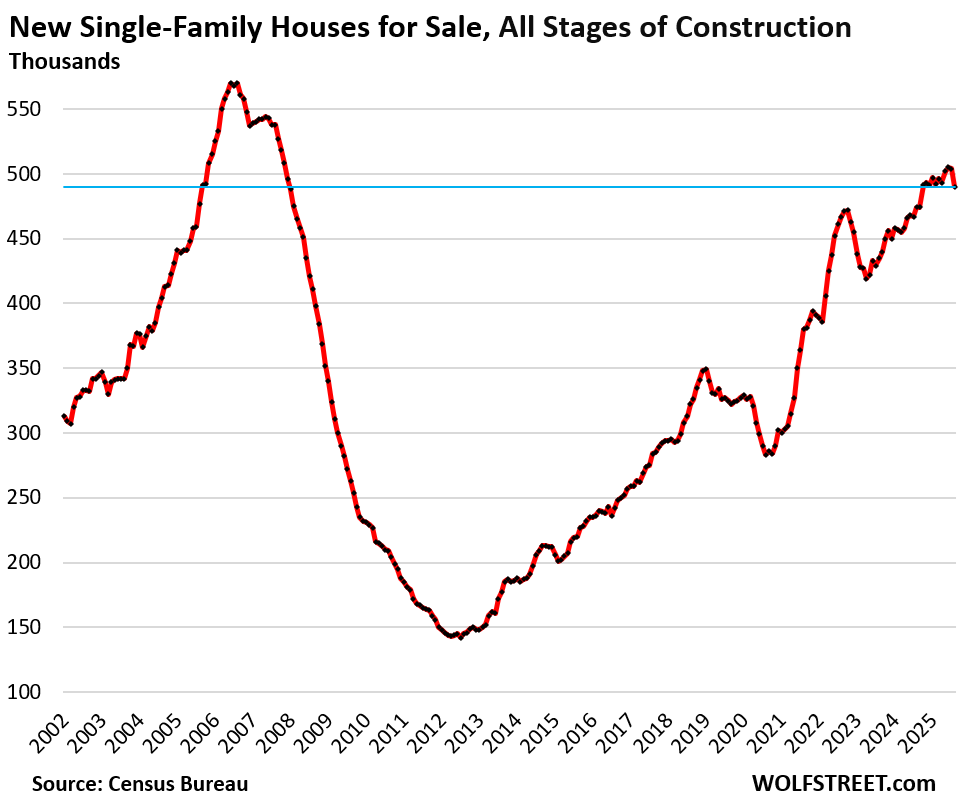
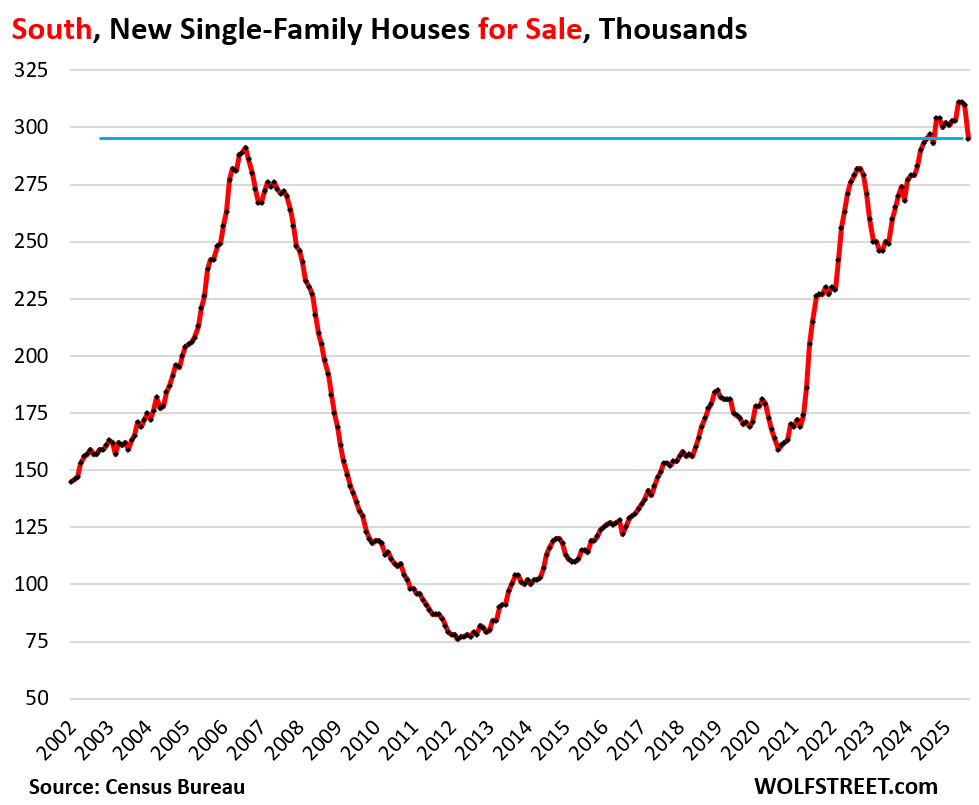
In the South, new-home inventory plunged by 15,000, a huge outlier plunge from record levels, to 295,000 homes for sale, still above the Housing Bust level, and up by 78% from August 2019.
This one-month wonder in data that is subject to heavy revisions will likely be revised back in direction of the recent mean over the next two months.
The South accounted for 60% of total US new home inventory.
Sales, another one-month wonder to be revised: Sales of new single-family homes spiked to a seasonally adjusted annual rate of 800,000 in August, by far the highest since December 2021, up by 20.5% from the prior month, and up by 15.4% from a year ago, according to the preliminary data released today by the Census Bureau.
That spike occurred due to an outlier spike in the South (more in a moment). Outliers like this are generally revised back in direction of the recent mean over the next two months.
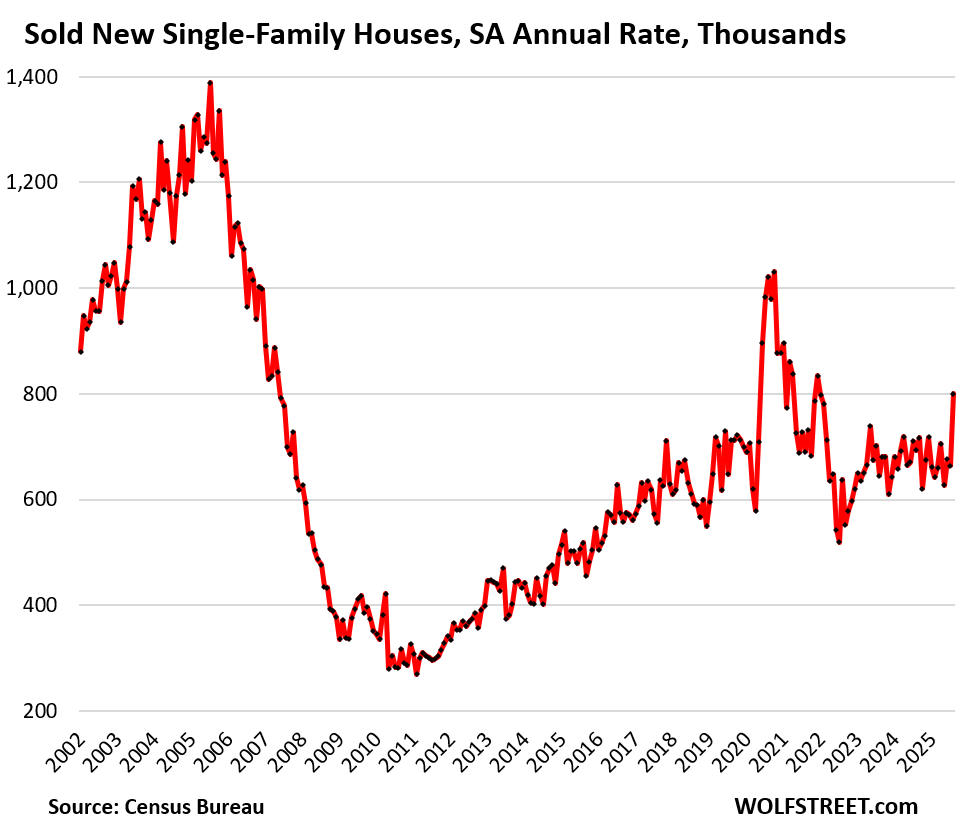
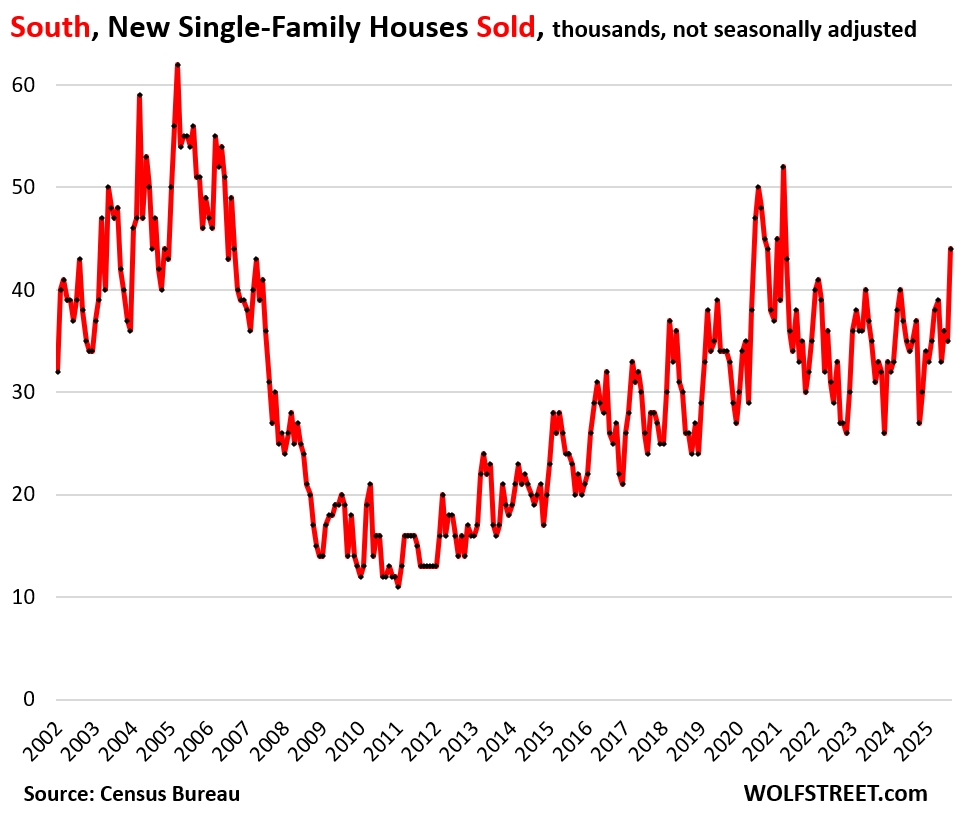
All of this spike occurred in the South, where sales spiked by 25.7% from the prior month and also by 27.5% year-over-year, to 44,000 new homes sold (not seasonally adjusted, not annual rate), by far the highest since March 2021, around the peak of the free-money boom. I expect this outlier spike to get revised back in direction of the recent mean.
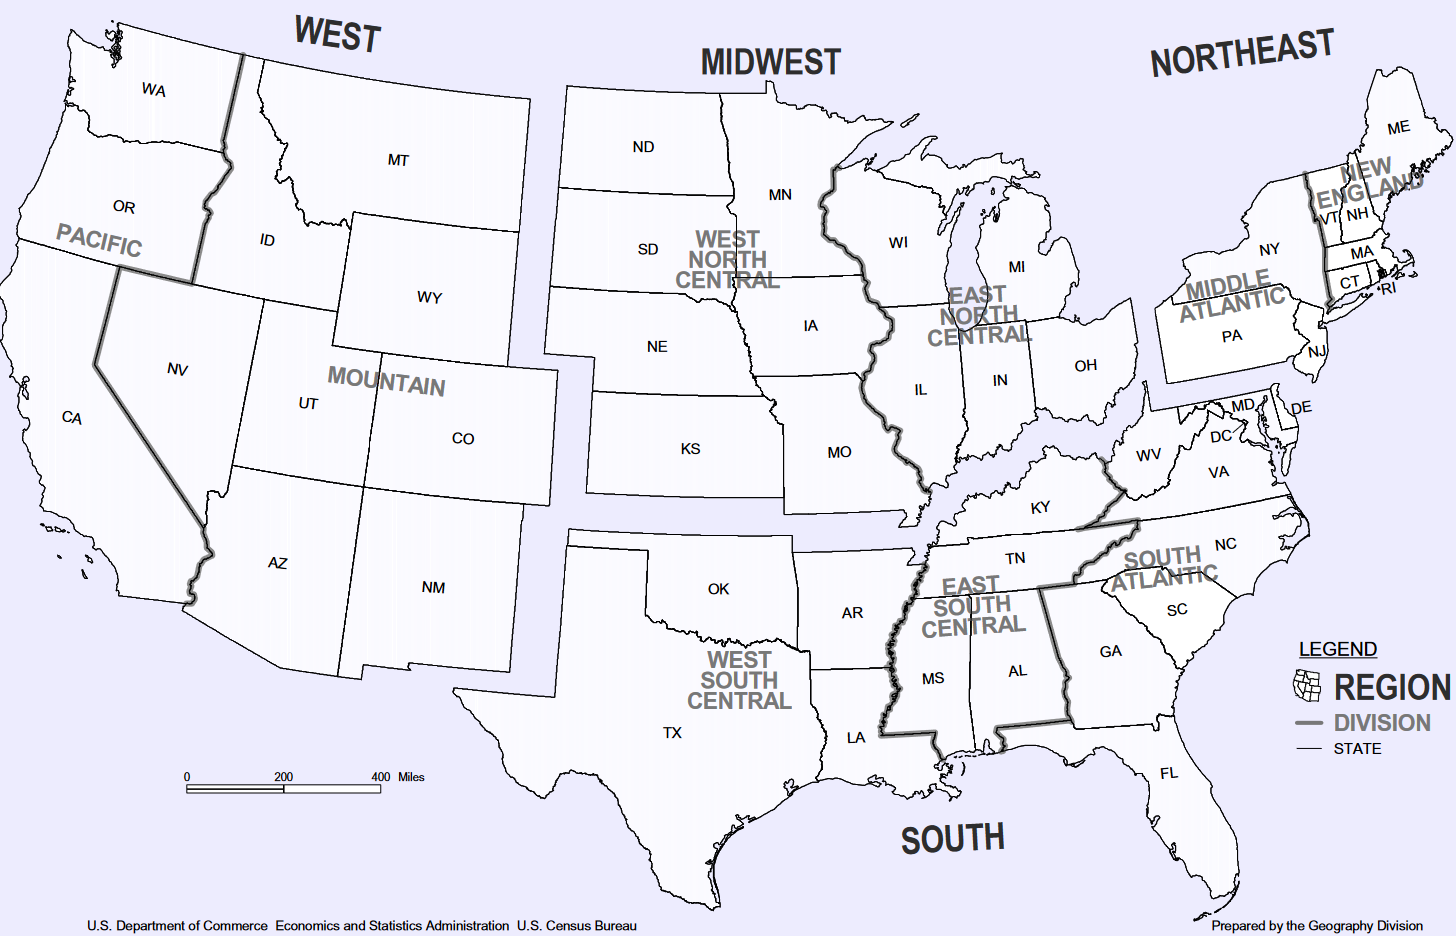
The South, a huge Census Region that is dominated by Texas and Florida, accounted for 67% of total US new-home sales in August (a US map of the four Census regions is below the article at the top of the comments).
Homebuilders reported in quarterly filings that they pushed sales with incentives, price cuts, and aggressive mortgage-rate buydowns, particularly in the South where unsold inventory has been stuck for over a year at the highest levels ever.
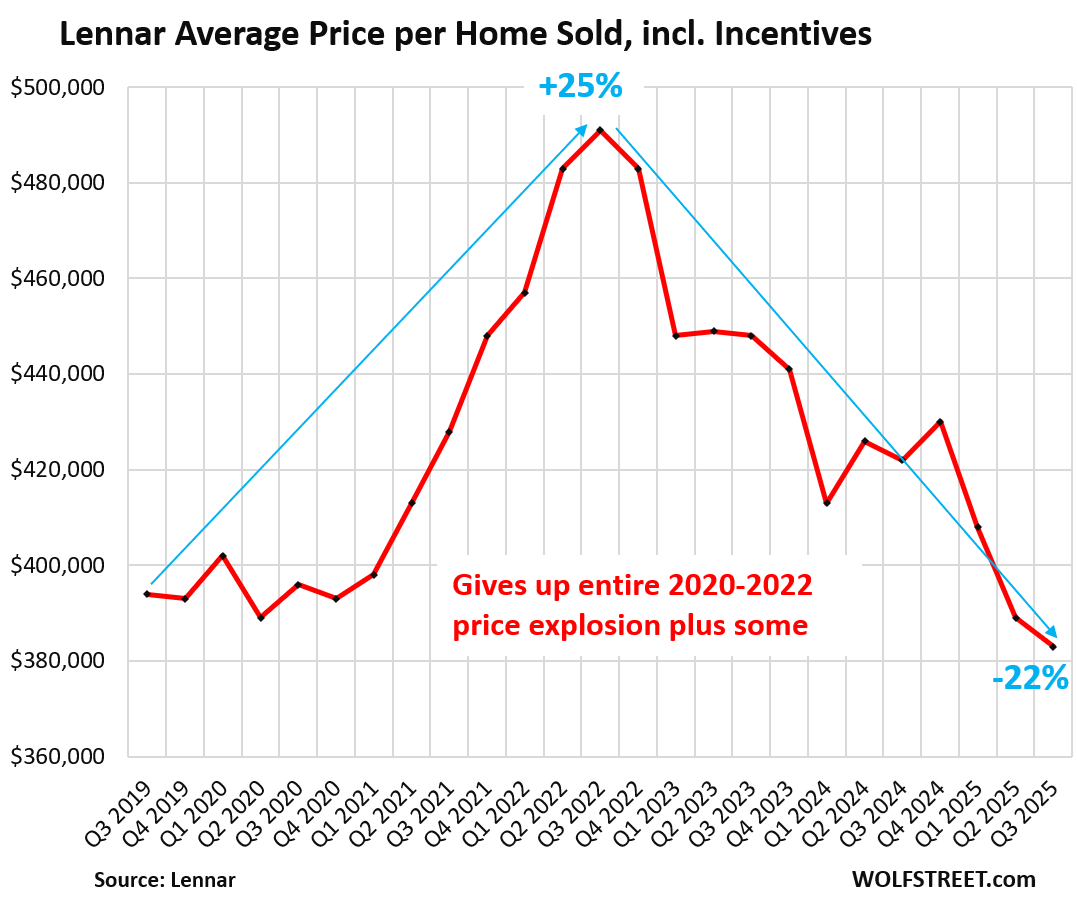
Lennar reported last week that the average price of the homes it sold in Q3 through August, including all incentives, dropped by 9.2% year-over-year, and by 22% from the peak in Q3 2022 (more in a moment).
Its gross margins dropped to 17.5% in Q3, from 22.5% a year ago (and from 29.2% in Q3 2022!), “primarily due to a lower revenue per square foot [lower prices per square foot] and higher land costs,” that were only “partially offset by a decrease in construction costs,” the company said in its filing.
With these efforts, Lennar was able to maintain its unit sales volume, which edged up year-over-year, even as its revenues from homebuilding fell 8.8%, while operating earnings from homebuilding plunged by 49%, net income plunged by 50%, and earnings per share plunged by 46%!
“Sales volume was difficult to maintain and required additional incentives in order to achieve our expected pace and to avoid building excess inventory,” Lennar co-CEO Stuart Miller said during the conference call.
So I expect this sales spike in August, as reported by the Census Bureau — which contradicts what homebuilders have been saying — to be revised down over the next two months.
Prices….
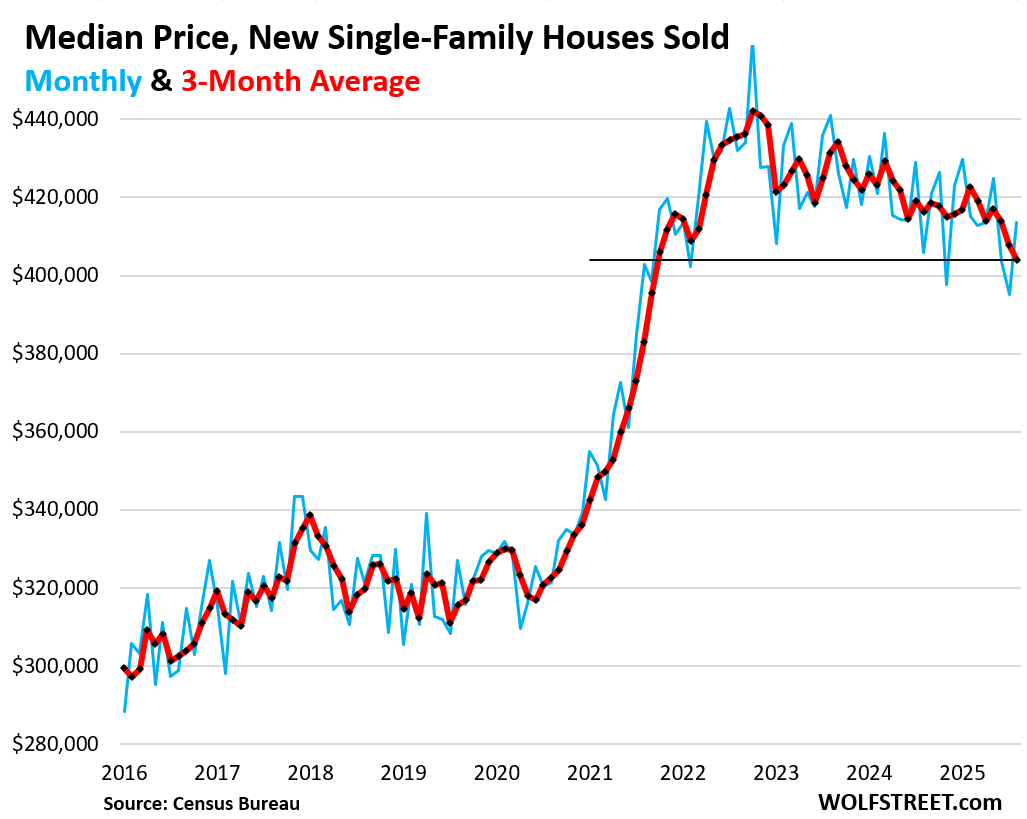
The median price in August rose month-to-month to $413,500, but July was revised down today to $395,100, the lowest since July 2021, according to the Census Bureau (blue in the chart below).
The three-month average, which irons out some of the month-to-month squiggles and includes the revisions, dropped to $404,067 (red), the lowest since September 2021.
Year-over-year, the three-month average was down 2.9%, and compared to the peak in late 2022, it was down 6.3%. It’s the three-month average that matters, not the month-to-month to-be-revised squiggles.
But the Census Bureau tracks sales prices of new houses by the prices written into purchase contracts that buyers signed. These contract prices do not include the costs of mortgage-rate buydowns and some other incentives.
With the costs of the buydowns and incentives included, home prices fell further – we know that from builders’ quarterly financial reports, such as Lennar’s average price of homes sold. More in a moment.
The price explosion in 2020-2022, when FOMO-and-free-money-addled buyers were willing to pay whatever, led to the profit explosion at homebuilders: Lennar’s gross profit margin exploded to 29% during that time, and it’s now back to 17.5%.
Lennar’s average sale price, including incentives: Lennar disclosed that its incentive spending jumped to 14.3% of revenues in Q3, due to the costs of mortgage-rate buydowns and other incentives, the highest incentive spending rate since 2009.
Lennar’s average price per home sold dropped to $383,000 in Q3, down by 22% from the peak in Q3 2022, and below its average sales price in 2019 [I discussed this here: Lennar Cuts Average Selling Price Below its 2019 Level, and its Home Sales Held Up].
These big homebuilders have to maintain their businesses, and have to find the mix of price points and incentives at which they can build homes and sell them, and they sacrifice some of their fat profits to get there. They cannot decide to just outwait this market.
And it shows just how tough this market is, and what it takes to maintain unit-sales volume:
Inventory for sale by region.
For inventory and sales in the South, see above.
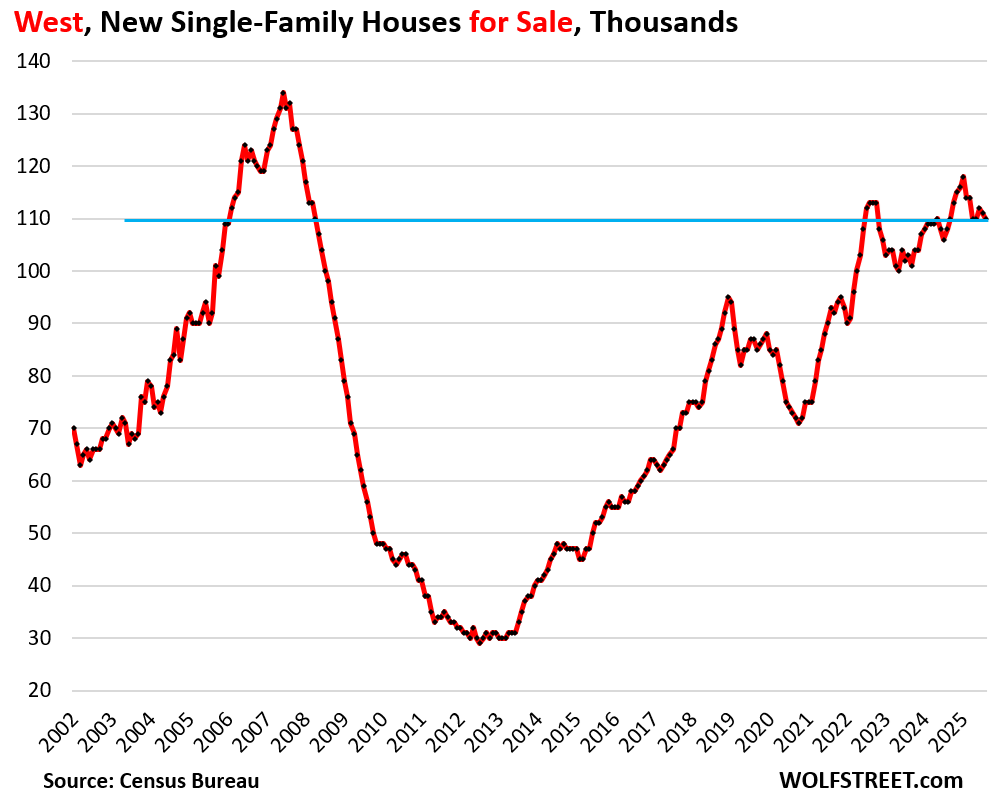
In the West, inventories of new homes for sale edged down to 110,000 homes in August, up by 1.9% year-over-year, and up by 28% from August 2019 (a US map of the four Census regions is below the article at the top of the comments).
Sales in the West dropped by 8% year-over-year to 12,000 new homes (and the prior two months were revised lower).
The West, dominated by the mega-market of California, accounted for 18% of the total US inventory and for 22% of total US sales.
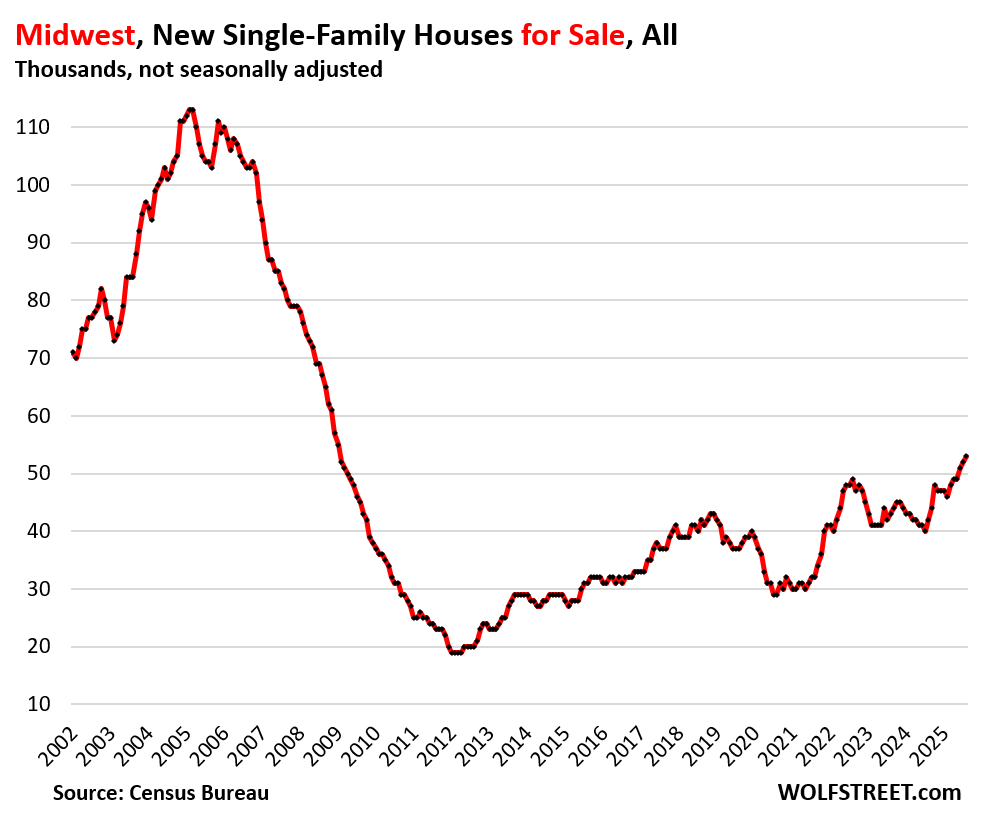
In the Midwest, inventories of new homes for sale in August ticked up to 53,000 homes, the highest since January 2009, and July was revised higher. Year-over-year, inventory jumped by 26%, and compared to August 2019, it jumped by 41%.
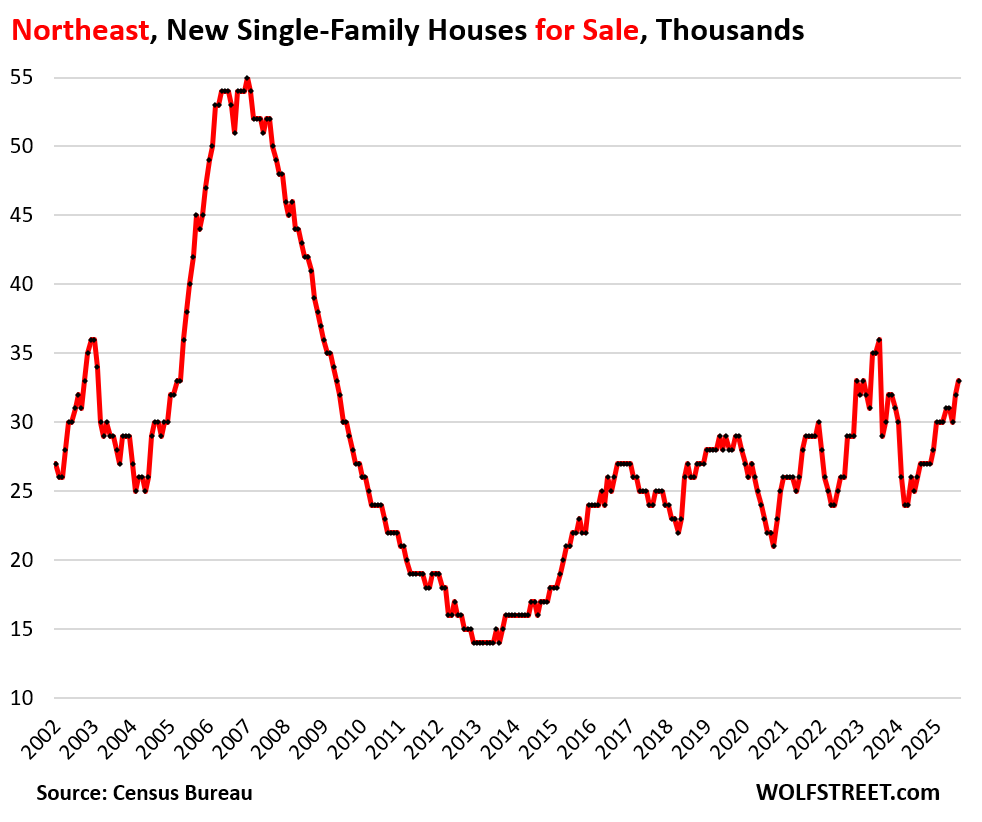
In the Northeast, inventory rose to 33,000 homes, up by 22% year-over-year and by 18% from August 2019.
The Northeast is a relatively small area with big densely populated cities where multifamily housing (condos and apartments) is a far bigger part of new construction than single-family housing.
Enjoy reading WOLF STREET and want to support it? You can donate. I appreciate it immensely. Click on the mug to find out how:

![]()
The promised map of the four Census regions of the US:
I had lunch with a friend, who is the director of sales for a national HB in FL. She said they had a much better quarter than expected. There are so many youtubers that are preaching the Fl housing market is crashing without hard facts. Prices are down a bit, giving a small percentage of covid gains back, but it seems like normalcy is back to the SF market. Condos are a different can of worms.
🤣 “…better than expected…”
They didn’t go to hell all the way in one quarter? Just partially?
Lennar’s quarterly report was also “better than expected,” with earnings cut in half year-over-year as profit margins plunged to 17.5% from 29% in 2022 — see article. “Better than expected” is a hocus-pocus phrase used to pull a bag over gullible people’s head.
Also, seems you’re mixing together new homes (builders, your contact) and existing homes (your reference to YouTubers & condos).
So just for fun, prices of existing single-family homes in FL (we know that condos are a lot worse off):
I take Miami is not part of the bubble?
It was part of the bubble (prices explode), and now it’s part of the down turn (prices decline). I just didn’t post the chart. But it got a late start.
“City” of Miami:
SFH:
MOM: -0.5%
Yoy: -1.9%
from peak a year ago: -1.9%
Condos:
MOM: -0.4%
Yoy: -5.3%
from peak: -5.8%
Here is a current chart of the “metro” of Miami (Miami – Fort Lauderdale – West Palm Beach), prices for SFH and condos combined: -4.3% from peak, posted last week:
https://wolfstreet.com/2025/09/16/the-most-splendid-housing-bubbles-in-america-aug-2025-price-drops-gains-in-33-large-expensive-metros-us-home-prices-fell-yoy/
“Better than expected” has been the stock price-bump for the past decade (+?).
Lower that “expectation bar” so as to make it a trip hazard, and increase the ALL CAPS font size on the earnings BEAT!
Watch the prices defy gravity indefinitely!
“Prices are down a bit, giving a small percentage of covid gains back, but it seems like normalcy is back to the SF market.”
For normalcy to be back to market, home prices need to go down by 50% or so.
Not sure what your friend is smoking!
Hopium, it’s been legal for a very long time now and they do make sure average Amercians smoke as much of them as possible
jon,I am not sure they are smoking anything…..
That said,who the hell got into me shrooms!
I still wait true non covid (the flu) insanity pricing.
I will say as a holder of metals in hand the gold upswing rapidly is causing me a bit of concern.
I just don’t see a 2010 style crash. Construction costs are substantially higher than pre-Covid. Labor and materials are very expensive right now. I own a plot of land, and looped into constructing a second home. I Received multiple quotes, most ranging from 250 per square foot to 325 per square foot. And nothing overly fancy. So we’re talking $500,000-$650,000 for a 2000 square-foot house. This does not include the cost of the land.
I have seen people talking online about cost as low as $200 per square foot. That still puts you at $400,000 plus the cost of the land, which may be 450 K if you can get a deal on some land This as close to the median home price in my city of Las Vegas
Even trying to get some renovations done right now just does not make financial sense.
Once hot markets like SFO and Austin has already gone down in price by more than 22% from peaks and still going down.
You can still find brand new homes for much less than $200 sq feet.
what you are suffering from is bias I guess.
Where are you located?
Because that is going to have a significant/huge impact on land costs and (first pass) constuction costs/quotes.
I think that a post-2000 year by year look at new construction costs (per square foot, to help standardize things) in various metro metros would be very enlightening.
1) Quoted/actual PSF new-build costs are pretty crucial – since new-build supply/prices provide the incremental supply/price competition that essentially defines the dynamics of the much larger *existing* home market.
1)a) You can’t get $250 psf for an existing house if new builds are going for $200 for example (just picking random numbers to illustrate point). It is extremely rare for used goods to be able to price higher than new goods – so new good production prices really help determine used good prices.
1)b) That said, new build psf prices have simply exploded post 2000. My personal belief is that a *ton* of that is attributable to various incarnations of ZIRP – which provided the fuel for soaring final prices – otherwise the builders could not have gotten blood from a stone…a populace with stagnant or slow growing incomes.
1)c) Opponents of this view will point to land, labor, and lumber cost increases (although, note, these are all still a function of *demand* – without ZIRP engorged/deluded final product *demand*, those component price increases would be much less likely to happen.
2) RS Means, etc – allege to supply accurate new build PSF costs by metro, by year – but I’ve long wondered about these reference materials. (See also, auto repair manuals)
(I know this reader says he called around, so the following may not apply in his particular case – but price/cost reference guides are a powerful force in general)
Many/most people don’t put much energy into price comparison (or, god forbid in America, price haggling) – so “reference pricing” can pretty easily become a tool of abuse.
For one – and it is a big one – it is very easy for “price reporting” to actually be “price *targeting* – meaning that “reference pricing” is actually more helpful for attempted localized collusion rather than honest reporting. (See also, auto repair manuals).
In the end, it is product/home *suppliers* who are paying for RS Means services – so the mind set of RS Means, etc. becomes attuned to that of home builders – who are always interested in making *more* money not less, in higher prices, not lower.
So those “price reference” guides definitely may not be honest brokers of information – I think there are definite dynamics at play that encourage an upward bias in “price/cost reporting” in many instances.
The Florida housing market is frozen up. I remember reading an article that the average person moving to Palm Beach County from New York City
had an average income of over $750k. They drove the housing prices us there (and I’m sure it was a similar situation elsewhere in the state), but given that they were “working remote” and those jobs are gone, there clearly isn’t enough income here in Florida to sustain prices that are double what they were in 2019. Sellers just haven’t realized it yet.
My wife and I go to open houses when we’re curious, and a lot of people showing up are young families with their well-to-do looking older parents in tow. I suspect the “wealth effect” from people’s stock portfolios is also affecting housing in some way, as people are gifting down payments or more to kids. How much we don’t know.
Sucks to be a normal working man from a non-wealthy family I guess.
TS305- …t’was often thus, but lacking the ‘designer bootstraps’ of generational wealth these days certainly doesn’t make it any easier…
may we all find a better day.
I got run outta South Florida (grew up in WPB) and then run outta Central Florida in my adult life cause I didn’t want to live in the ghetto and couldn’t compete against well-to-do. That crap has been going on since Flagler brought the railroad…
Now I did the same thing to some poor slob like me in my North Florida town and just make the drive to CF when I gots to show up.
Feel your pain, bruh.
“Sucks to be a normal working man from a non-wealthy family I guess.”
You bet. 20% of Americans possess 90% of the wealth. That’s the definition of an oligarchy. At least in my dictionary.
So the government taxes income. And prevents you from getting wealthy.
‘“New home sales soar 20% in August to a three-year high” latest MSM headline, guess we better all jump back in the market to not miss our. The sales train is off to the moon again… Oh that try hard headlines…
You could have a very negative event – a disastrous bus crash witnessed by ten people. Bus totally annihilated. Nine might say “It was horrible, the bus got totally crushed.” Tenth guy might say “Oh, how splendid – look at that massive pile of scrap metal to be recycled.”
You can always spin a negative thing into a positive, in one way or another. Same with the housing market.
New home construction is generally restricted to second and third tier locations, far away from where people work and actually want to live. People may commute two hours or more a day, because they have a family, can’t afford private school, and want to provide their children a nice home and get them into a decent school. But millenials and Gen Z don’t have all that many children. They are better off renting close to work and wait until the boomers will be ready to pass on their homes in the nicer neighborhoods.
Interesting that construction costs are coming down. Toll brothers reported the same thing. Hell been construction costs being at normal inflation levels would be fine.
Midwest report mirrors what we are experiencing with our business.
Heavily weighted to new builds.
Booked for the rest of the year and
Adding to wait list for next spring.
Nice new 3K sqft house behind us, finished last month, now priced at $400/sqft, down from $500.
Open house this Saturday will be interesting reflection on mkt here in a working class hood in the saintly part of tpa bay area going through transition from 700 sqft cottages built very simply/thriftily in 1950s now selling in low to mid $300Ks, mostly for the land.
$1.2 Million for a 3000 sf house❓ Surrounded by little shacks❓ The money frenzy is over. The coke fueled party is over. The sun is up.
No thanks to a home selling for likely three times what it is really worth. Boy, that coffee smells good ❗️ What a beautiful sunrise! ☀️
Are mass deportations affecting the workforce in the construction industry? If builders are unable to find enough workers, it’s got to slow down the numbers of new homes entering the market. Anyone out there have any information on this?
Cheap labor = Shitty work.
You don’t get what You paid for.
All of the fundamental factors of real estate have changed making it seem useless to use the fundamentals of the past. Things change so fast especially due to tech. For example, many people are privy to the search of homes, interest rates vis-a-vis inflation and actual purchasing power changes like the dynamic pricing of Amazon products (again based on search results). There are so many parasites siphoning the value from real estate which is easy prey since it is a need rather than a want. Everything related to home ownership is outrageously costly. The home maintenance trades have joined in for a hearty portion of homeowner income. Government regulations add cost to every facet of maintenance and building. Insurance goes up faster than a house will burn…. I do believe this will collapse and it will be brutal beyond current imagination.
Baby Boomers wanting to cash in stocks and draw out equity will add fuel to the fire. Here, I see many people with varied opinions with many being partially right but I assert seeing the statistics no longer tell a story important to the single home buyer who is trying to figure out how to access this wealth that everyone else is feasting on…
In my case, 24 years ago, I bought a ranch for 345K. It is now worth say 825K. Take out my mortgage and deduct the selling fees and the 100K I have put into remodel and repair and all I have done is not have to pay 4K for a new apartment near the railroad tracks, next to freeway onramps and the immigrant swap meet across the street from these new apts.
There is still some value in moving as CA is now becoming 3rd World.
Tn is the best in most respects especially in not being taxed on state income, heavy property taxes, and the clear opinion that government is essentially a parasite.
It is very interesting to watch all twist and turn because all the patterns of the past are losing relevance to being able to see what is happening until it has happened and you just missed it because you are not tech savvy.
Yes, excellent options still. Recently the small houses bought by locals to flip are not selling so you can see how little this homes cost prior to being flipped. I may buy one with land, tear it down to slab and electric panel, rebuild a modest single story with out buildings to keep my property taxes low on the primary house. Manchester, TN is about an hour from Nashville and about an hour or so from Chattanooga which is good for activities and shopping.
The ugly politics of CA and the taxation to come will become intolerable (already is). Financially, only a few will do well in the new CA economy.
It’s good to have a unbiased numbers to consider as we all navigate this “mark o fantasy” world.
Prices have a long way to fall…
Hedge accordingly.
Does anyone ever buy a ‘National Home Builder” tract house without getting the mortgage from them? As in, what is the place really worth?
Is it just a reflection of people who are in the market to buy a house have just decided why pay more for used and buying up new inventory. This feels like a reflection of home sellers not wanting to reduce their prices while home builders have gone all in on incentives.
I’m waiting for Wolf’s report on the GDP report that came out, but my generally feeling hasn’t changed. We’re not going to have a recession or even close to it as long as we are running $2.5-3 trillion deficits every year.
What Slowdown? Q2 GDP Growth Revised Up to Hot Zone of 3.8%, Stronger Consumer Spending & Private Fixed Investment
Government consumption and inventories were a bigger drag though. All adjusted for inflation.
Ah… but the coming hangover just keeps getting worse and worse… How to protect yourself against the coming government austerity measures? I’ve been spending a lot of time looking at Greece and Spain lately, and their austerity measures and the impacts it had on their societies.