Unemployment claims are even with a year ago and are below two years ago.
By Wolf Richter for WOLF STREET.
Every data point about the labor market is getting twisted into “the labor market is cracking” or whatever by the cut-rates-now crowd. Today, we got another the-labor-market-is-cracking data point, that is depicting a decent labor market:
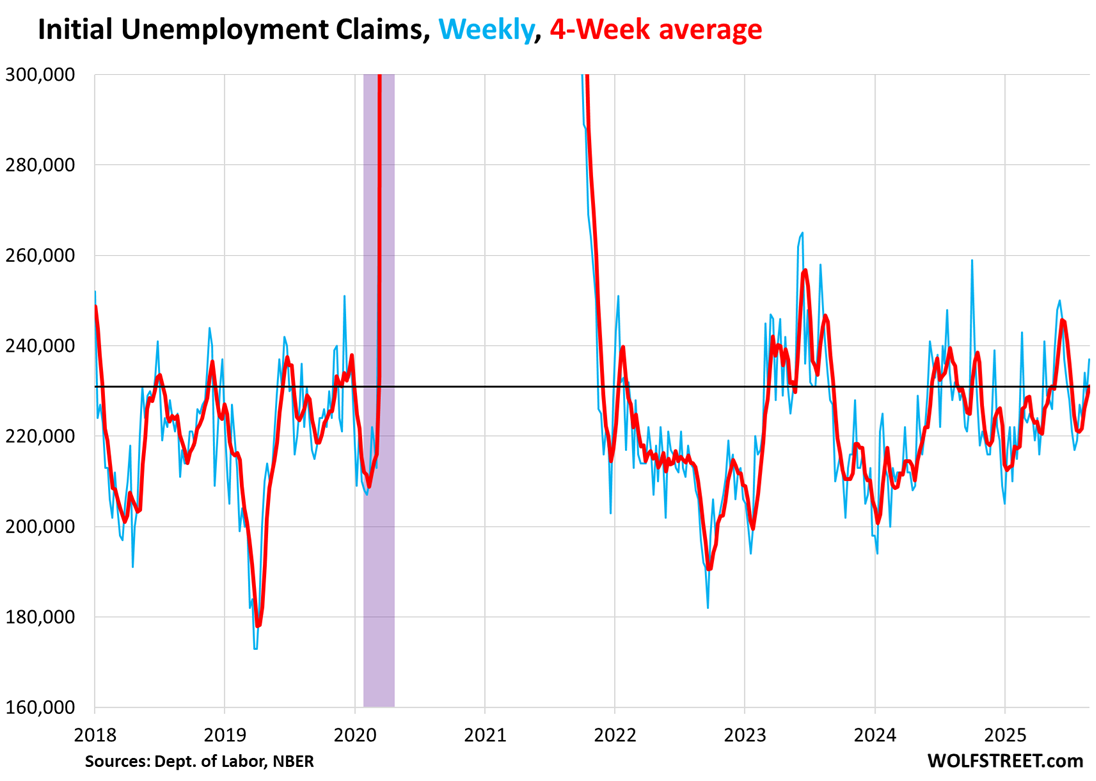
Initial applications for unemployment benefits (“initial claims”) in the week through Saturday were at the same level where they’d been a year ago at the end of August 2024, and below where they’d been at the end of August 2023 as per the seasonally adjusted four-week average released by the Department of Labor today.
At 231,000, the seasonally adjusted four-week average was up a little from early August, but down from the recent peak in mid-June (red).
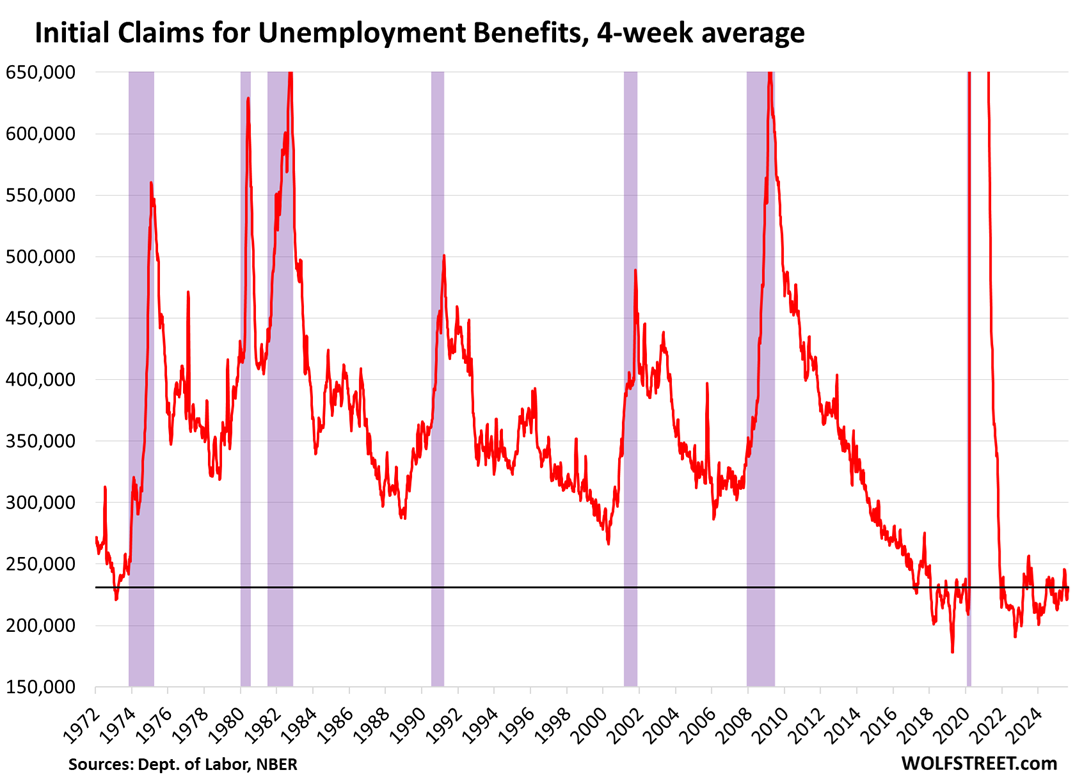
And in a historic context going back to the 1970s, initial claims are low, despite the substantial growth of nonfarm payrolls over the decades.
They were lower only during the tight labor market of 2018 and 2019, and during the period of the labor shortages coming out of the pandemic — and also for a moment in 1973.
The unemployment claims data here are based on actual unemployment insurance applications filed at state unemployment agencies by workers who’d lost their jobs. This is administrative data, not survey-based data. The state agencies then submit this data weekly to the US Department of Labor, which combines it and releases it. If states don’t make the weekly cutoff for the submission of the data, that data goes into the next week, and if a big state does that, such as California or Texas, then claims fall during that week but jump the next week, which is why the Department of Labor also releases four-week averages of the data, which iron out those meaningless week-to-week squiggles.
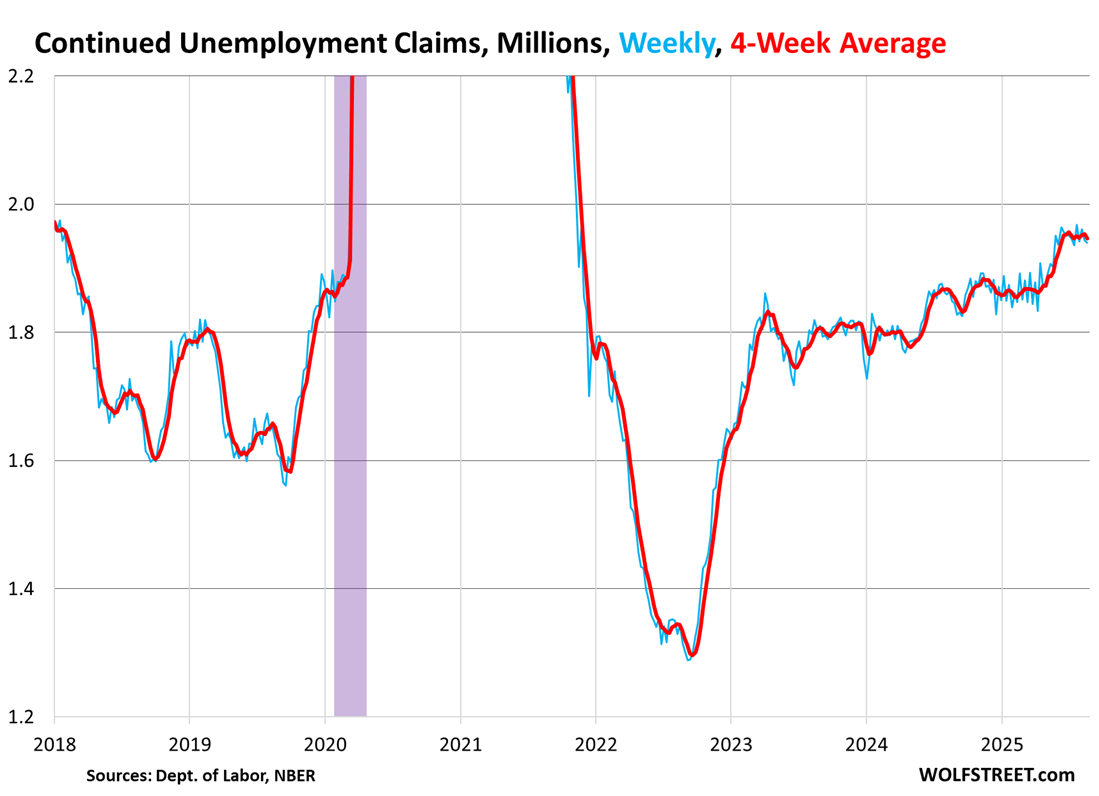
The people who filed for unemployment insurance at least a week earlier and are still claiming unemployment insurance because they still haven’t found a job form the “continued unemployment claims” or “insured unemployment.”
Continued unemployment claims dipped in the latest week, and the four-week average also dipped, and at 1.947 million has been roughly level for the past two months.
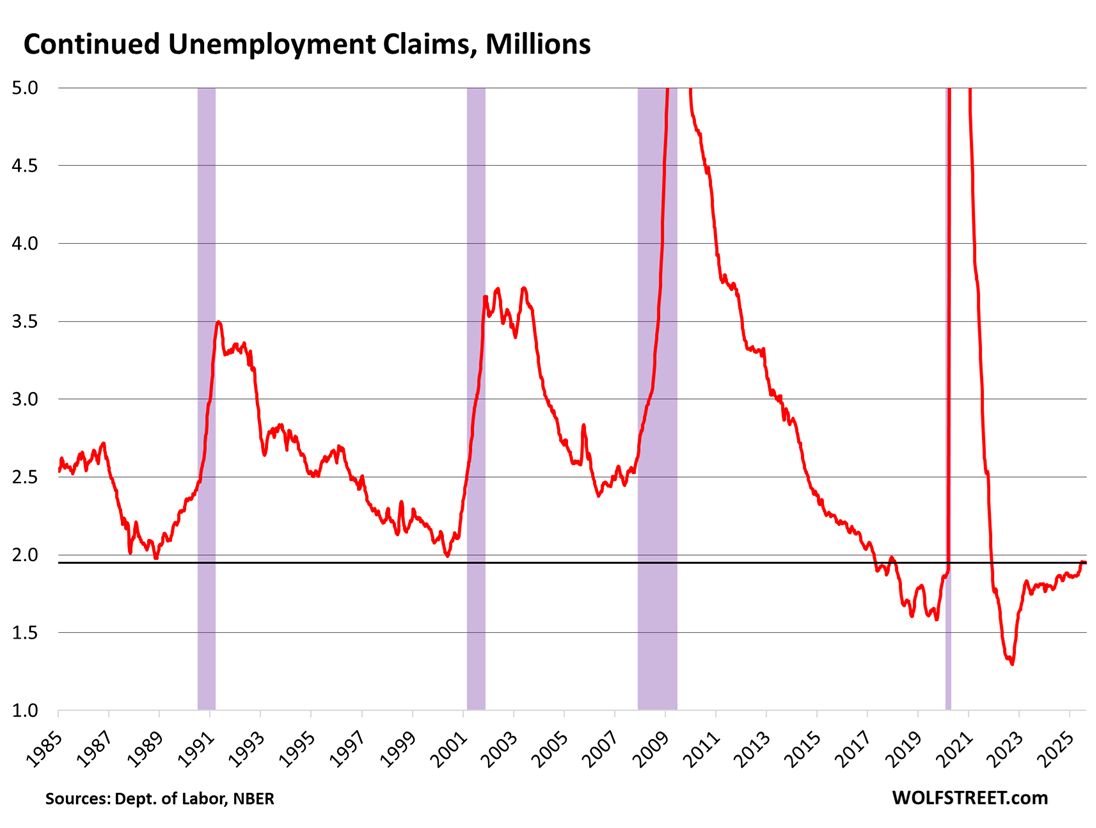
The level of continued unemployment claims is up from 2024 and 2023, but is still historically low, lower than any time in the decades before 2018 – more in a moment:
Over the past four decades, it’s only during the tight labor market in 2018 and 2019 and in the years since covid, particularly the period of the labor shortages in 2021 and 2022, that the level was lower – despite the much larger nonfarm payrolls.
So people remain on the unemployment insurance rolls a little longer than in 2022-2024 and in 2018-2019, but not nearly as long as they did in the decades before 2018.
These unemployment claims tell us that companies are laying people off at a historically low rate, but the laid-off workers spend more time on the unemployment rolls looking for a job than they did in 2022-2024, and yet, they spend a lot less time on the unemployment rolls than before 2018.
So this is no longer the labor market of 2022 and 2023 where employers were struggling with labor shortages. But these unemployment claims depict an overall decent labor market in the historical context over the past four decades.
Enjoy reading WOLF STREET and want to support it? You can donate. I appreciate it immensely. Click on the mug to find out how:

![]()
My favorite trend when it comes to employment:
https://fred.stlouisfed.org/series/LNS12300060
Employment is full. Able bodied working age people are working at a historic clip. There are still some hold out of people who prefer single working parenthood, but there isn’t some magical labor force to dip into.
Which is why we’ll continue to see services inflation rise.
The AI Datacenter and electrical grid infrastructure is going to be nearly impossible to staff.
I think the swinging door will be any reshoring of manufacturing. We don’t have the workforce to build or operate it (or we’ll need people to rotate out of service sectors, leading to even more inflation in those wages). Traditional industries can’t get equity or debt to build facilities that can’t compete on cost, 15-30% tariffs be damned.
So Tariffs will either come from ballooned profits or consumers pocketbooks.
1. this was about unemployment claims (administrative data not survey data), but you knee-jerk-linked data from the month-ago household survey of the jobs report = survey data (the new set will be released tomorrow). So your link has nothing to do with this date here.
2. The employment to population ratio, which you linked, is heavily skewed by the huge wave of boomer retirements: they’re still in the population (the lucky ones) but if they’re retired, they’re no longer working. So your link is meaningless unless you understand how it’s figured.
3. A much better chart is the “Prime age labor force participation rate” which tracks 24-54 year olds and is therefore not skewed by retirements. It is very high, showing a strong labor market:
Wolf I was agreeing with you!
I published the 18-54y/o employment ratio, which is the ratio of working 18-54y/o to total population of 18-54y/o (LNS12300060)
This is basically the same as the the 25-54y/o Labor Force Participation Rate (LNS11300060).
If you overlay the charts on FRED you’ll see they are basically the same. The gap is LNS12300060 accounts for actual current employment. LNS11300060 includes all 18-54y/os that want to be in the workforce, whether they have current employment or now.
“I published the 18-54y/o employment ratio,”
Good lordy, I missed the age bracket. Thanks
“I think the swinging door will be any reshoring of manufacturing.”
We’re going to see a hard swing back to immigration. The first sign will be a right-leaning politician describing immigration as a necessity to bring down cost-of-living.
Yup this is spot on. And boldly stating the lack of immigrants in this country is due to progressive policy.
It’s ILLEGAL immigration they’re cracking down on. Not legal immigration.
Hi Wolf,
Thanks for an excellent update on unemployment. I’m old enough to remember when a rate in the mid 4% range would have been considered a dream.
One data related question piqued by your second chart: initial claims were substantially higher from 1973/4 until about 2017 – a period of 40+ years (and unadjusted for overall employment growth) so the period from 2017 to present – excepting the COVID period – was even lower in proportional terms.
Is it a possibility that the lower initial claims are in anyway driven by the emergence of the so-called “gig” economy? My understanding is that independent contractors wouldn’t be covered by unemployment insurance and so would be ineligible to submit claims. Could this potentially drive down the number of claimants?
Not trying to assign work – a genuinely curious question.
“Is it a possibility that the lower initial claims are in anyway driven by the emergence of the so-called “gig” economy?”
NO, because nonfarm payrolls — so regular employees not gig workers — have grown substantially over the years and decades, from 138 million 10 years ago, to 160 million now.
But the number of self-employed (“gig workers”) has remained relatively stable since covid at 9-9.5 million. This is from the jobs report’s household survey, which is very volatile.
People make up all kinds of stuff about gig workers and the gig-worker economy, but it’s just BS:
I can’t wait for all hell to break lose when continuing claims reach 2M..
Don’t confuse me with the facts…prices aren’t too high, rates are
Yeah but sadly it doesn’t matter; in a way that crowd has won, it’s pretty 100% rate will be cut this month; perhaps they will scream louder it needs to 150 basis points or whatever…either way they got what they want
Then the 10 year (I believe the 10 year is the one that will rise) will shoot up to over 5% hopefully, maybe, should happen,Come on vigilantes!!! Rooting for you!!! And then housing rates go up!!!! Bahahhahahha
The labor market is indicative of where employers feel the economy is headed; they won’t hire unless they have a good feeling in their bellies about the money flow around them. The figures suggest that we are going to continue with a decent economy for some time to come; it’s only a matter of time before a recession hits, perhaps sometime in 2027.
There is no job growth, though.
BLS, ADP, Challenger; all reporting the same thing. Job gains at or near zero. The Fed Beige book also corroborates that data.
Should the Fed cut? Who knows. Rate cuts won’t save the economy either way, so I’d rather they focus on keeping inflation subdued.
On a personal anecdote, I review permit applications in a local jurisdiction in King County, Washington. Development applications this year have been as slow as I have ever seen it. Large projects have not been coming in since 2023, which makes sense given higher interest rates, but it is especially slow this year.
I’d be worried about the labor market, personally.
“BLS, ADP, Challenger; all reporting the same thing. Job gains at or near zero.”
Bullshit.
1. ADP +54,000 in August, and July revised UP to +106,000
2. Challenger doesn’t report job gains or losses, but tracks media-reported global layoff announcements, which is useless because announced layoffs in India don’t have an impact in the US.
3. BLS will report tomorrow for August. For July: +73,000
Hey Wolf, so what are your thoughts on the 6 month yield pricing in rate cuts compared to the data in this article? Are fed rate cuts unsubstantiated at the moment?
The 6-month yield as of today hasn’t changed much from the chart in the article I wrote about it on Friday. Same text from Friday still applies:
“It is now pricing in nearly two rate cuts in its window of about 2-3 months, so one cut at the September 17 meeting, and it’s getting closer to pricing in a cut at the October meeting.”
https://wolfstreet.com/2025/08/30/30-year-treasury-yield-stuck-near-5-on-inflation-fears-but-6-month-yield-drops-sees-rate-cuts-long-end-of-yield-curve-steepens-a-lot-mortgage-rates-still-over-6-5/
Personally, I don’t think the Fed should cut, but it will cut no matter what, given the enormous pressure it is under to cut.
But if inflation data come in even hotter over the next few months, and the labor markets continues to be OK, they have enough ammo for more wait-and-see.
Much appreciated Wolf, thanks for the insight.
Job growth is small but not zero for the last 3 months (33k/month). Change in 2025 so far is 85k/month. Typical over the last 2 years is 150k/month. Whether it’s a new trend or a blip will depend on the next few months of data. Times when job growth shows but doesn’t go negative exist, but are relatively rare.
Time will tell!
Prime age employment rate has been flat for 2 and a half years, which really only happened once in history: 1998-2000. Not decreasing yet though.
It may be about maxed out. Some of these people are in school, others are on maternity/paternity leave or taking care of loved ones, some are sick, some have made so much money with their cryptos or whatever that they quit working, etc. The rate can never be 100% or anywhere near 100%.
Agreed. It’s only been higher once and then only slightly.
Employment growth does seem to be slowing though. Hopefully it can hover here at the top for a little while.
Seems like if you have a decent amount of people retiring, combined with about the same amount of entrants, then you don’t need job growth if there is low unemployment. The larger challenge, outside the scope of this article is skills alignment in a fairly rapidly changing work landscape. The US is trying to pivot at current but really remains to be seen if we have the right skill sets for what is needed, although of course no reason people can’t be trained.
“no reason people can’t be trained”
Few companies want to spend on training. That’s why the private sector has tried to outsource job training to colleges for the past 30 years. And that’s why people pay tuition, even though it has risen rapidly. College is job training now for entry-level positions.
So many gainfully employed and the stock markets at all time highs daily bumping higher even still, exactly why are so many clamoring about interest rate cuts again as my last visit to a fast food restaurant assured me that I won’t be back because somehow with all this Goldilocks affordability remains quietly problematic.
It’s almost like we live in an altered state of reality to what’s really going on. Bizarre times to say the least. Housing markets unaffordable, food prices getting there, and yet all this great news daily. I’m sorry, I’m just not paying11$ for 3 tacos, and 30$ for a haircut.
Because the rich want to get even richer. It’s that simple.
lol they always do that is nothing new. The level of debt, deficits is historic. You can’t borrow your way to prosperity
Not sure about you, but where I am, minimum wage is through the roof.
Can’t have higher pay for everybody without having higher expenses…
Usually the same people to claim her for less inflation of the ones clamoring for higher minimum wages, there seems to be a disconnect that people just don’t recognize …
Because the sellers of overpriced assets are starting to seriously sweat and the more they sweat, the more pressure they place on their elected representatives.
It’s a reality bubble for both the elites and the masses…like believing professional sports are competitive outcomes when the actor players get paid, win or lose …
It reminds me a little of turning 18 and becoming eligible to be drafted and sent to fight in Vietnam.
War is inflationary !
A decade later the mortgage rate exceeded 15 pct to combat the plague of inflation eating away at savings.
No mention of your favorite recession indicator? It’s a fascinating observation that I’ve passed it along to all my chicken little clients (with a nod to the source, naturally).
For the unaware see the following:
https://wolfstreet.com/2025/05/08/recession-watch-time-to-dig-out-our-favorite-recession-indicator-again/
No, because we’re so far away it’s kind of silly to even bring it up.
Unemployment is a lagging economic indicator and employers will not lay off their workers until they see no other way to maintain their profit margins. Recent college grads have a hard time finding a job, and they can’t apply for unemployment benefits. This week’s JOLTS report showed job turnover is lower than before the pandemic. Young people can’t afford to buy a home and discount stores are seeing an increase in middle class customers. This all points to a weakening economy, or at least an economy that is looking for a direction. Because of their dual mandate, the Fed will have to lower rates even if inflation will pick up again.
Only your imagination is not a “lagging” indictor.
JOLTS was fine. The T in the name is “Turnover,” meaning churn. The data describes CHURN in the labor market. All it said is that that the churn has calmed down: low quits, low layoffs and discharges, and therefore fewer slots left behind that are newly open, and therefore fewer openings to fill. And yet, job openings to fill, at nearly 7.5 million, were at the record high before the pandemic. So the massive and expensive churn from the pandemic is over, that’s all it said:
There was no net hiring in the latest JOLTS numbers, not surprising given the recent payroll numbers. That was different before the pandemic. I wouldn’t call that fine JOLTS number.
“There was no net hiring in the latest JOLTS numbers”
there is NEVER a “net hiring” in the JOLTS numbers. It only exists in your imagination.
JOLTS measures churn:
— Quits + layoffs & discharges + retires + other discharges = number of job openings left behind.
— hires: the people that fill some of those job openings
— job openings: the jobs that have not yet been filled.
You people have zero idea what JOLTS is actually telling you. You just fabricate some BS that fits your narrative.
Jason said: “Recent college grads have a hard time finding a job,“
In many cases this is because they received an education in: N/A.
It may be “yesterday’s” in-demand, or a broad/ nonspecific field etc.
It’s also largely hubris. I got a degree (granted I probably made poor life choices) and have rarely applied it (never directly). I’m not too proud to just: go to work.
Working should always pay better than not.
The trade school grads are probably doing fine. Plumbers and electricians are in demand (a shoulda/ woulda scenario for me), but these fields are bonafide work. Getting dirty and potentially hurt is not a part of the University Grads’ mindset.
I don’t think Dollar Stores seeing an increase in middle class customers is really an indicator people are tightening up their spending or feeling more financially pinched. They are just convenient, cheap and plentiful and the prestige factor of shopping somewhere else for housewares doesn’t really exist anymore. My wife can afford to go to Target or any other retailer for household stuff, and sometimes she does, but since everything is mostly cheap Chinese crap wherever you buy it she figures why not go to the Dollar Store? Need a broom and dustpan? The quality at DS is not too far from Target and it’s literally a fraction of the cost. DS are also more plentiful in the neighborhoods than big box stores, easier to park and get in and get out.
Einstein said once the rich control the media, you won’t know fact from fiction…the most hated man in the room is the one who tells the Truth, Plato…so as the empire goes doing what empires always do…did you know the bank of England during the Napoleonic wars suspended convertibility and BOE balance sheet went up 130 percent…
When one private equity firm dumps a company to another PE firm routinely besides all the other shenikens we have witnessed the past 25 years…the game has never been more openly rigged…you can buy a trump meme coin at 8 dollars down from 64…what a bargain for you…
What’s a “sheniken”? The closest hit I can find on a search engine is “shinken”, a Japanese sword. Is that…right?
My google came up with Shurkin (chinese throwing star). Reminds me of anchorman. I’m not sure what the network would care about a large wooden boat. lol
“…shenanigans…”, mebbe (…with ‘auto-whatever’, ANYTHING is possible!).
may we all find a better day.
My guess is shenanigans, but misspelled. It would fit in context, at least.
1. The data doesn’t represent reality.
2. If it did, Trump would fire whoever is in charge of it.
Please refer to point one.
So there’s now a term for how people are behaving in the current job market and it’s called “Job Hugging”. Folks are hanging on to their jobs and relatively few are quitting voluntarily and as a result there are fewer vacancies and in turn slow hiring, while the unemployment rate stays low. This is where we are in the current cycle.
Almost every employed person I know is in this boat right now. They are typically underpaid, overworked, and stressed out, but can’t find another job.
Great article. Man I didn’t know jobless claims were so high before the 2000s.
Pay no attention to the man behind the curtain…
Will the future bring us utopia, where no one works because AI and robots serve us, or dystopia where we all are worker drones controlled by the central authority (using AI to control us)?
What was the unemployment rate in Brave New World, Blade Runner, or The Time Machine? How about in Soylent Green?
In the future will 4% unemployment be considered too high, too low, or just right? Or maybe the target be shifted to lowering the employment rate?
“If you don’t eat yer meat, you can’t have any pudding. How can you
have any pudding if you don’t eat yer meat?”
“Every data point about the labor market is getting twisted into “the labor market is cracking” or whatever by the cut-rates-now crowd.”
The long term interest rate should be higher to compensate for the risk.
QE squelched that quaint moral barrier. i can’t help but suspect that the still engorged Fed balance sheet is supporting coordinated market interventions, supporting exorbitant asset valuations.
Many people think that cutting rates will ‘fix’ the housing market. I strongly disagree. How do you super glue Humpty Dumpty back together when he is broken into hundreds of pieces?
My brain is a little slow sometimes and needs time to ‘digest’ or process information, but usually with a little time my brain does a pretty fair job of painting a clear picture. I have a very graphic graphic mind, and seeing so many housing charts by Wolf Man, one overwhelming thought my mind can’t let go of is this – in his housing charts of many cities, the charts show that this current housing bubble MASSIVELY dwarfs the last one both in price and in duration. The graphs of the previous bubble look SMALL in comparison to the current bubble.
I have thus decided that this current monstrosity should be officially called The Great Housing Abomination.
I vividly remember many losing their homes last time, jingle mail, lost equity, prices going to bargain basement levels, lost dreams, and a massive financial bailout to top it off. Do we really believe, looking at the graphs comparing this bubble to the last, that there won’t be devastating consequences from this monster? My graphic brain says the consequences will be dire.
The Geeat Housing Abomination.
The underlying trigger of liar loans isn’t present.
However “Inside Job” is on youtube and thecon dot tv is the brutal version for a refresher.
Denver was never affected in the 2008-13 housing meltdown. Where I live some properties lost up to 80%. Nothing sold if it wasn’t a short sale or foreclosure from 2009-12. Location matters.
The reason investors expect the FOMC to cut rates is because Trump wants rates 300 bp lower and sometime between mid 2026 and potentially much sooner he will effectively control the Fed Bd of Governors and FOMC.
Has little or nothing to do with what the economic data show now or will show in the future.
I see BLS has put out a 22,000 increase in payrolls today, much lower than expected 75,000. But we learned that huge revisions are possible, even likely, so it is difficult to know what to make of this report. If it reflects reality, and that is a big if, and if other employment measures start to tank, we have stagflation. Watch long bond yields next week.
Federal and state governments shed 28,000 jobs in August. All other employers created 50,000 jobs.
https://wolfstreet.com/2025/09/05/my-thoughts-about-that-august-jobs-report/
Totally agree with you, Wolf. The average number of continuing jobless claims in the United States from 1967 to 2024 was 2,753,690. The record low was 988,000 in May 1969, and the all-time high was 23,130,000 in May 2020.~ the record low was during the peak of the war draft. Today’s 1940000 is great historically. The credit junkies are begging for more juice.
Most social media influencers (Wolf excluded) seem to be in a full blown panic about a relatively tiny blip in the employment statistics. Like, if you have to squint to see it, then it’s probably just a routine zig zag.
I have yet to see data that would convince me a recession is right around the corner.
> The SAHM rule looks good.
> The NFCI looks great.
> Initial and Continuing Claims look like some kind of paradise in historical context.
> The stock market certainly isn’t spooked by anything if it’s selling at these valuations.
> Durable orders are back to normal after a few months of tariff front-running.
> Advance retail sales are chugging upward.
> The 10y/2y yield curve has been un-inverted for a year, which is much longer than has ever been followed by a recession, and proves its long inversion was a false alarm.
> The 10y/3m yield curve has been dancing around zero since December, and is also running out of time to make a successful recession prediction. What does that mean? IDK but it’s not a clear prediction anymore.
> The LEI index has been all gloom since 2021, and may no longer be a reliable recession predictor. Seriously, it’s been 4 years of strong economic growth. That’s failure if anything is.
> Despite the jump-scare headlines, residential investment is actually flat, and near ATH’s.
Overall, I see zero recession indicators flashing a clear red signal on my dashboard. Conditions now look better than they looked in 2023 or 2024.
There is still a housing bubble. And there is still a collapse in CRE prices that has yet to be fully reflected on the balance sheets or lending behavior of financials. And arguably stocks are waaaay overpriced at these PE and CAPE levels. There’s always some reason to hide, but everyone still wants to buy big houses and expensive stocks, so as long as employment holds up the music will continue.
The AI revolution is delivering actual profits (unlike the dot com bubble darlings) and has a plausible path to quickly transform worker productivity even more than the PC did in the 1990s. Everyone in my industry is being encouraged to sign up for a couple of AI subscriptions or be left behind like the office urchins still using typewriters in 1996.
I suppose the coexistence of massive bubbles with a growing economy is producing some public anxiety that can sell clicks. The addition of unprecedented government policy choices is adding to the angst. But to me the recession calls look like a classic media-hype false alarm.
Inflation, however, is going to get out of hand next year. Short TLT and I’ll see you on the beach next summer.