An ugly situation. But capital gains taxes and tariffs helped. And the debt ceiling covered up part of the problem.
By Wolf Richter for WOLF STREET.
Tax receipts by the federal government jumped by $39 billion (+4.8%) in Q2 from Q1 and by $108 billion (+14.7%) year-over-year, to $845 billion. This includes the new tariffs that added $64 billion to tax receipts in Q2.
Tax receipts jump and drop with capital-gains taxes, while regular income taxes rise fairly steadily unless there’s a recession. Q1 and Q2 tax receipts benefited from 2024 having been good for stocks and other assets, with capital gains taxes due by April 15.
By contrast, 2022 was a bad year for stocks, and tax receipts in Q1 and Q2 2023 came in much lower, after the spike during the free-money-from-heaven pandemic.
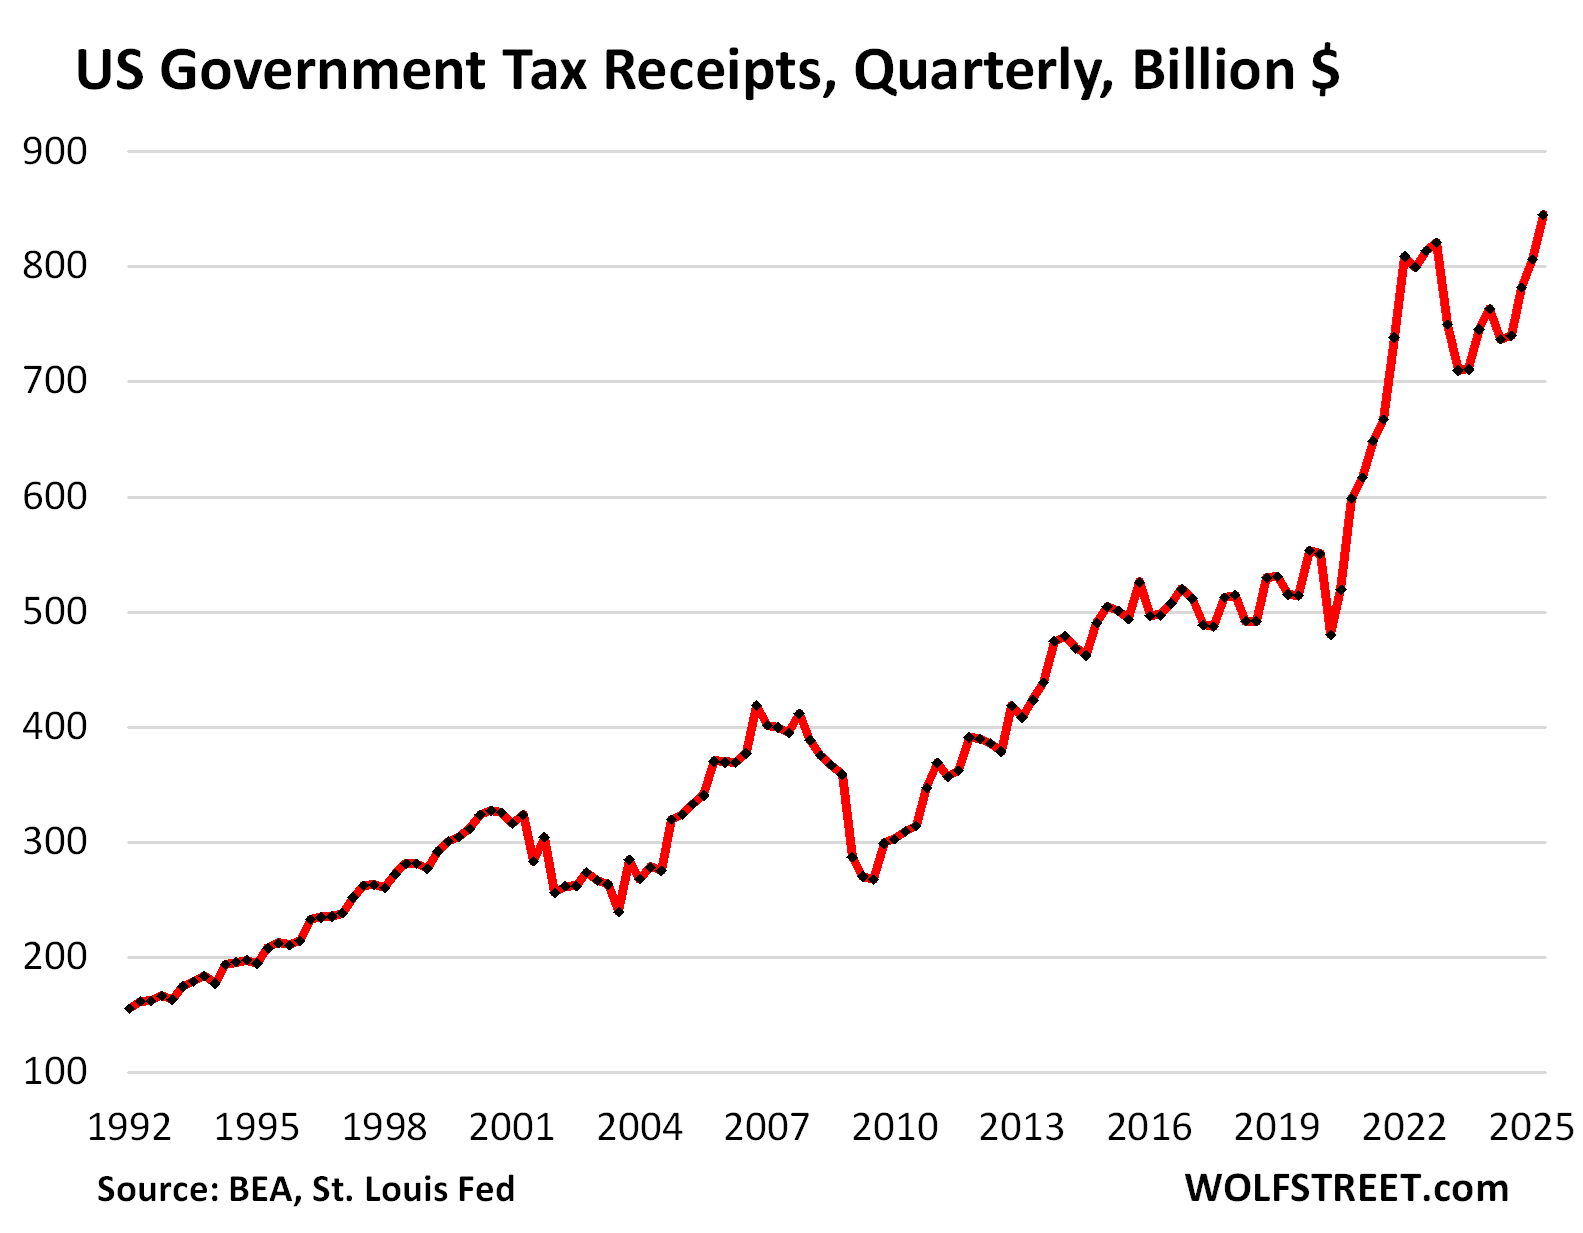
This measure of tax receipts was released today by the Bureau of Economic Analysis as part of its revision of Q2 GDP. It tracks the tax receipts that are available to pay for general budget expenditures, such as defense spending, interest payments, etc. Excluded are receipts that are not available to pay for general budget expenditures and are not included in the general budget, primarily Social Security and disability contributions that go into Trust Funds, out of which the benefits are then paid directly to the beneficiaries of the systems.
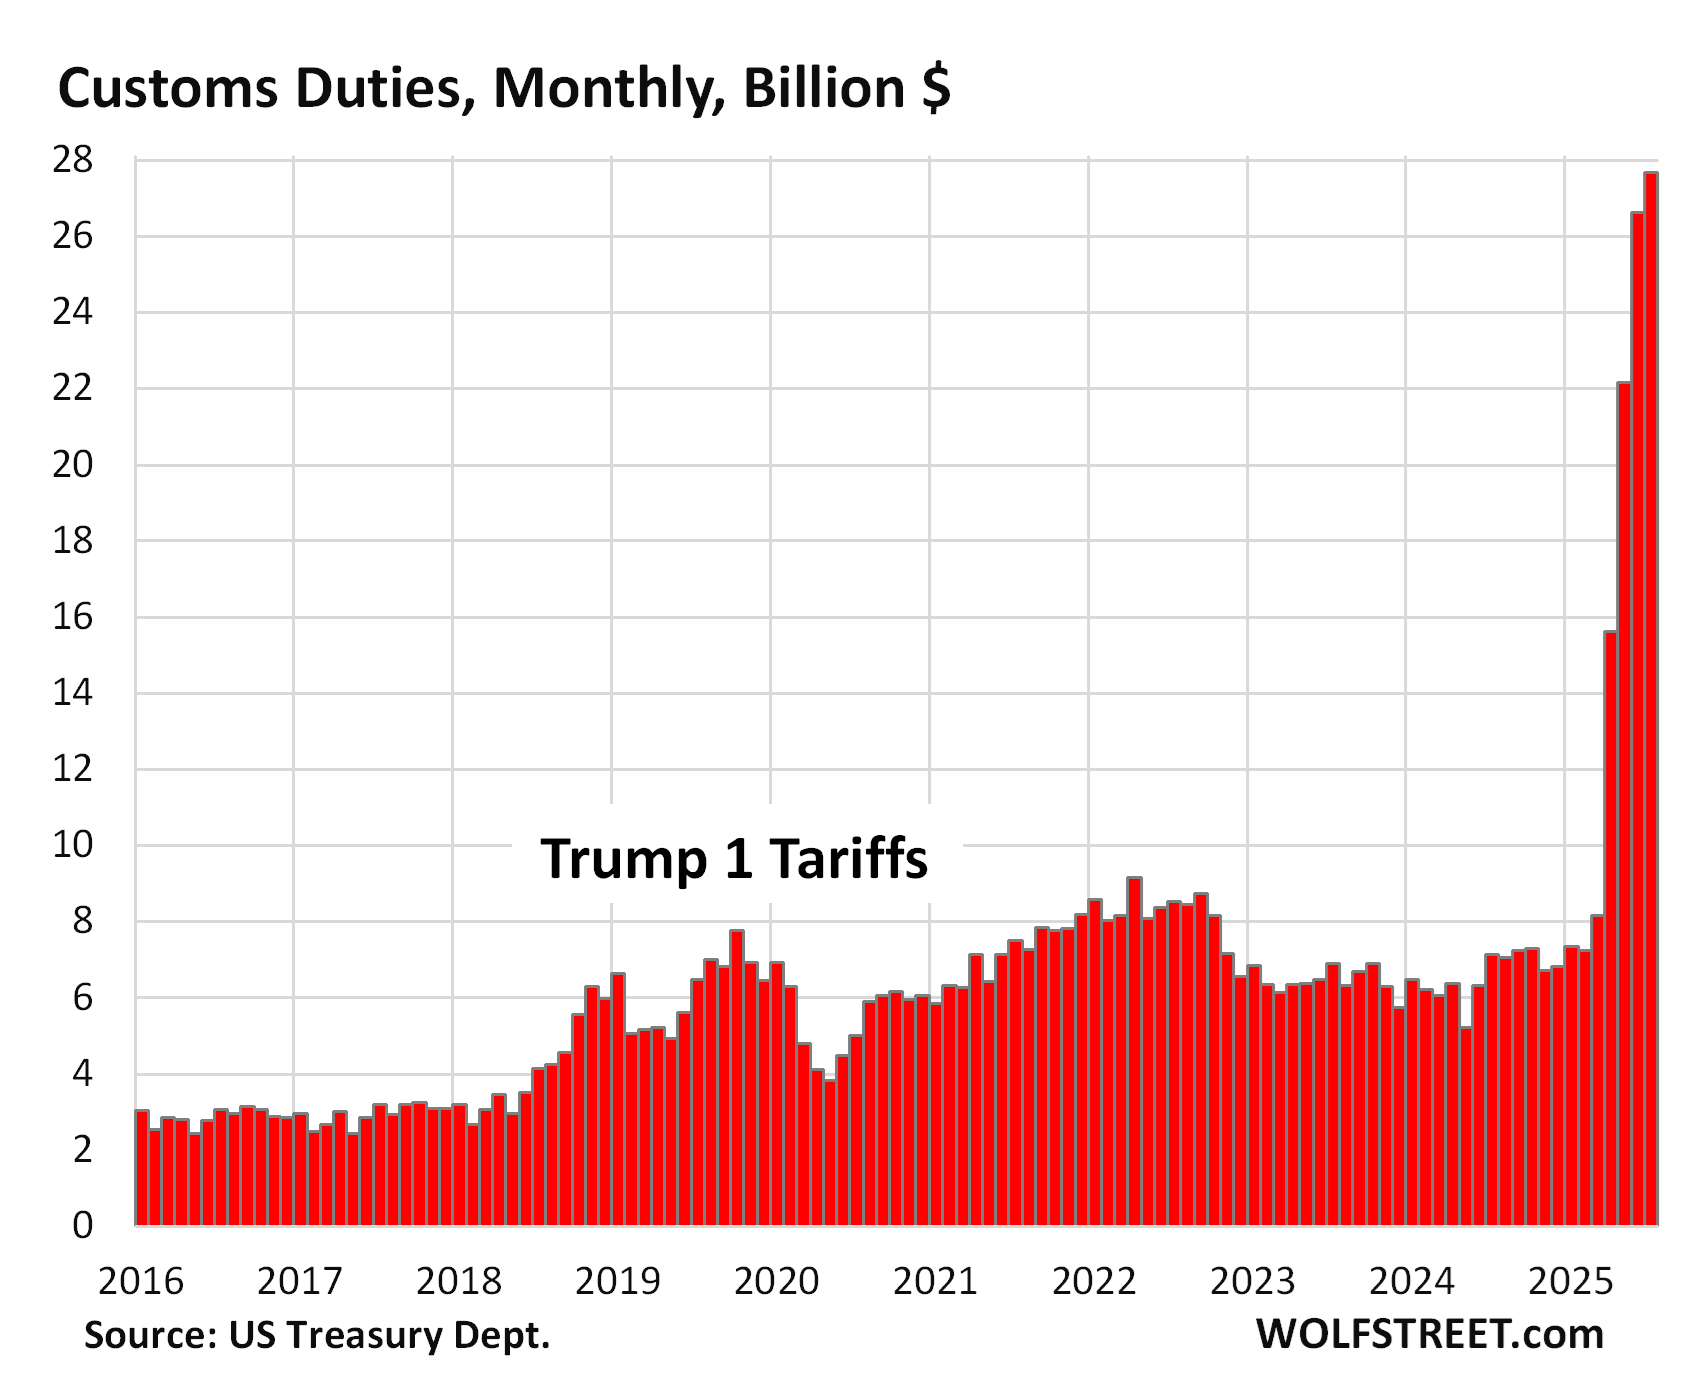
Tariffs have become a significant contributor. In Q2, they added $64 billion to the tax receipts ($845 billion) that were available to pay for the interest expense and other general-budget expenses (chart through July, data via Monthly Treasury Statement):
Interest payments by the federal government in Q2 on its monstrous debt rose by 1.6% from Q1, and by 3.2%, year-over-year to $283 billion.
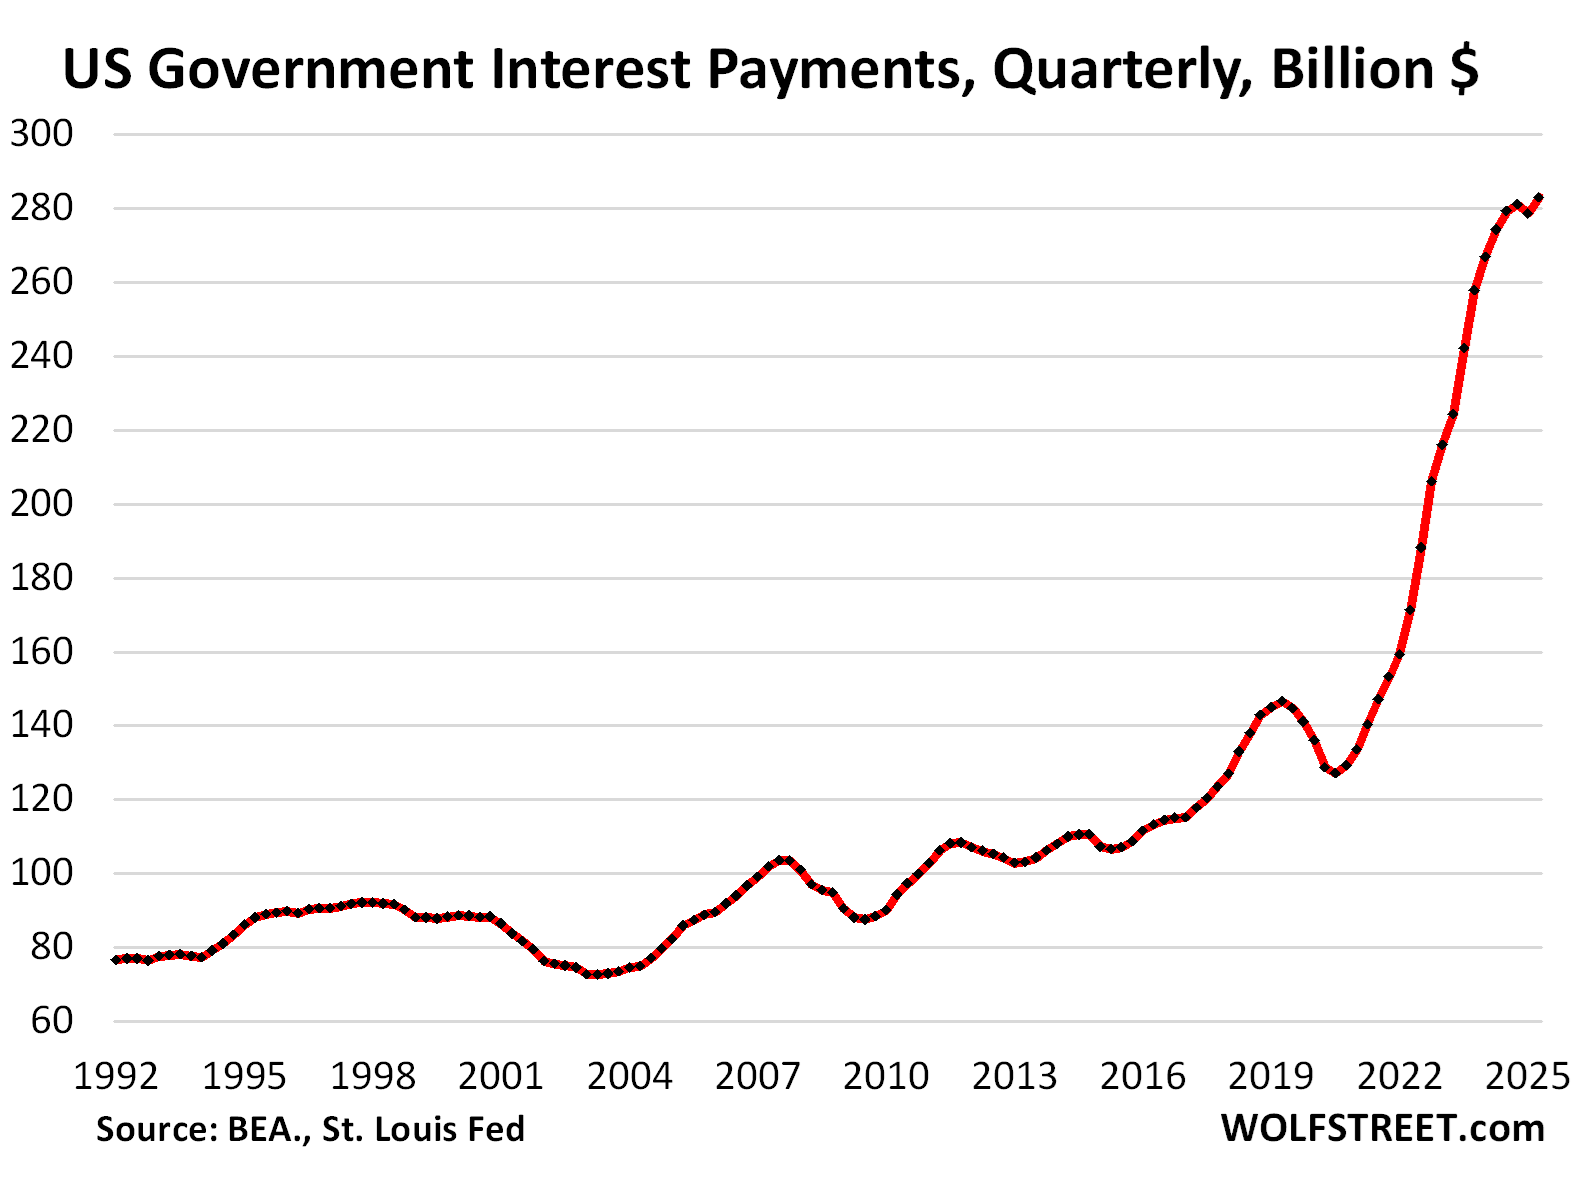
The quasi-lull in the surge of interest payments this year is largely due to a mix of three factors: The debt ceiling, lower yields on short-term Treasury bills, and higher yields on long-term Treasury notes and bonds.
1. The debt ceiling kept the US Treasury debt at $36.2 trillion through Q2. Since the debt ceiling was lifted in early July, the debt has already soared by over $1 trillion, and this additional debt will be sucking up additional interest payments. But through Q2, the debt ceiling helped stabilize interest payments.
2. Short-term interest rates started falling in July 2024. For example, 3-month T-bills were sold at auction at the beginning of July 2024 at an interest rate of 5.23%. At the end of 2024, after the Fed’s December rate cut, 3-month bills were sold at auction with an interest rate of 4.23%.
There are $6 trillion in T-bills outstanding. Since they’re short-term – maturities range from one month to one year – they mature constantly, and new T-bills are issued in multiple gigantic auctions every week to replace maturing T-bills and to raise new funding, and so the lower short-term interest rates entered the interest payments fairly quickly.
3. But long-term interest rates started rising in September 2024, and long-term securities that were sold at auction this year paid higher interest rates than last summer. This was the bond market’s counter-reaction to the Fed cutting interest rates by 100 basis points amid accelerating inflation.
The new interest rates on long-term notes and bonds enter the interest expense when old securities mature and are replaced with new securities at the new interest rate.
For instance, the 10-year Treasury notes, issued in May 2015 at a yield of 2.24%, matured in May this year and were replaced at the auction on April 30 with 10-year notes that sold at a yield of 4.34%.
In addition, the size of the 10-year note auction nearly doubled, from $24 billion in 2015 to $42 billion in May. So instead of paying 2.24% on $24 billion on the old notes, the government is now paying 4.34% on $42 billion of new notes, which then starts pushing up the interest expense.
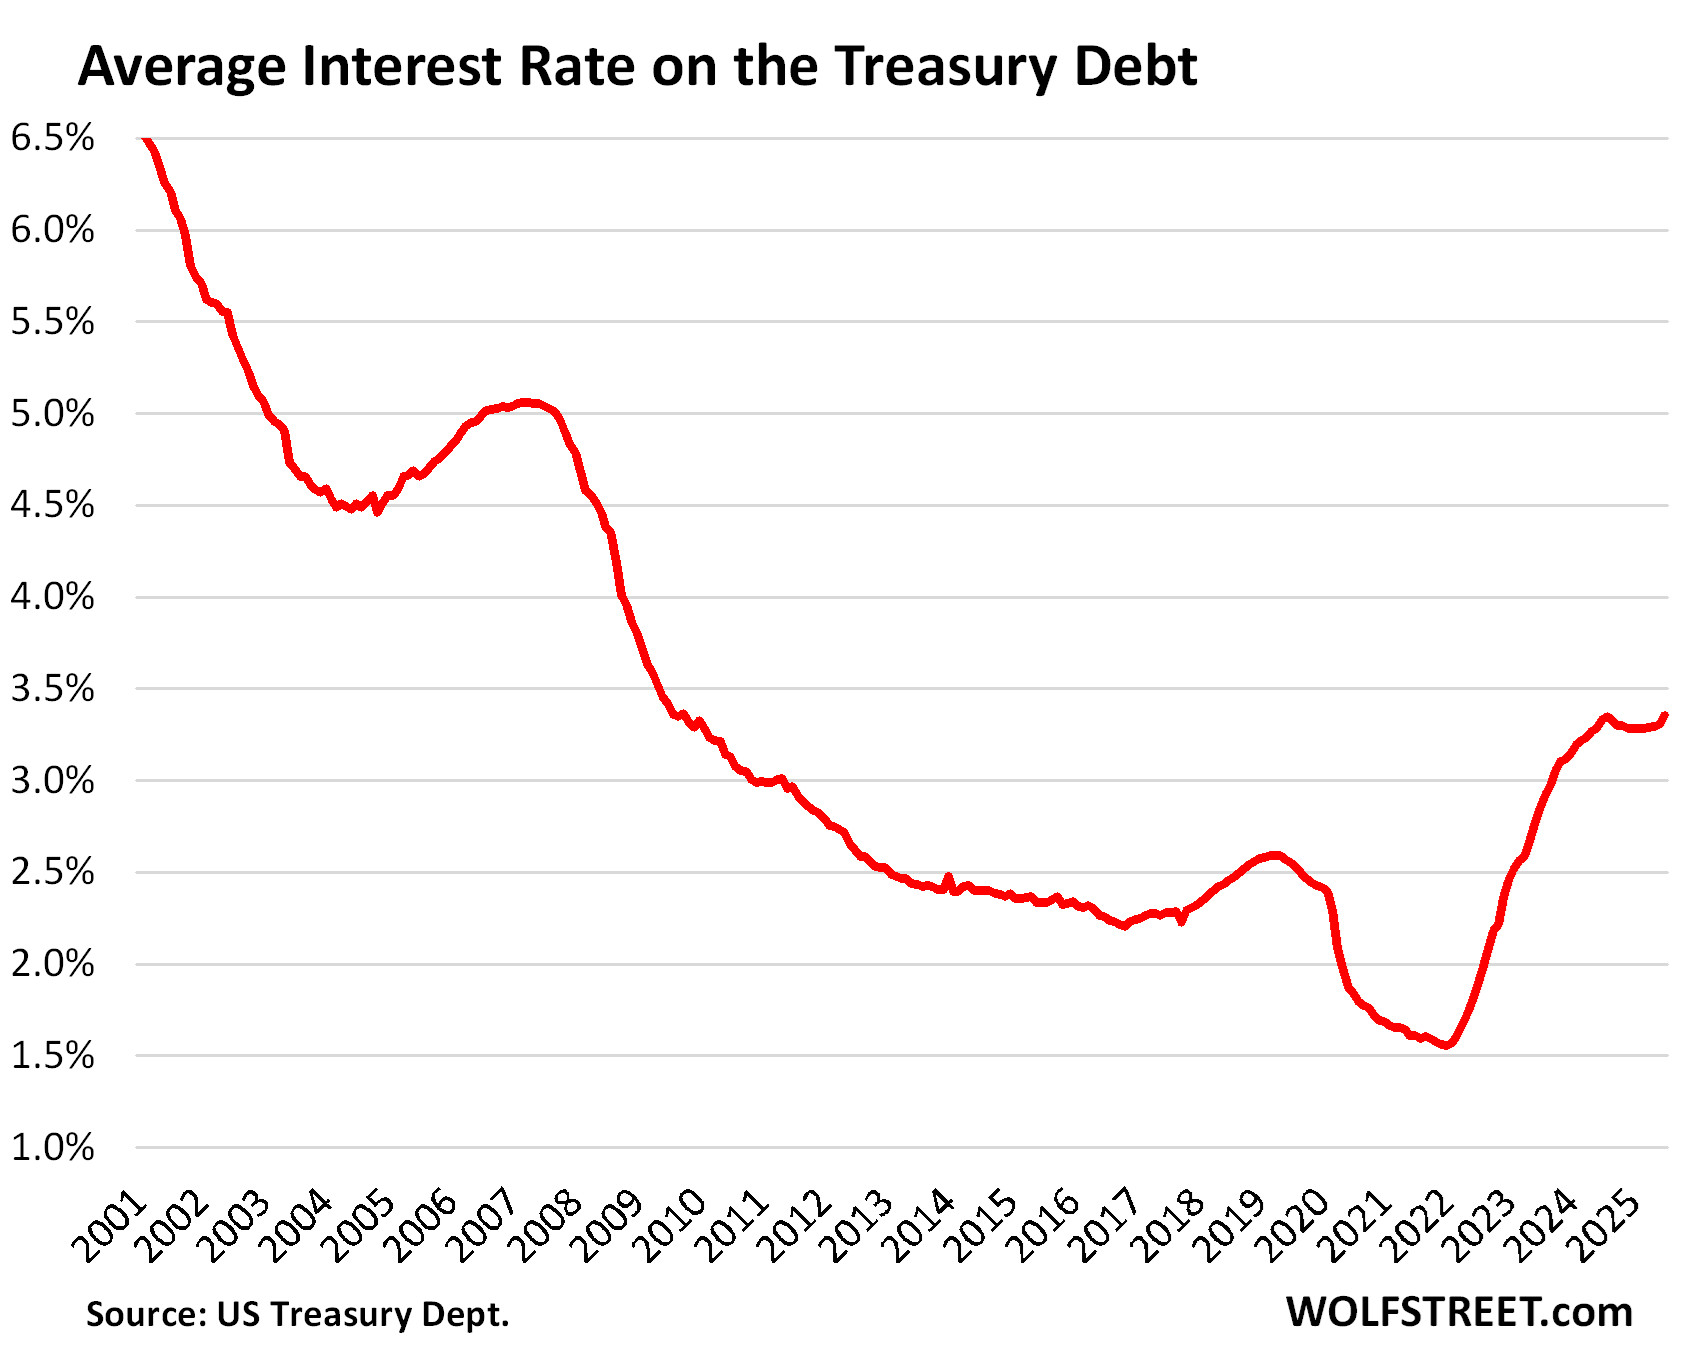
The average interest rate on the Treasury debt – with T-bill yields falling and long-term yields rising – was roughly stable in Q2: 3.29% in April, 3.29% in May, and 3.30% in June, according to Treasury Department data.
Not included in Q2, but included in the chart, is July, when the average interest rate rose to 3.35%, same as in August 2024 when T-bill yields were still near 5%, but long-term yields were lower than today, with the 10-year yield at around 3.8% (it’s 4.22% at the moment).
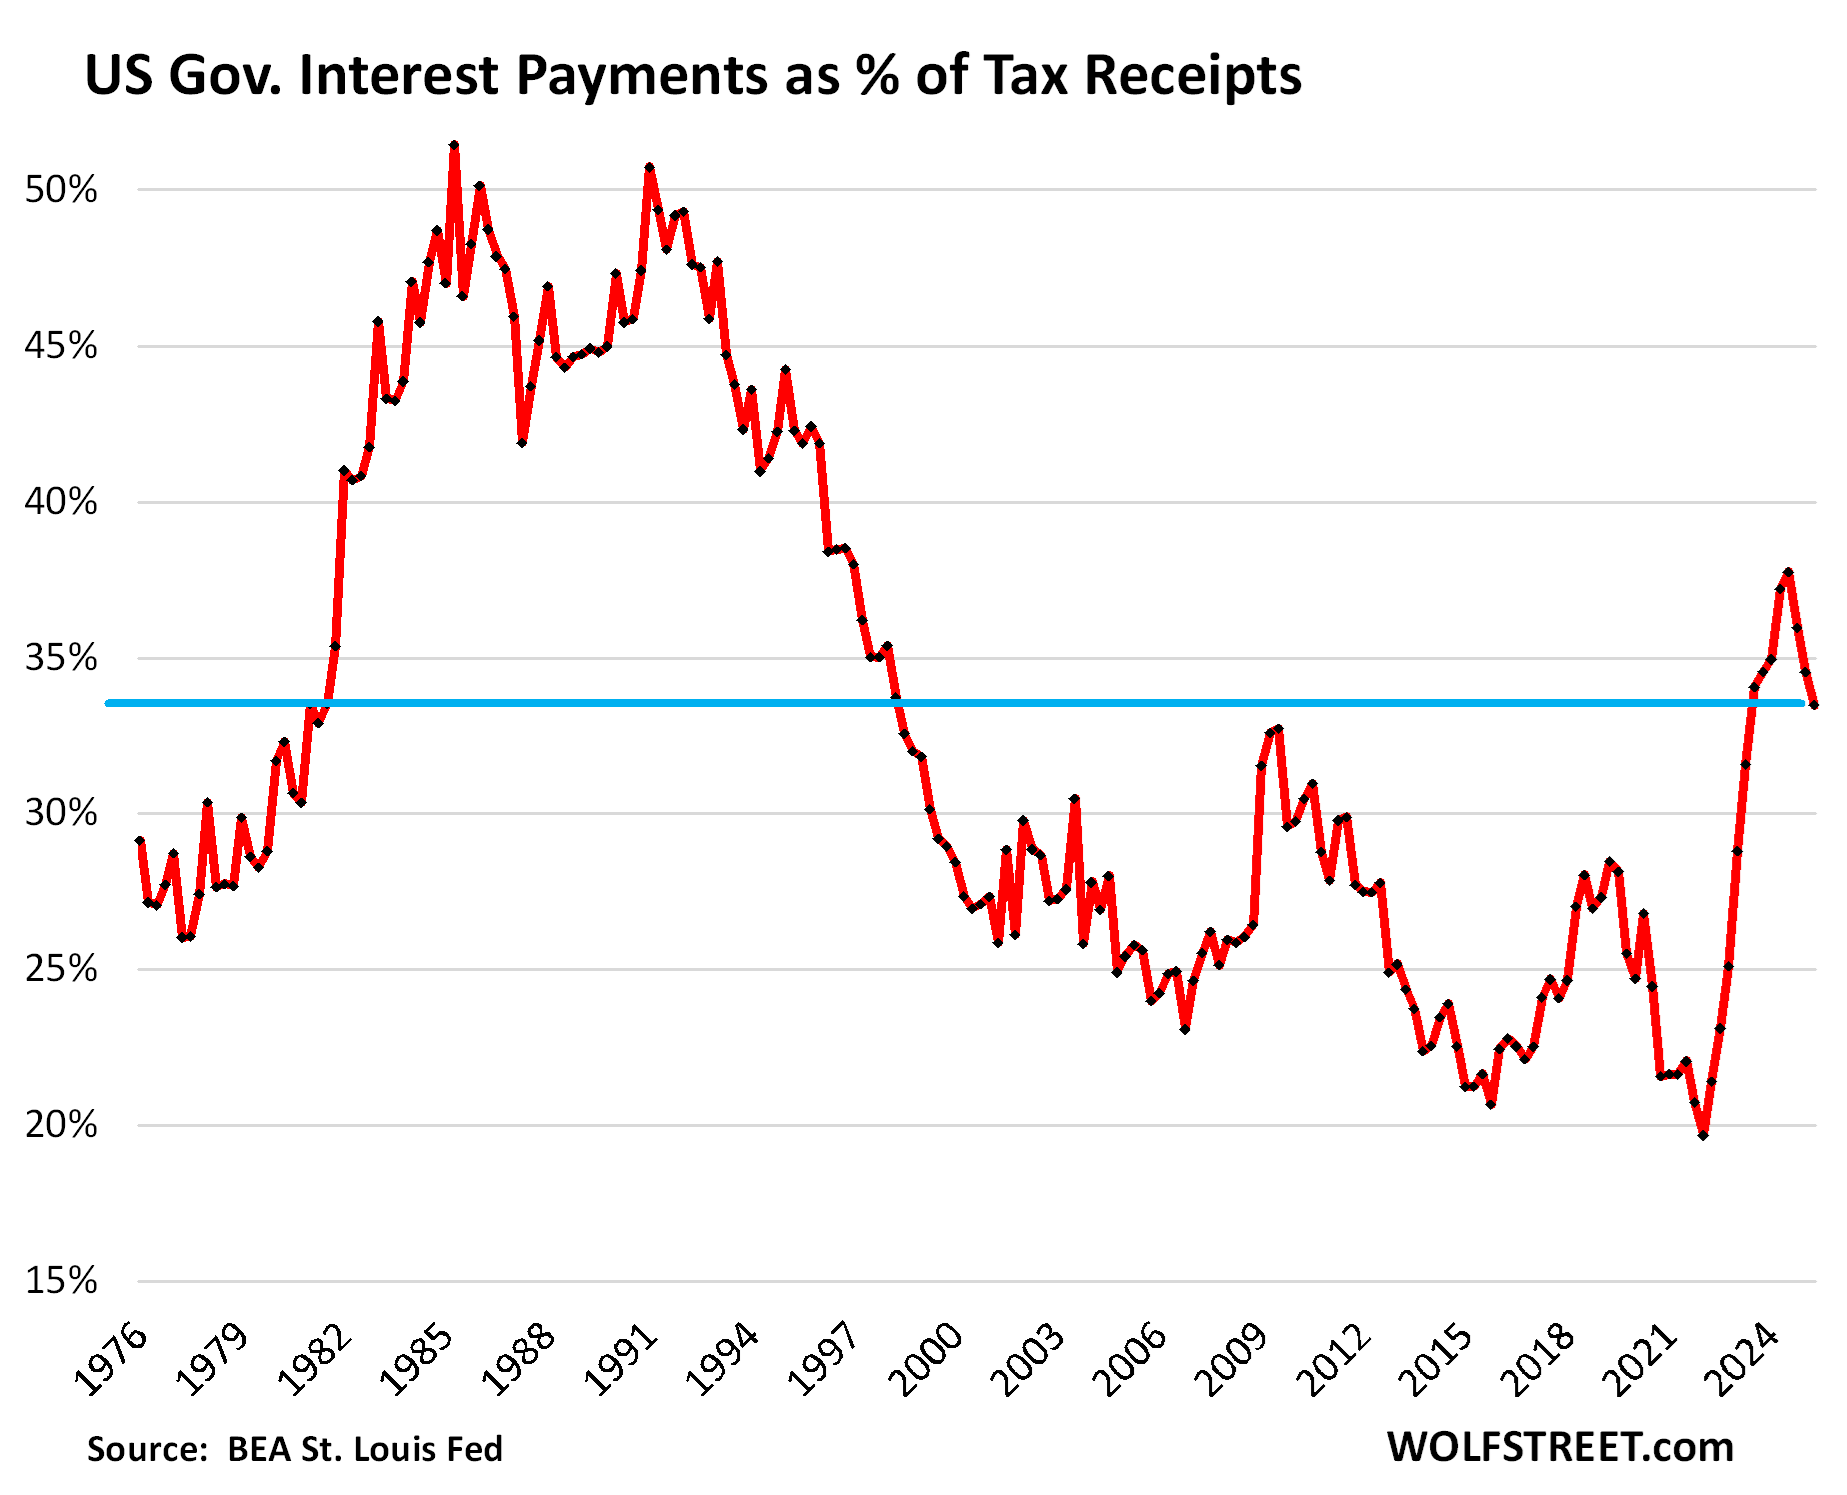
What portion of federal tax receipts gets eaten up by interest payments?
A key question. The answers have not been as ugly as during the last crisis in the early 1980s, when that ratio had exceeded 50%. At the time, investors in bonds were worried and reluctant to buy bonds, the 10-year Treasury yield was over 10% for six years in a row, mortgage rates were over 10% for 12 years in a row, and inflation was high.
Interest payments don’t exist in a vacuum. What pays for them are tax receipts that are available to pay for them: Tax receipts in blue and interest payments in red.
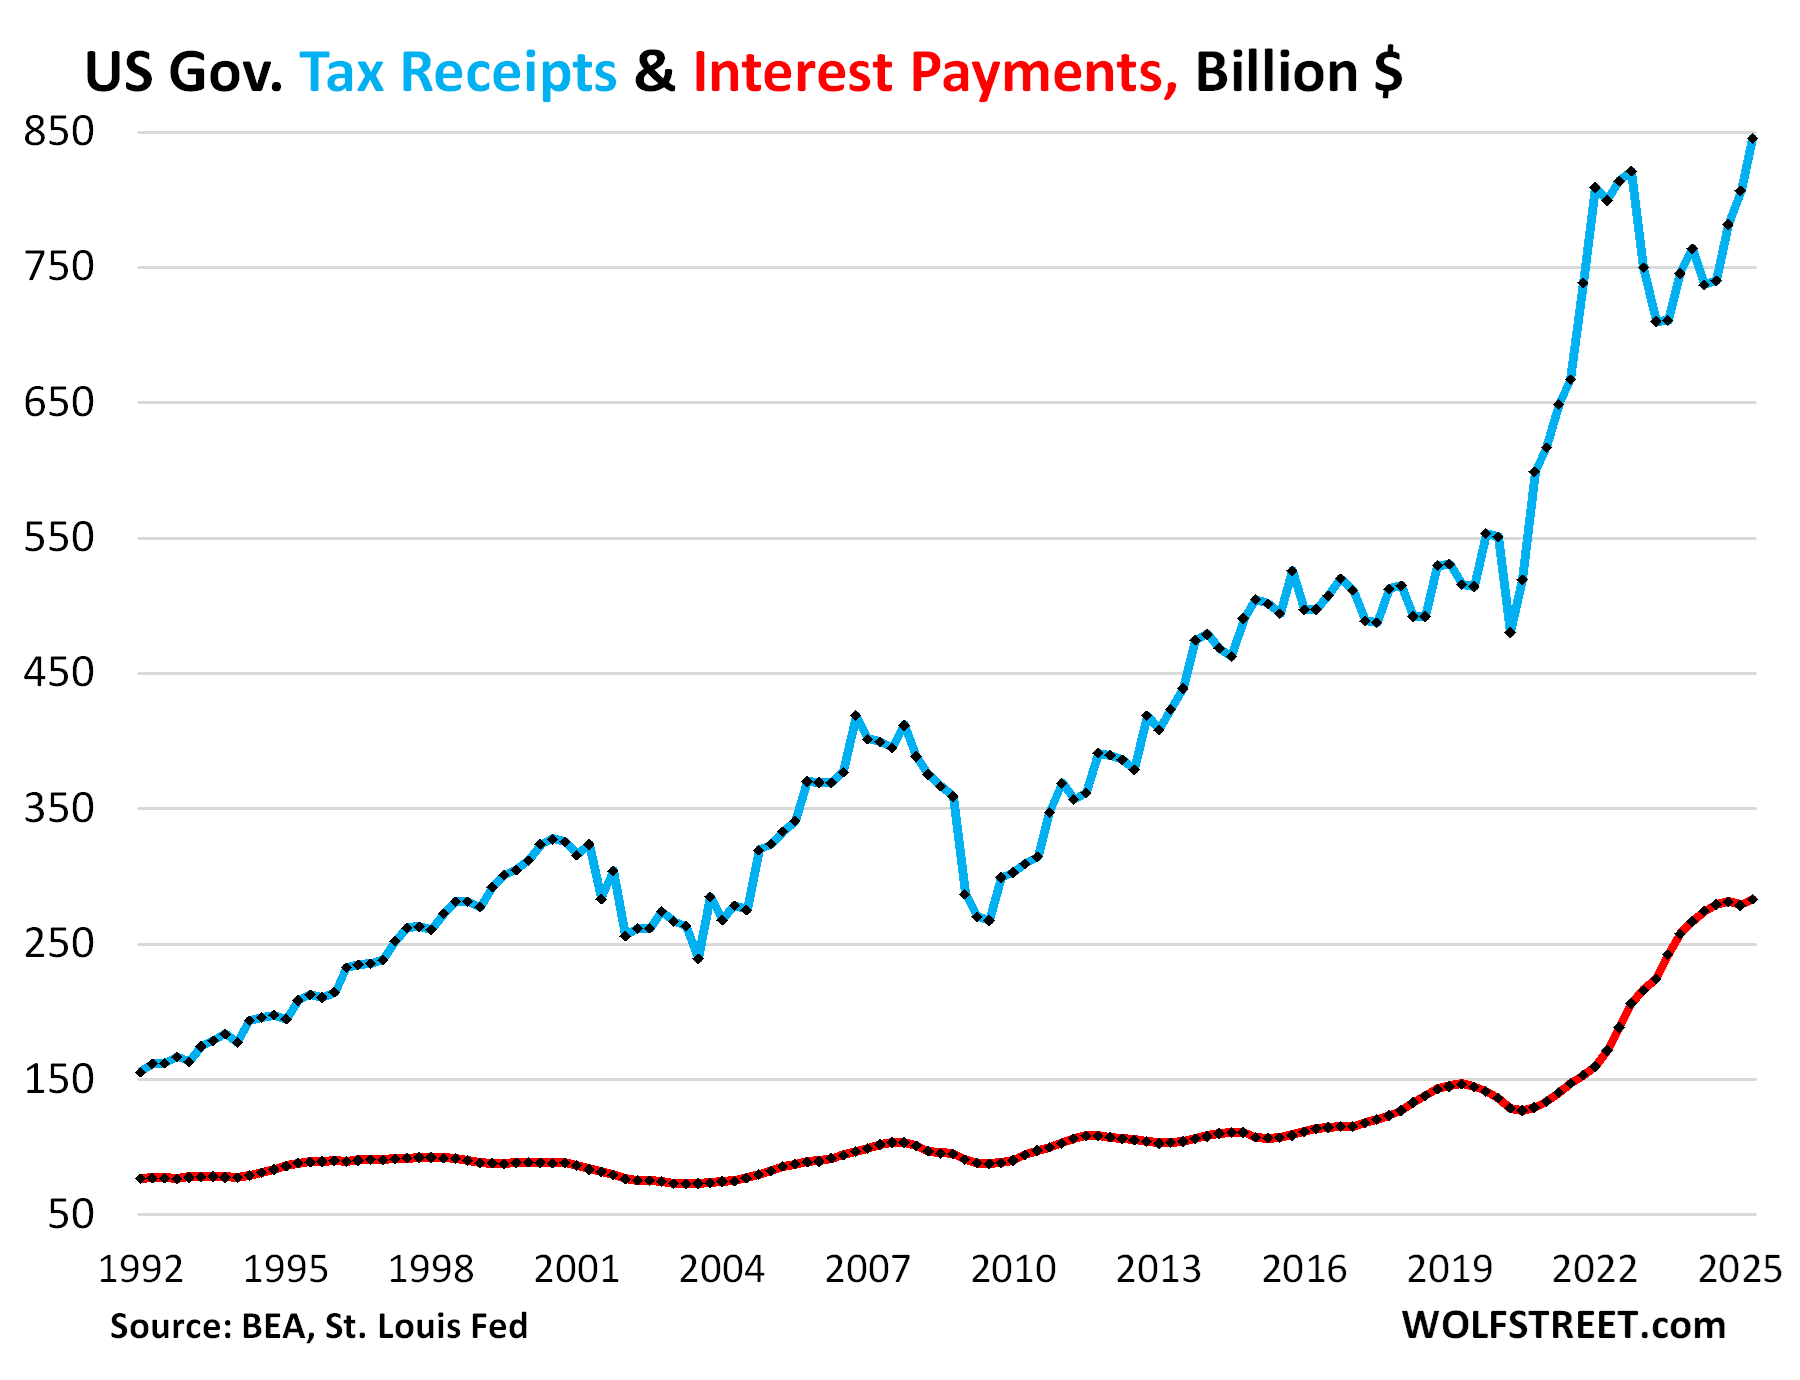
The ratio of Interest payments to tax receipts: Interest payments in Q2 ate up 33.5% of the tax receipts that were available to pay for them. The ratio declined for the third consecutive quarter, driven by higher tax receipts, including from capital gains taxes and tariffs.
The recent high occurred in Q3 2024, at 37.7%, the worst ratio since 1996, when it was on the downtrend from the scary times in the 1980s. The magnitude and speed of this spike over the prior two years was unprecedented in modern US history.
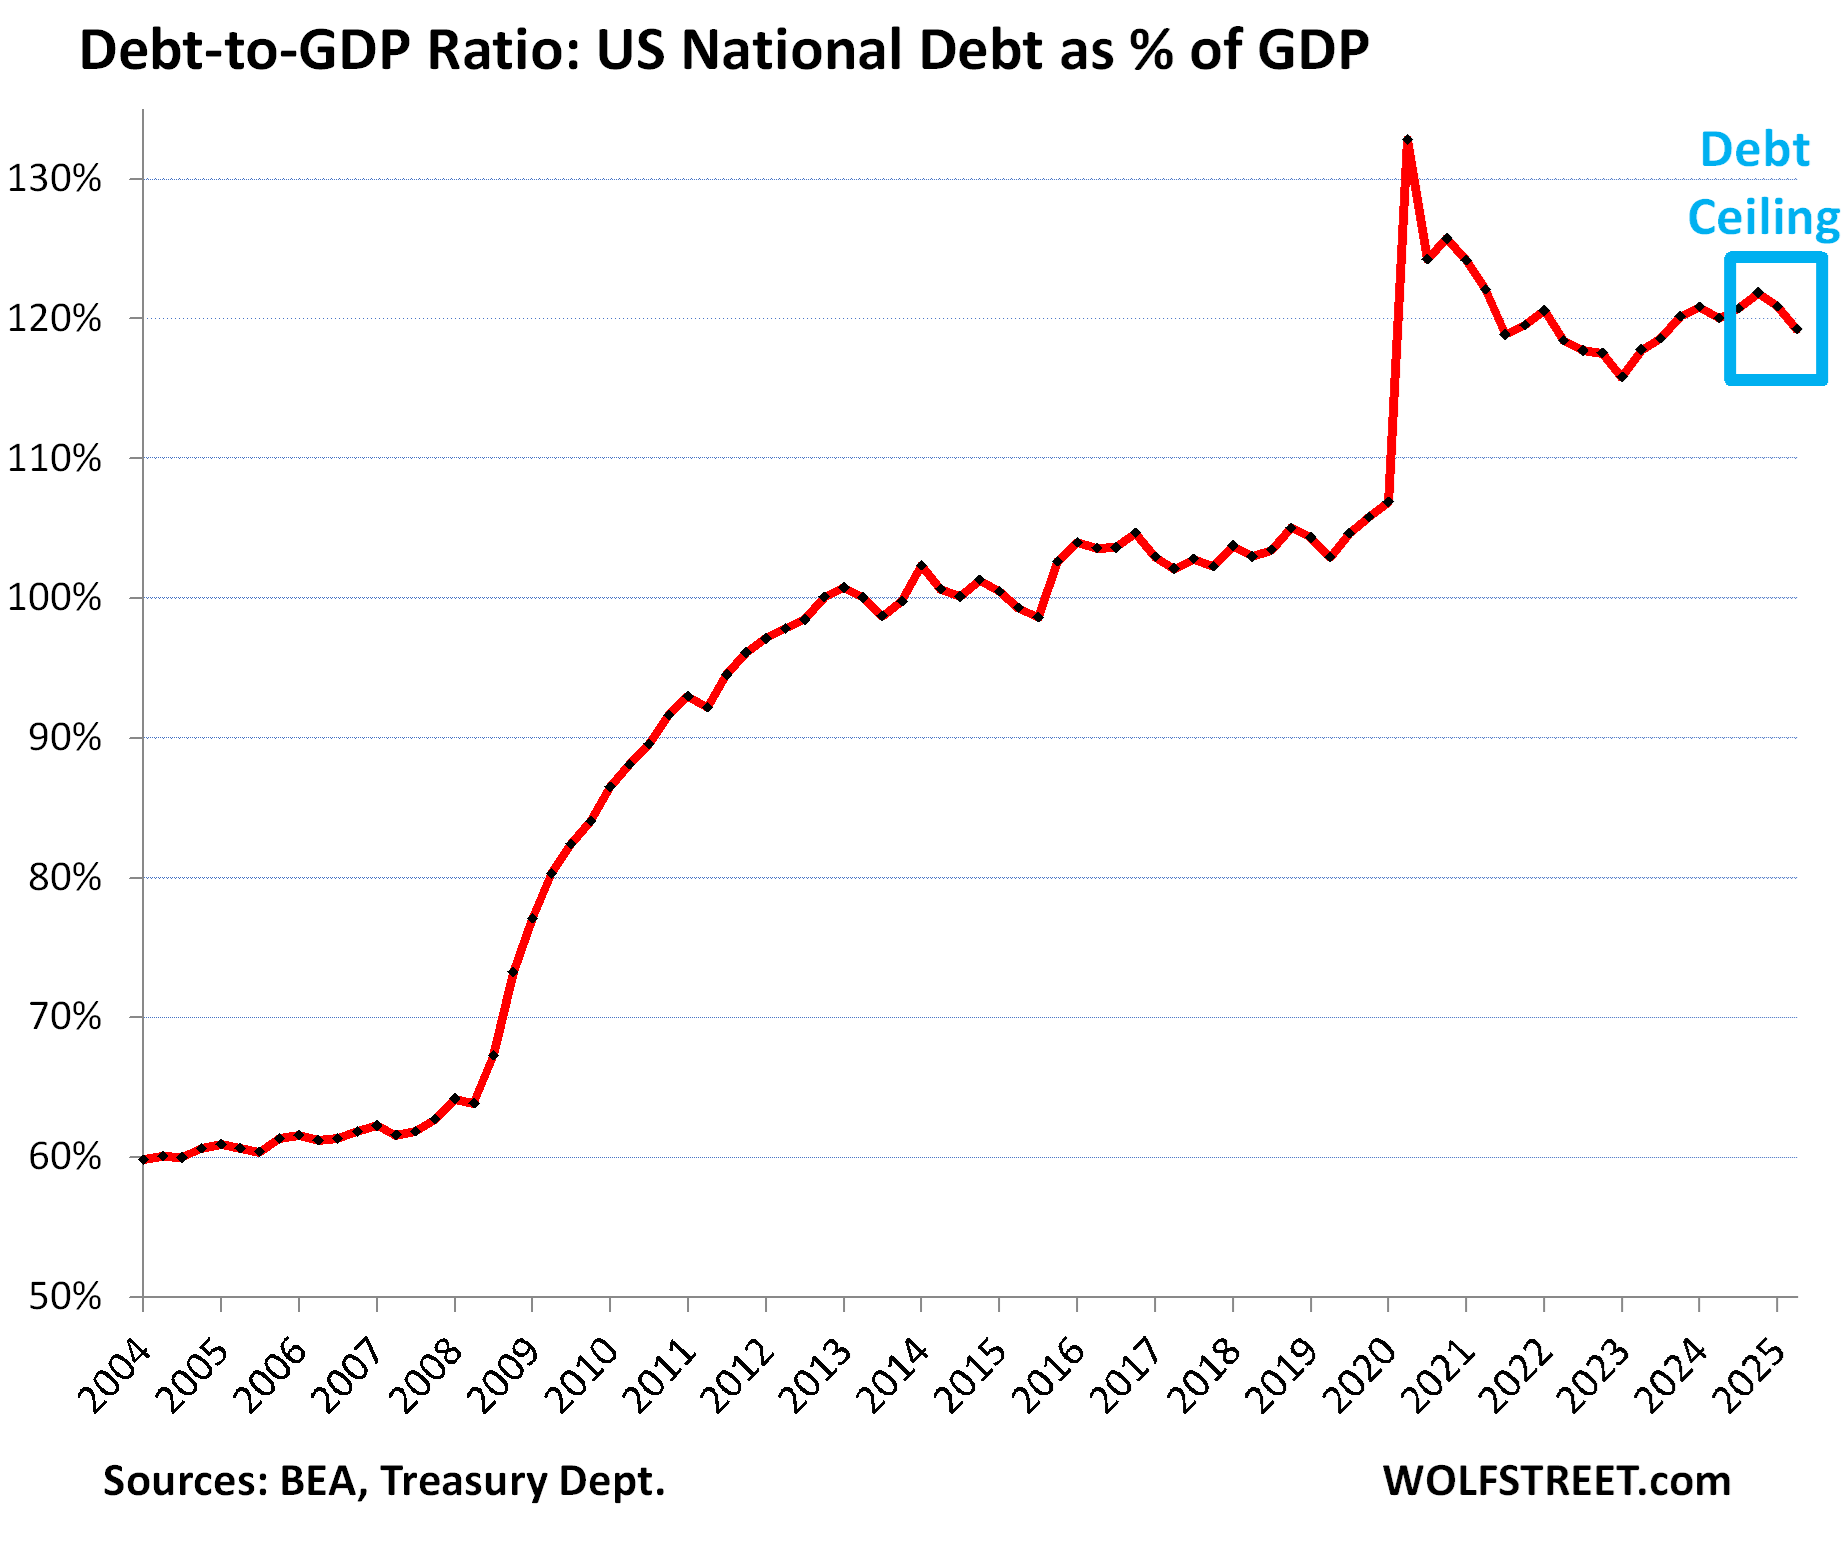
The Debt-to-GDP ratio eased in Q2 to 119.3%, based on the second estimate of Q2 “current dollar” GDP, released by the BEA today. It dipped for the second consecutive quarter because the debt ceiling temporarily blocked the debt from growing over the first six months this year and kept debt at $36.2 trillion through Q2.
The debt has since then ballooned to $37.3 trillion, and it continues to balloon, and that will be reflected in an upward hook in Q3.
The Debt-to-GDP ratio = total debt (not adjusted for inflation) divided by “current dollar” GDP (not adjusted for inflation). Inflation cancels out because the inflation factor affects both the numerator and the denominator equally.
The US, by controlling its own currency, cannot default on debt issued in its own currency because it can always “print” itself out of trouble (Fed buys some of the debt). But in an inflationary environment, printing money to service an out-of-control debt and deficit could cause inflation to spiral out of control, wreak havoc on the economy, and lead to years of wealth destruction and lower standards of living. Everyone knows this.
The far more palatable solution is to trim the annual deficit – including through tariffs – to where economic growth and modest inflation outrun the growth of the deficit, which would gradually over many years alleviate the problem. Whether or not this strategy can be pulled off smoothly remains in doubt.
Enjoy reading WOLF STREET and want to support it? You can donate. I appreciate it immensely. Click on the mug to find out how:
![]()


Deficit to GDP. I believe US is ~6.5%, EU SGP 3%, France about 4.6%?
I heard earlier today that for France it is around 5.8%, needs to be confirmed.
My personal observation; Americans want a European lifestyle but do not want to pay European taxes…
So, in your opinion Wolf, is Trump trying to fix things? Or does it look like the outcome is the same no matter who is “in charge”?
If one can fix something by breaking it, then sure.
Howdy Xypher I am not the Lone Wolf, and believe Trump will do what Reagan did. Deficit spending and talk talk talk. Its all politicians do.
The tariffs are big tax increase on companies that often pay little or no US income taxes. And as we can see in the tax receipts, it’s a significant help — but obviously it alone doesn’t solve the deficit problem, but it does help some.
In order to reduce the deficit, maybe we need to double or triple the tariffs. Apparently profit rich companies are paying the tariffs so maybe we can milk them a little (a lot?) more and make an impact.
At least we know there were billions saved by ending the USAID corruption.
Didn’t Trump cut revenues massively driving up the deficits? IIRC, the last Presidents to drive down the deficits were Bush 1, Clinton and Obama.
Don’t forget – the President doesn’t hold the purse strings of government, Congress does. The President can’t sign off on a budget that Congress doesn’t present to him. Times of fiscal prudence have almost always been times of split governments. As soon as one party has control of both administrative and legislative branches, the spending and tax cutting is nuts. The last time we ran a surplus was when Clinton held the presidency, and the Republicans held Congress – and Clinton had the line item veto (new as of 1996) where he could selectively strike off (but not add) items from the budget.
There is literally a chart in this article showing tax receipts growing under Trump 1, brother
Are we looking at the same charts? Chart #1 – Tax receipts by the federal government were stagnant from 2016-2020
Yeah, now let’s see spending under Trump.
LMFAO.
New world order, same old lies and a new crop of morons that believe them.
It’s hard to see on the chart because it goes back over 3 decades. But the spike in tax receipts started in Q3 2020, so the first two dots to the $600 billion line were under Trump 1. Then from $600 billion to over $800 billion was in 2021 and 2022. This was driven by a surge in capital gains taxes from tax years 2020 and 2021, paid by April 15 the following year. Then in Q1 and Q2, 2023, capital gains taxes plunged because 2022 was a bad year for asset prices. And then capital gains taxes took off again. The big jump in Q2 2025 was fueled in part by the tariffs.
It’s a numbers game and nobody can do anything about it without massive pain. Although the numbers are modest than the current condition of most world economies, the effect is the same.
“Annual income twenty pounds, annual expenditure nineteen [pounds] nineteen [shillings] and six [pence], result happiness. Annual income twenty pounds, annual expenditure twenty pounds ought and six, result misery.” ~ David Copperfield
Hemingway also wrote a memorable quote that everyone knows.
In ancient history, a ‘debt jubilee’ was the ‘solution’ to a chronic problem
that punished savers and lenders and rewarded spenders, with government the worst offenders.
Guardian: Trump tariffs: global parcel shipments to US lose exemption
Customs agency starts collecting full duties on Friday as Donald Trump ends de minimis exemption for packages worth under $800
The US tariff exemption for package shipments valued under $800 officially ended on Friday, raising costs and disrupting supply chain models for a range of businesses, with Trump administration officials saying the change would be permanent.
There is now a six-month transition period under which postal service shippers can opt to pay a flat duty of $80-$200 per package depending on the country of origin, the officials added.
The US Customs and Border Protection (CBP) agency began collecting normal duty rates on all global parcel imports, regardless of value, after 12.01am EDT (04.01 GMT) on Friday. The move broadens the Trump administration’s cancellation of the de minimis exemption for shipments from China and Hong Kong earlier this year.
“This is a permanent change,” said a senior administration official, adding that any push to restore the exemptions for trusted trading partner countries was “dead on arrival”.
The de minimis exemption has been in place since 1938 and was raised from $200 to $800 in 2015 as a means to foster small business growth on e-commerce marketplaces.
But direct shipments from China exploded after Donald Trump raised tariffs on Chinese goods during his first term, creating a new direct-to-consumer business model for e-commerce firms Shein and Temu.
Finally! This was one of the most abused loopholes ever.
Probably it should have been left at $200, an amount that suits small and micro business. Also, the cost to process shipments at that price surely makes it not economically viable as well as being inconvenient for recipients.
If for whatever reason rates spike, the stock market crashes, it could be a problem.
Is it safe to say that, overall, OBBBA was a tax increase, if we ignore the political fiction that extending the Trump 1 tax cuts was itself another tax cut?
Or are we in a lower tax environment now than before OBBBA?
Asking because of this line: “The ratio declined for the third consecutive quarter, driven by higher tax receipts, including from capital gains taxes and tariffs.”
I noticed grocery prices starting to go up again. I buy the same 15 items every week. The ones that are imported from Europe have been affected the most. They are up 15 to 20%., some more than that. I believe the tariffs are the cause. I can afford the increase so I just pay up.
At Costco:
— Prices of eggs collapsed from a year ago (paid $3.25 on Sunday).
— Avocado prices collapsed (paid $7.99 for bag of 6 large Haas from California, compared to $11.99 in May and $9.99 in November for 6 large Haas from Mexico).
— Olive oil prices have collapsed (paid $14.69 for 2 liters cold pressed virgin, down from $22 a few months ago).
— Paid $1.69 per pound of tomatoes on the vine, the cheapest I’ve seen in years at Costco.
But some other stuff has gone up. A lot of stuff hasn’t changed.
We don’t remember the stuff that goes down, or doesn’t change, but only remember the stuff that goes up because it pisses us off.
This selective perception is precisely why anecdotal price observations are no indication of inflation rates.
“This selective perception is precisely why anecdotal price observations are no indication of inflation rates.”
Perfect! And accurate, although my cup of coffee from my local barista is up $.80 in the last 2 months, having not changed in the prior two+ years.
Commodity coffee prices started surging in 2020 and have since then nearly quadrupled, to $3.90 per pound. Chart via TradingEconomics. So yes, coffee is one of the items whose prices have been surging for several years.
But that’s the price of green (unroasted) coffee beans in big burlap bags that roasters buy from coffee producers and turn into roasted coffee beans sold in smaller fancy mylar and plastic packages that your local barista can buy to turn into coffee (and if your “local barista” is a big company, like Starbucks, they do all of it, from buying green coffee beans directly from producers to selling you a cup of coffee).
But the price increase of the coffee beans in your cup of coffee is minuscule:
Depending on the strength of the coffee and the size of the cup, your barista might get 30 cups of coffee out of a pound. So the cost of the coffee, priced at the commodity level, would be about $0.13 per cup, up from about $0.04 per cup in 2020. So the actual coffee bean cost in your cup has increased by $0.09 per cup.
The rest of the price increase that you experience at your barista is due to profit margins, rent increases, labor cost increases, insurance cost increases, advertising cost increases, etc., by the companies doing the work needed to turn some green coffee beans into a cup off coffee and lure you into their shop to buy it there.
Duncan Donuts is charging $2.69 for a small cup of coffee.
Objective price tracking data shows grocery prices continue to rise. YOY price gains have accelerated from near 2% at the beginning of Trump’s term to near 3% currently, in spite of his promise to lower prices.
The CPI for food at home (by the BLS) rose by 2.2% year-over-year in July. I go into details in my CPI articles:
https://wolfstreet.com/2025/08/12/feds-nightmare-cpi-inflation-in-core-services-worst-in-6-months-pushing-core-cpi-to-worst-in-6-months-some-goods-prices-fell-others-rose/
But you cannot rely on observations of just a few items because some soar and some plunge, and many don’t change. These are some of the details my my CPI article:
The price of ground beef has spiked by 61% since January 2020. This is a years-long issue due to issues with the US cattle herd:
Coffee (ground, sold at stores) spiked by 2.3% for the month and by 14.5% year-over-year. Since mid-2021, when this price surge began, the CPI for coffee surged 41% following global commodity coffee prices:
But egg prices continued to plunge for the fourth month in a row, as they unwind their avian-flu-driven price spike.
For example, the average price of a dozen Grade A large eggs dropped another 3.9% in July from June, to $3.60, bringing the four-month plunge to 42%. But they’d spiked so much during the avian flu period through March that even after this four-month plunge, they’re still up 16.4% year-over-year and by 146% from January 2020:
All this stuff is in my CPI articles, and you should really read them. I know they’re long, but they have all this stuff:
https://wolfstreet.com/2025/08/12/feds-nightmare-cpi-inflation-in-core-services-worst-in-6-months-pushing-core-cpi-to-worst-in-6-months-some-goods-prices-fell-others-rose/
How could beef be that high?
I thought Bill and Beyond Meat
would have put an end to excessive cow farts and burps.
Sorry Wolf the coffee prices the pizza prices the general food prices are increasing….. It also shows in your own data….. Maybe its not all due to tarriffs but it will cause further upward pressure and aint going to help. The Service inflation will hit products as well. Also the full weight of the tarriff inflation hasnt got down to consumer level yet due to front running the tarrifs and companys being unsure of what they are. To your point there may be some products that eat the tarrifs initally but the suppliers I deal with arent them HVAC eta al…….. In additon the adminstrations use of tariffs (if every problem is a nail I have a hammer) seems to me to have the potential of driving our potential allies into our enemys arms. Over time this will be corosive. You dont seem worried at all,very odd. Well maybe your right time will tell
I never said there is no inflation, implying that is just stupid bullshit.
I said in my comment that you replied to:
“We don’t remember the stuff that goes down, or doesn’t change, but only remember the stuff that goes up because it pisses us off.
This selective perception is precisely why anecdotal price observations are no indication of inflation rates.”
We’re in a “”Kobayashi Maru” situation: it’s a no-win situation based on the fact that there is zero political will (from the voters, or from gov’t officials) to make the hard choices.
The reality is that spending needs to decrease, taxes on the lower and middle classes need to increase; And the chance of this happening in a meaningful way is precisely….zero.
“taxes on the lower and middle classes need to increase”
LMFAO! What are you going to “tax”? They have nothing. Obviously you are not a student of history. Go back to 1946 and take a look at the tax structure. THIS is the only other time when our debt:GDP was this bad. Wake up. Stop believing the left/right propaganda.
The Fed dropped their pants the last 20 years and showed us what this creation truly is if your awake, but soo many oblivious and mind controlled that if you told them how their interests collectively are MANipulated to keep serving their rackets, they would give you the blank state, not one government controlled institution at any level educated the public about the creature from Jekyll Island….
Per AI
Summary
To pay off $37 trillion of U.S. debt exclusively through new taxes:
• Over 10 years: each tax filer would pay ~$27,450/year
• Over 20 years: ~$15,960/year
• Over 30 years: ~$12,300/year
It is the Law of Unintended Consequences. Following the Reagan/Volcker reforms of the very early 1980s this nation had 40 years of a low inflation environment. The first 15 of those years people in and out of the government cleaned up some of the problems from the high inflation 70s (and a bit before). But for the next 25 everyone went on a spending spree.
Let’s face it, there would be little need for this article if the national debt hadn’t grown from $5.x trillion in 2000 to $39.X trillion now. If the politicians had escalated the debt to simply HALF of that then this nation would be in outstanding shape.
Same for households. We have a ruinous Trade Deficit that is caused by people buying too much stuff that they mostly don’t need. Look around your own house (or mine) to see what I mean. Meanwhile the very houses themselves have jumped in size… as American family sizes have shrunk.
The good news is that times they are a changing. Tariffs will (eventually) elevate the prices of stuff bought overseas so that buying now and paying later is not just a spur of the moment impulse. And they elevate the tax receipts in the meantime.
Eventually there will have to be the Middle Class tax increases that you mention (if only to save Social Security). But that will probably come last… first we need the politicians and public to get used to the new reality… financing isn’t (virtually) free anymore. How long that takes is anybody’s guess.
“taxes on the lower and middle classes need to increase”
LOL, the people that already don’t make enough money need to pay more taxes??? That’s billionaire propaganda.
It’s easy to see why the German middle class gravitated to the national socialist party after they were wiped out by hyper inflation and all their hard work went to zero…they were a fringe party in 29, by and after the great depression of 29,30 orchestrated by the money interests they had 45 percent popular vote and off they went…wake up tomorrow like many Germans did and their Reich stag was burnt to the ground and blamed on the opposing parties…of course that couldn’t happen here ..and Santa claws is real…
Resume QT.
Cut Rates.
Wolf –
Great stuff as always thanks. Sobering. 2x the debt offering at 2x the coupon. Oof.
It seems likely the Fed will print money and buy our debt. Buyer of last resort.
Isn’t this what Japan did and they had a couple decades of deflation correct? I know their currency is now paying the price.
Could we have monetization and deflation like they did? Perhaps followed by currency collapse. I know the yen isn’t the reserve currency and Japanese save like crazy unlike our drunken sailers
Trying to read the (confusing) tea leaves. I guess real estate and real assets (apartments buildings, etc) are a good hedge. Hmmm
Luck favors the prepared.