An ugly situation. But capital gains taxes and tariffs helped. And the debt ceiling covered up part of the problem.
By Wolf Richter for WOLF STREET.
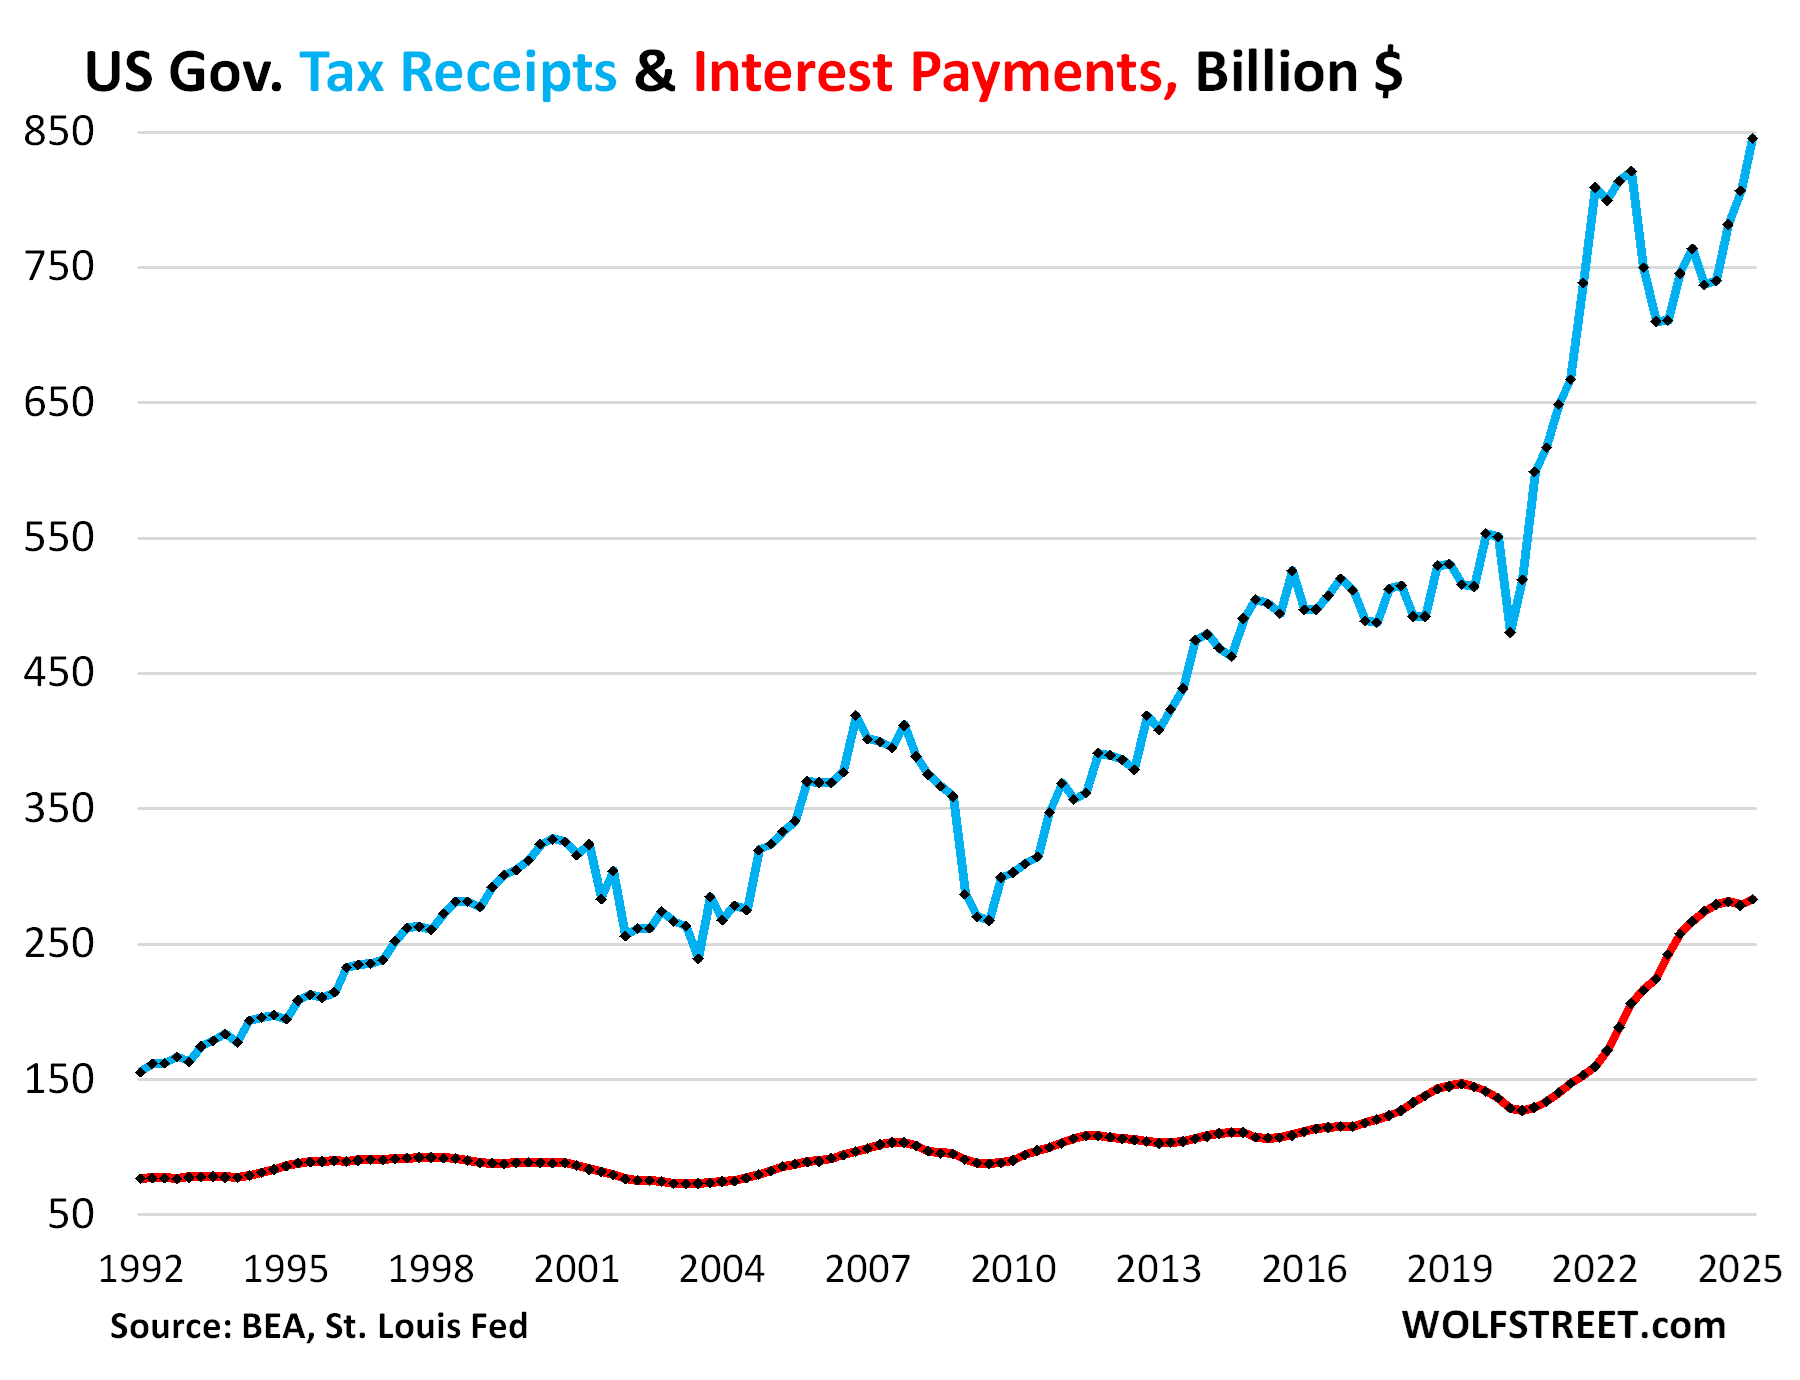
Tax receipts by the federal government jumped by $39 billion (+4.8%) in Q2 from Q1 and by $108 billion (+14.7%) year-over-year, to $845 billion. This includes the new tariffs that added $64 billion to tax receipts in Q2.
Tax receipts jump and drop with capital-gains taxes, while regular income taxes rise fairly steadily unless there’s a recession. Q1 and Q2 tax receipts benefited from 2024 having been good for stocks and other assets, with capital gains taxes due by April 15.
By contrast, 2022 was a bad year for stocks, and tax receipts in Q1 and Q2 2023 came in much lower, after the spike during the free-money-from-heaven pandemic.
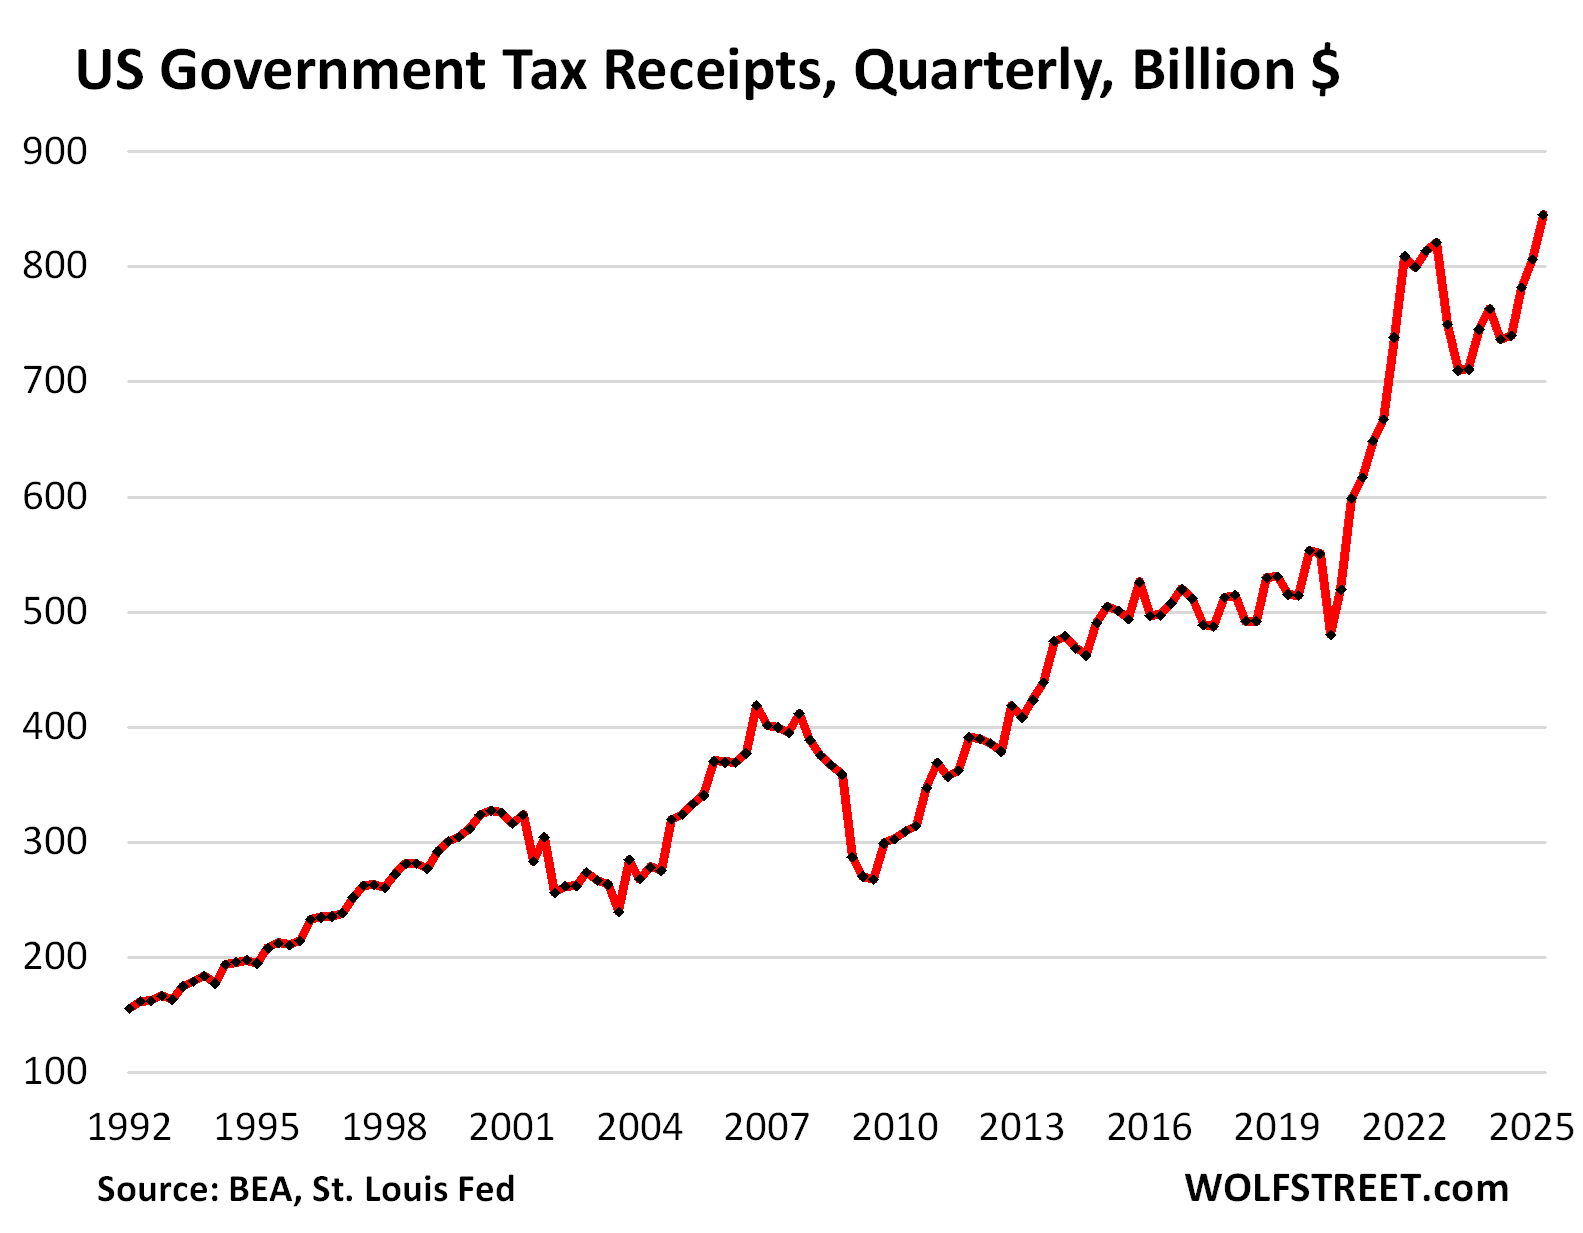
This measure of tax receipts was released today by the Bureau of Economic Analysis as part of its revision of Q2 GDP. It tracks the tax receipts that are available to pay for general budget expenditures, such as defense spending, interest payments, etc. Excluded are receipts that are not available to pay for general budget expenditures and are not included in the general budget, primarily Social Security and disability contributions that go into Trust Funds, out of which the benefits are then paid directly to the beneficiaries of the systems.
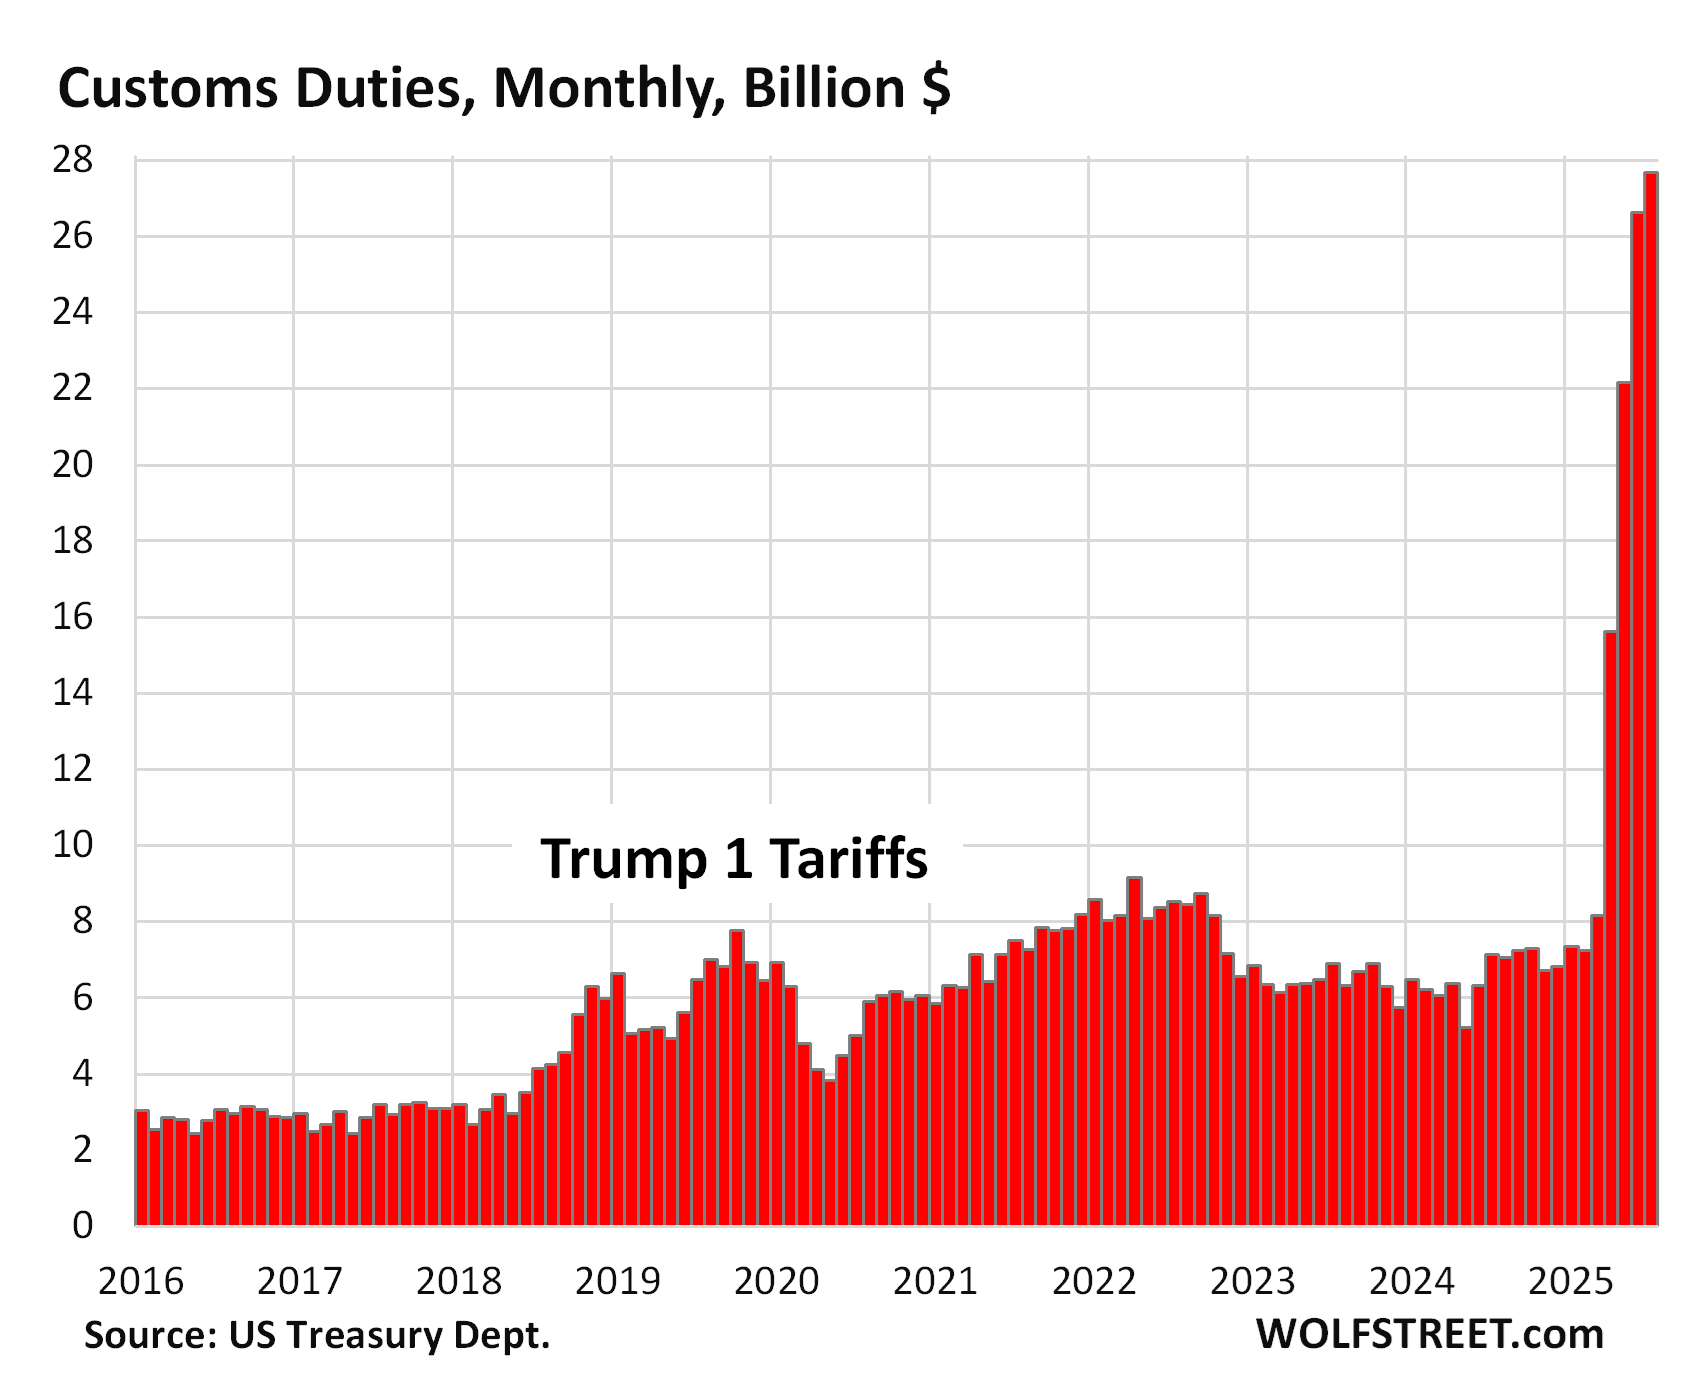
Tariffs have become a significant contributor. In Q2, they added $64 billion to the tax receipts ($845 billion) that were available to pay for the interest expense and other general-budget expenses (chart through July, data via Monthly Treasury Statement):
Interest payments by the federal government in Q2 on its monstrous debt rose by 1.6% from Q1, and by 3.2%, year-over-year to $283 billion.
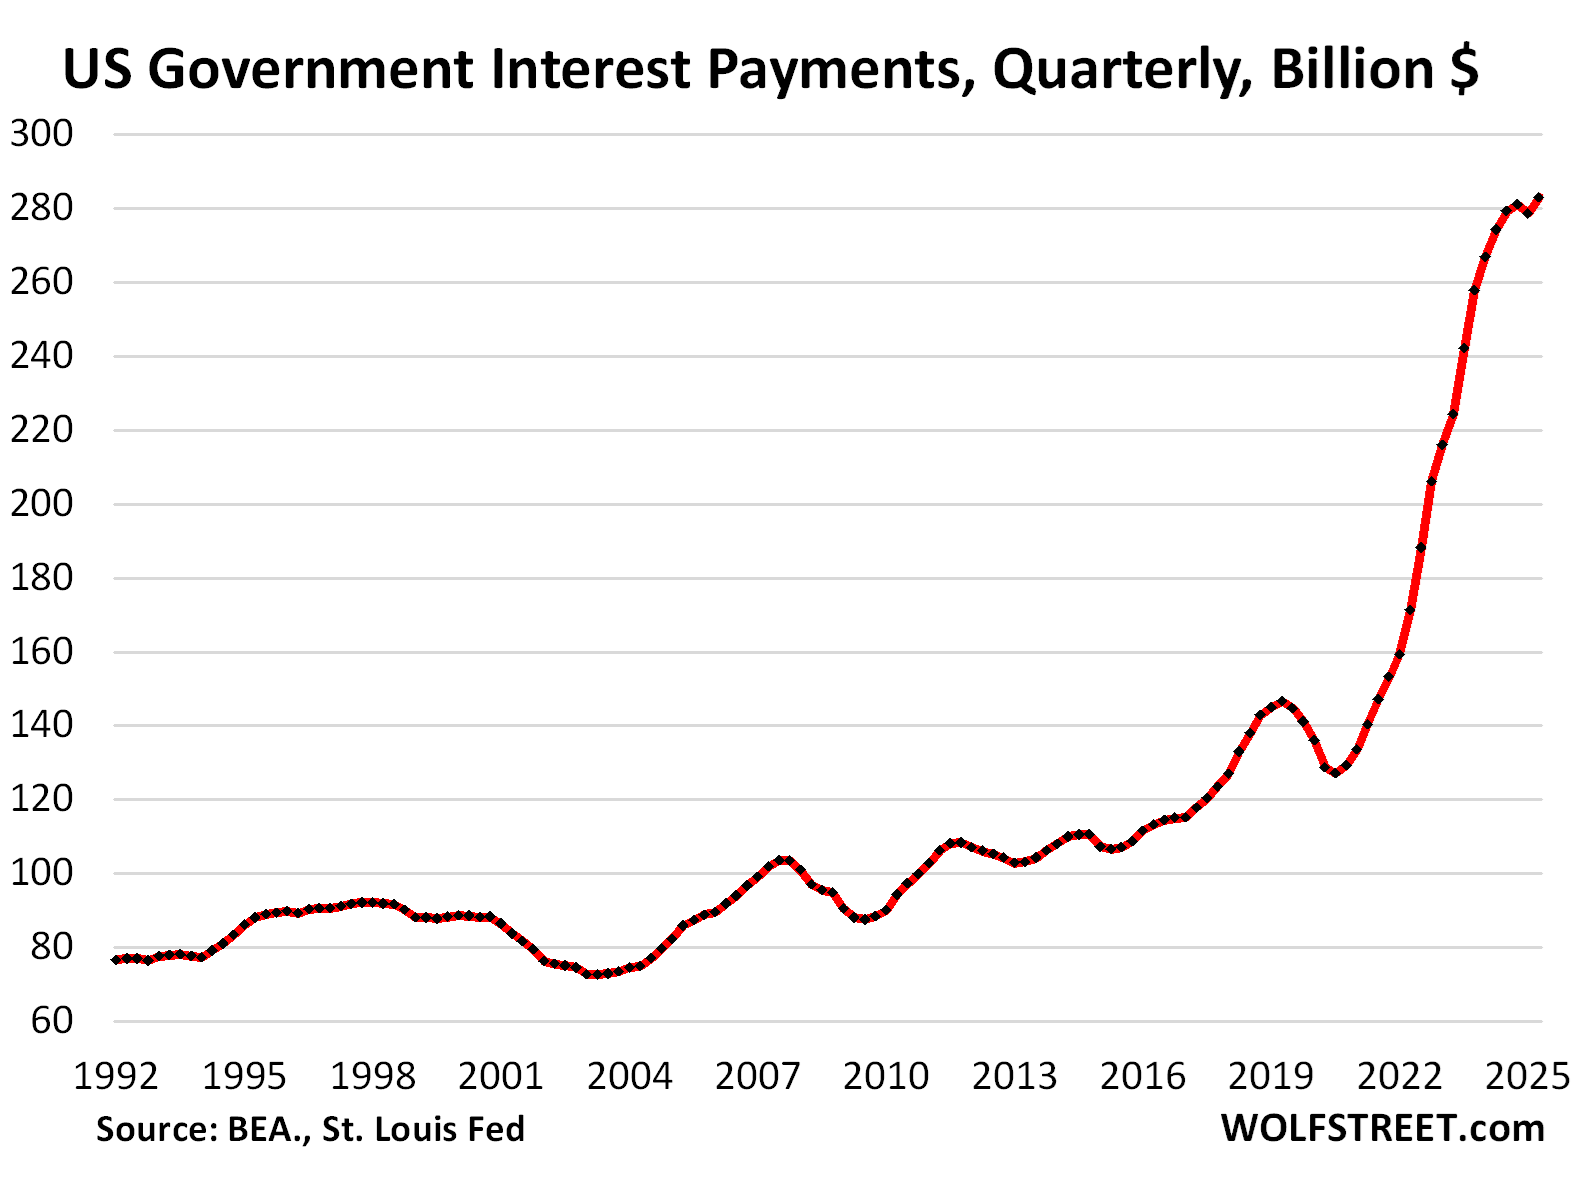
The quasi-lull in the surge of interest payments this year is largely due to a mix of three factors: The debt ceiling, lower yields on short-term Treasury bills, and higher yields on long-term Treasury notes and bonds.
1. The debt ceiling kept the US Treasury debt at $36.2 trillion through Q2. Since the debt ceiling was lifted in early July, the debt has already soared by over $1 trillion, and this additional debt will be sucking up additional interest payments. But through Q2, the debt ceiling helped stabilize interest payments.
2. Short-term interest rates started falling in July 2024. For example, 3-month T-bills were sold at auction at the beginning of July 2024 at an interest rate of 5.23%. At the end of 2024, after the Fed’s December rate cut, 3-month bills were sold at auction with an interest rate of 4.23%.
There are $6 trillion in T-bills outstanding. Since they’re short-term – maturities range from one month to one year – they mature constantly, and new T-bills are issued in multiple gigantic auctions every week to replace maturing T-bills and to raise new funding, and so the lower short-term interest rates entered the interest payments fairly quickly.
3. But long-term interest rates started rising in September 2024, and long-term securities that were sold at auction this year paid higher interest rates than last summer. This was the bond market’s counter-reaction to the Fed cutting interest rates by 100 basis points amid accelerating inflation.
The new interest rates on long-term notes and bonds enter the interest expense when old securities mature and are replaced with new securities at the new interest rate.
For instance, the 10-year Treasury notes, issued in May 2015 at a yield of 2.24%, matured in May this year and were replaced at the auction on April 30 with 10-year notes that sold at a yield of 4.34%.
In addition, the size of the 10-year note auction nearly doubled, from $24 billion in 2015 to $42 billion in May. So instead of paying 2.24% on $24 billion on the old notes, the government is now paying 4.34% on $42 billion of new notes, which then starts pushing up the interest expense.
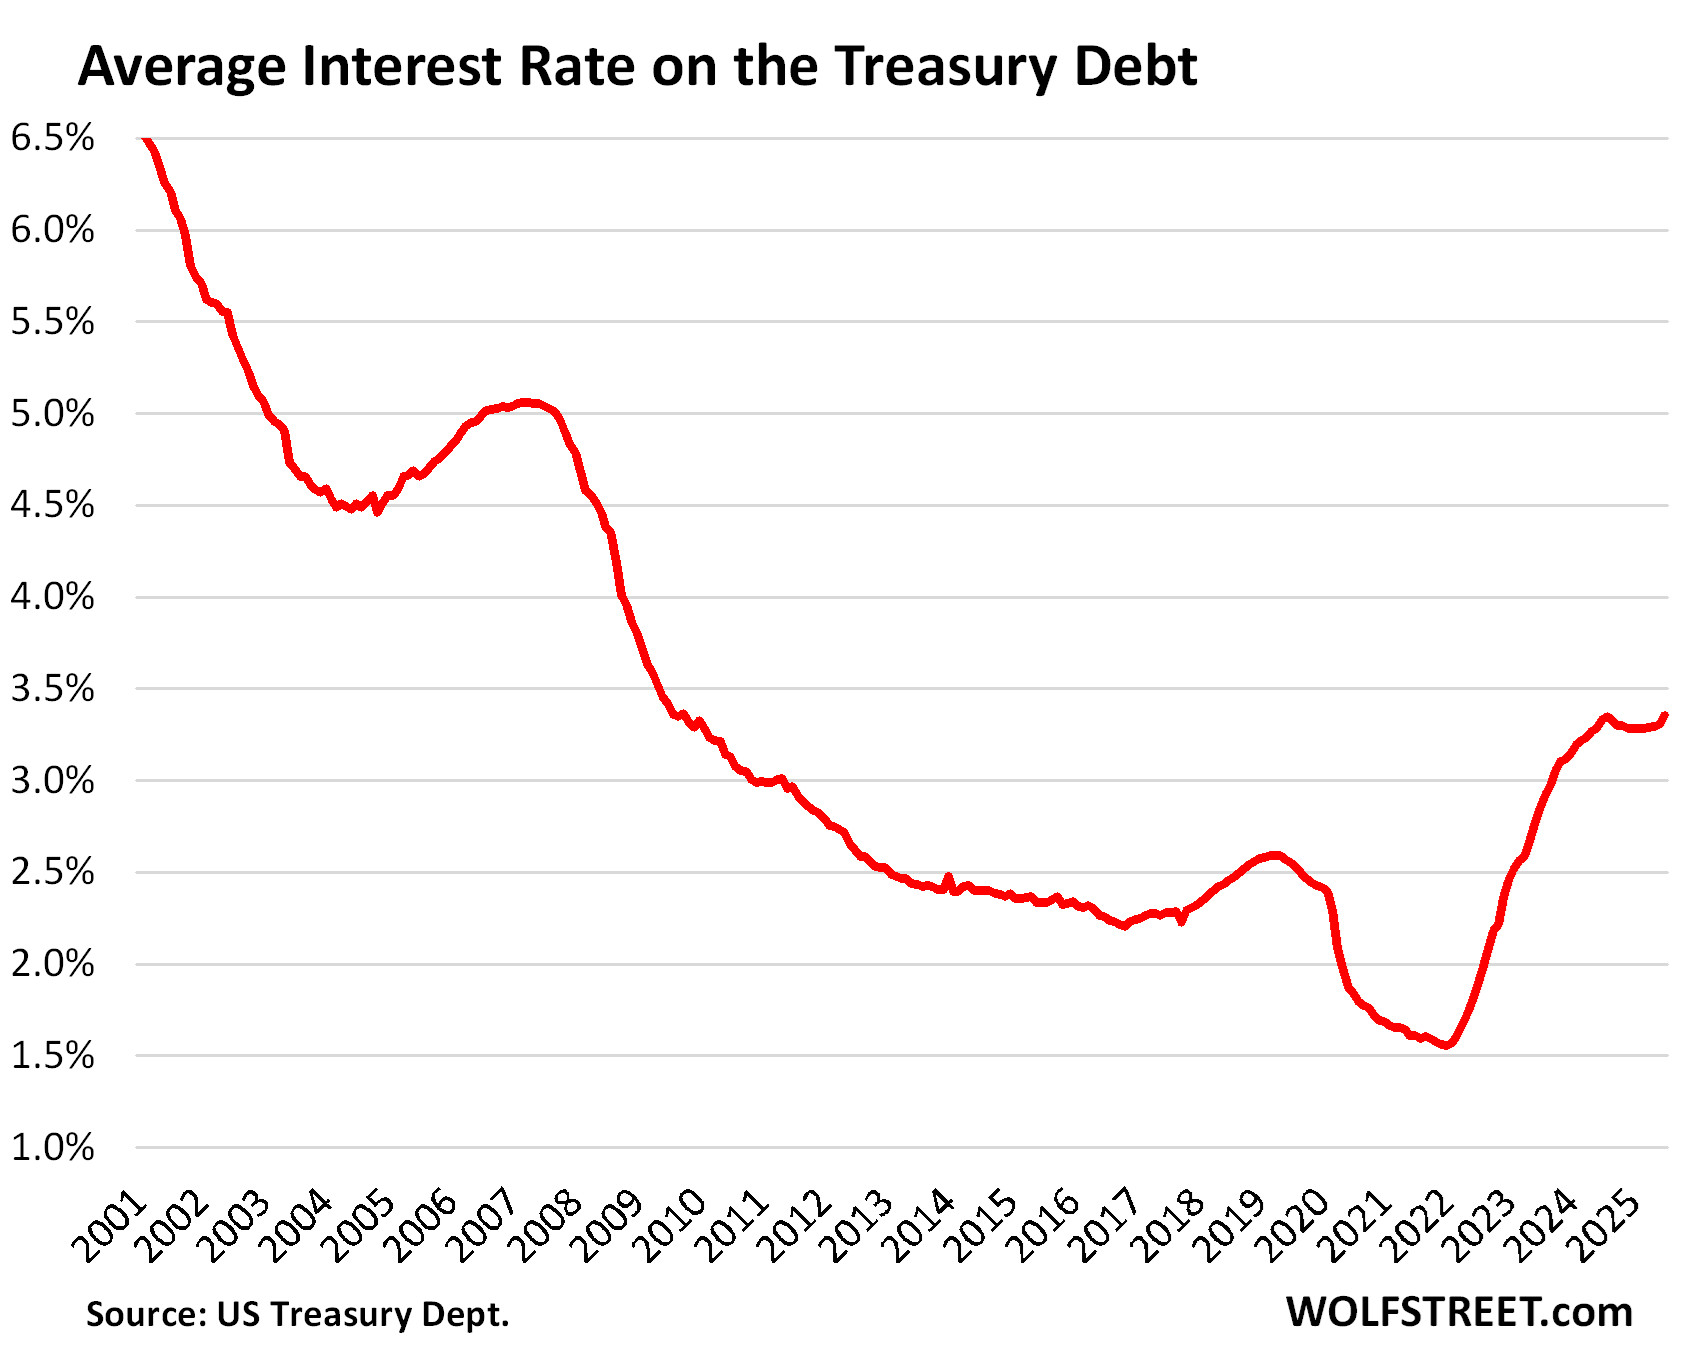
The average interest rate on the Treasury debt – with T-bill yields falling and long-term yields rising – was roughly stable in Q2: 3.29% in April, 3.29% in May, and 3.30% in June, according to Treasury Department data.
Not included in Q2, but included in the chart, is July, when the average interest rate rose to 3.35%, same as in August 2024 when T-bill yields were still near 5%, but long-term yields were lower than today, with the 10-year yield at around 3.8% (it’s 4.22% at the moment).
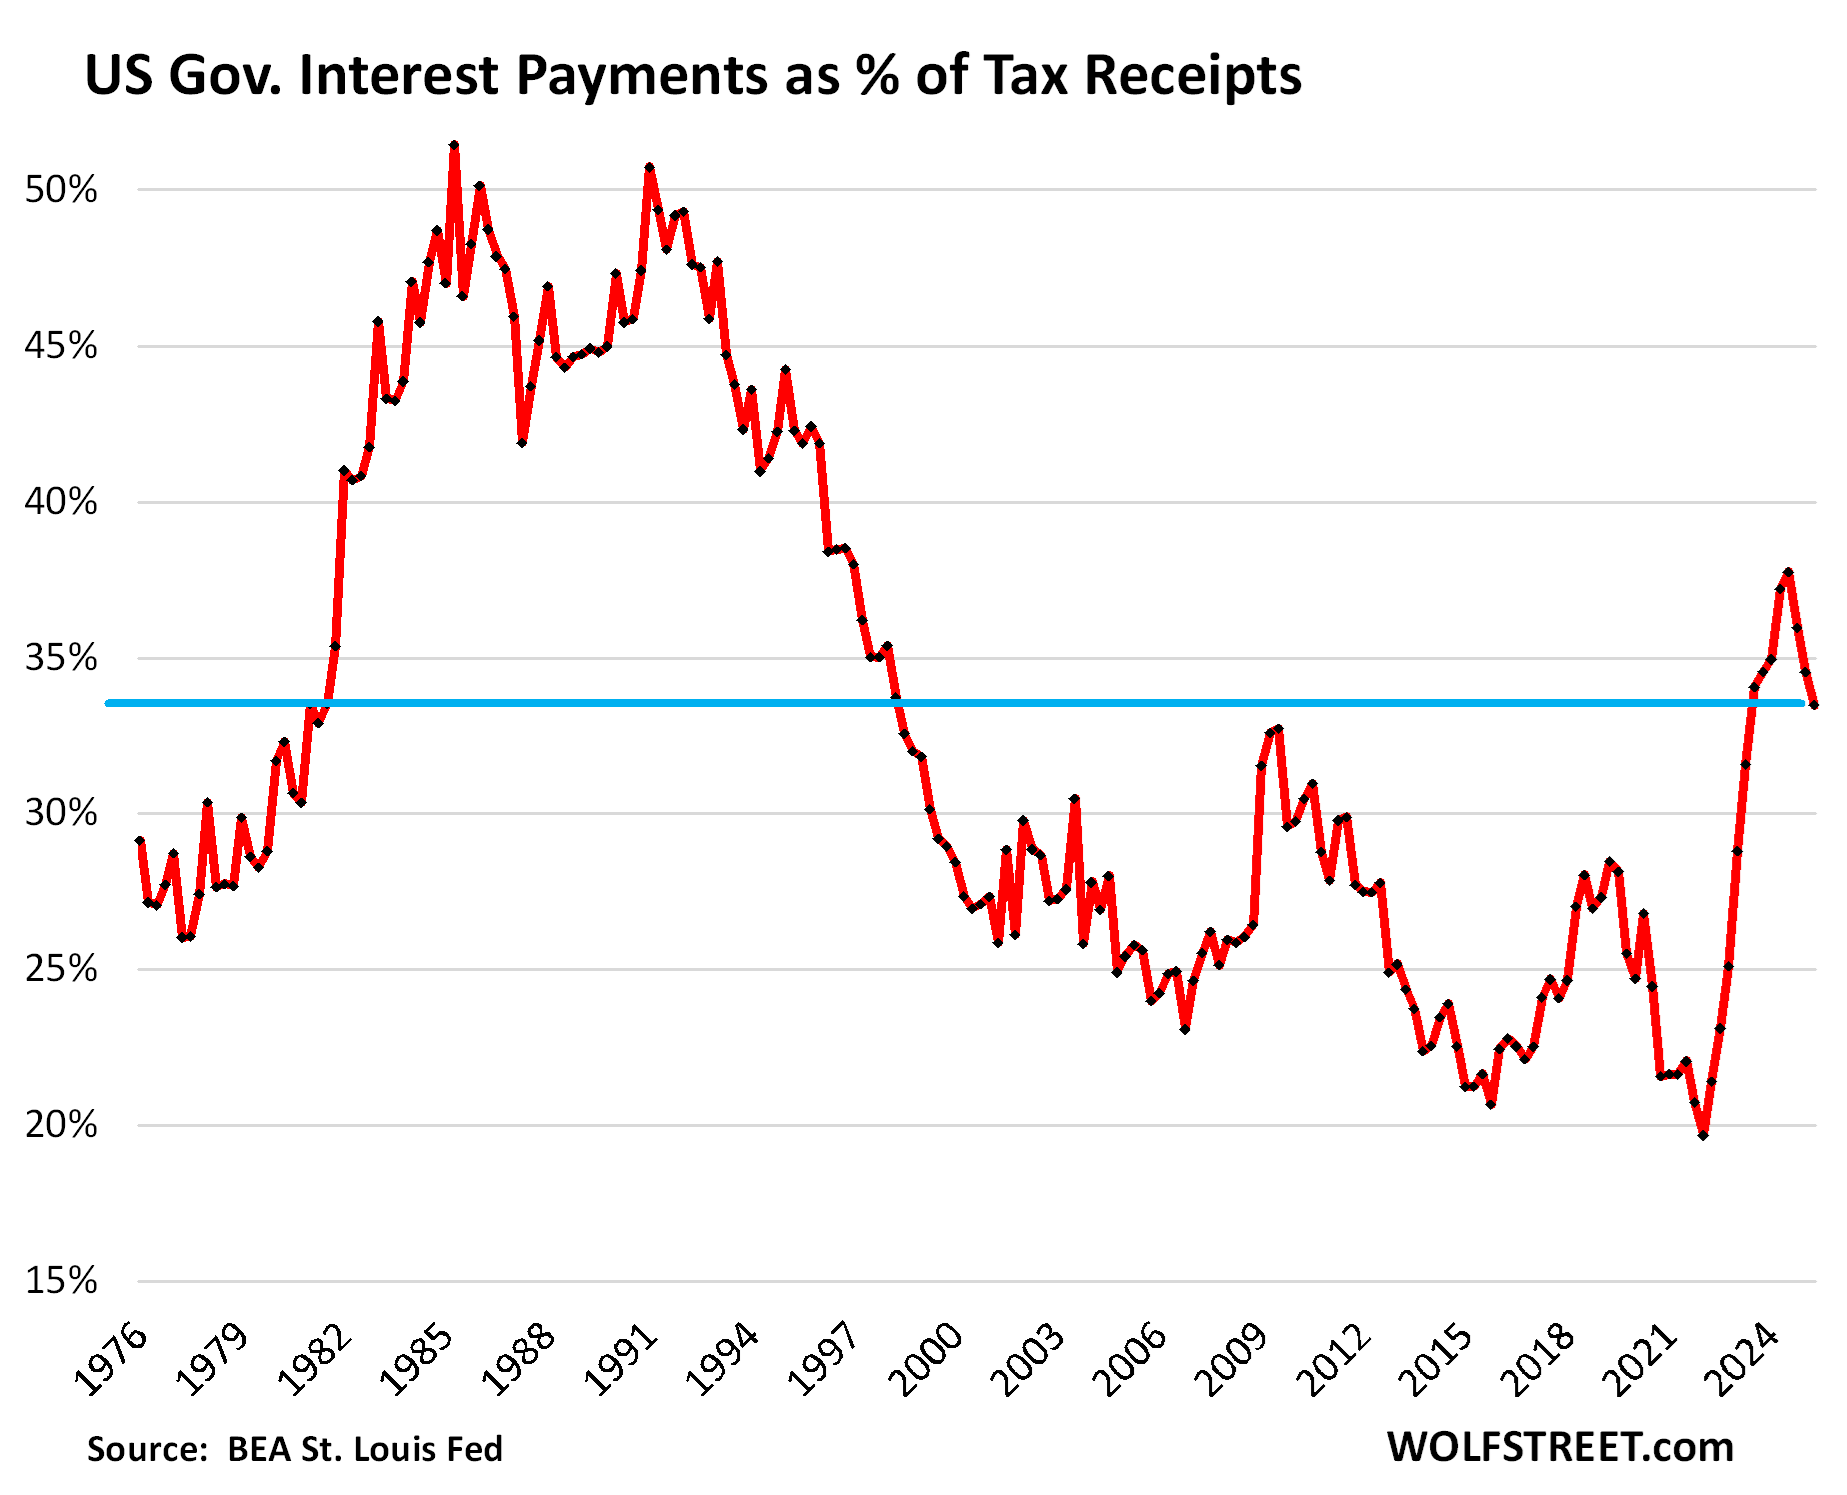
What portion of federal tax receipts gets eaten up by interest payments?
A key question. The answers have not been as ugly as during the last crisis in the early 1980s, when that ratio had exceeded 50%. At the time, investors in bonds were worried and reluctant to buy bonds, the 10-year Treasury yield was over 10% for six years in a row, mortgage rates were over 10% for 12 years in a row, and inflation was high.
Interest payments don’t exist in a vacuum. What pays for them are tax receipts that are available to pay for them: Tax receipts in blue and interest payments in red.
The ratio of Interest payments to tax receipts: Interest payments in Q2 ate up 33.5% of the tax receipts that were available to pay for them. The ratio declined for the third consecutive quarter, driven by higher tax receipts, including from capital gains taxes and tariffs.
The recent high occurred in Q3 2024, at 37.7%, the worst ratio since 1996, when it was on the downtrend from the scary times in the 1980s. The magnitude and speed of this spike over the prior two years was unprecedented in modern US history.
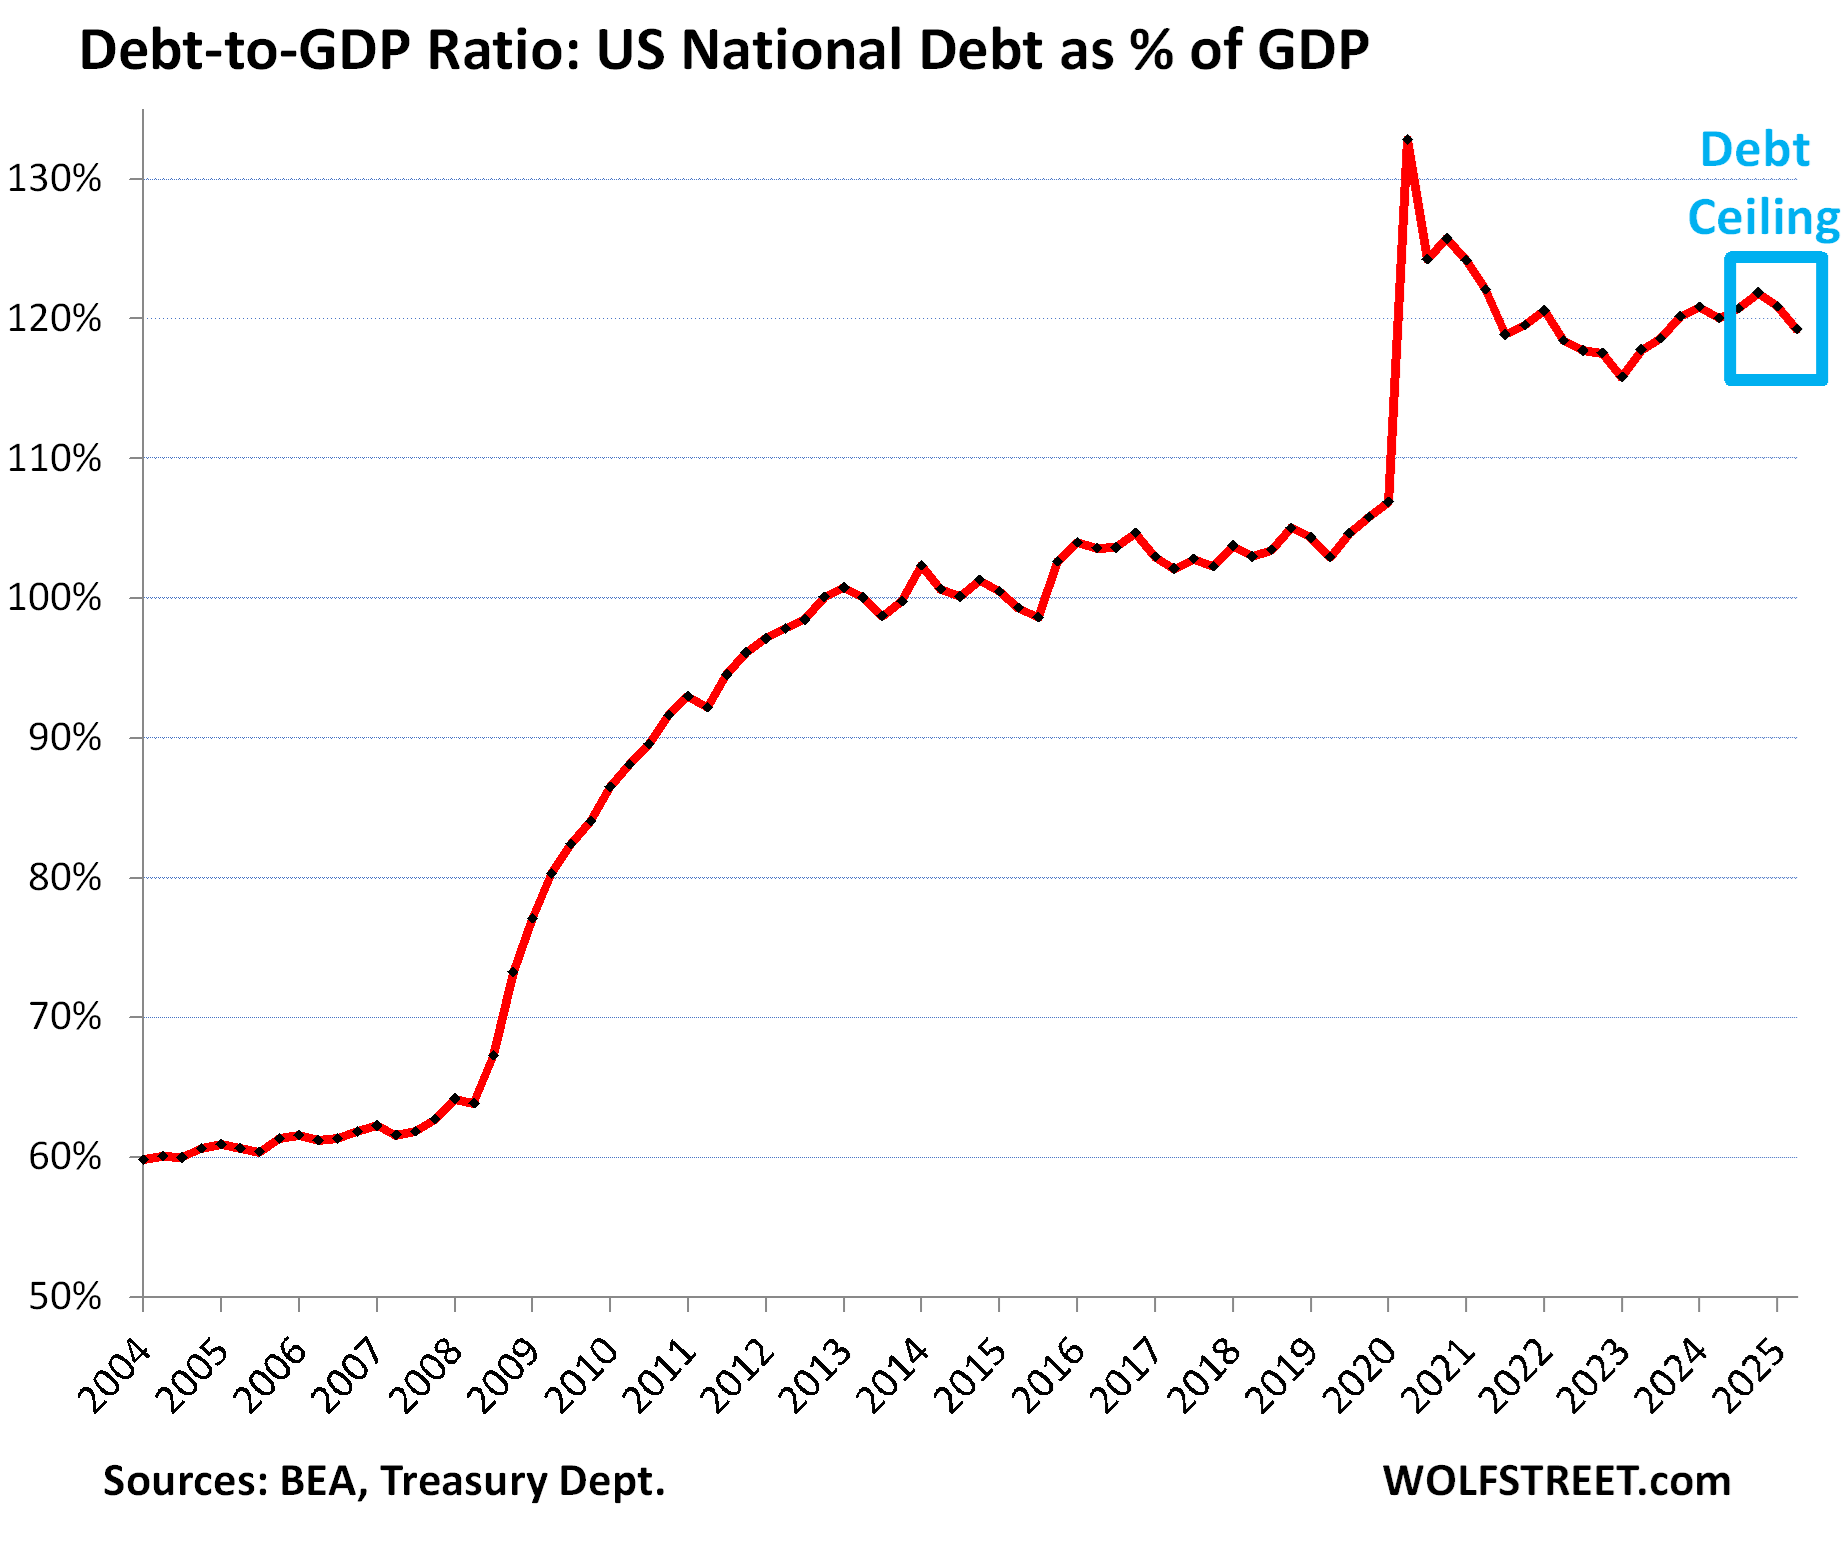
The Debt-to-GDP ratio eased in Q2 to 119.3%, based on the second estimate of Q2 “current dollar” GDP, released by the BEA today. It dipped for the second consecutive quarter because the debt ceiling temporarily blocked the debt from growing over the first six months this year and kept debt at $36.2 trillion through Q2.
The debt has since then ballooned to $37.3 trillion, and it continues to balloon, and that will be reflected in an upward hook in Q3.
The Debt-to-GDP ratio = total debt (not adjusted for inflation) divided by “current dollar” GDP (not adjusted for inflation). Inflation cancels out because the inflation factor affects both the numerator and the denominator equally.
The US, by controlling its own currency, cannot default on debt issued in its own currency because it can always “print” itself out of trouble (Fed buys some of the debt). But in an inflationary environment, printing money to service an out-of-control debt and deficit could cause inflation to spiral out of control, wreak havoc on the economy, and lead to years of wealth destruction and lower standards of living. Everyone knows this.
The far more palatable solution is to trim the annual deficit – including through tariffs – to where economic growth and modest inflation outrun the growth of the deficit, which would gradually over many years alleviate the problem. Whether or not this strategy can be pulled off smoothly remains in doubt.
Enjoy reading WOLF STREET and want to support it? You can donate. I appreciate it immensely. Click on the mug to find out how:
![]()


Tariffs is ultimately a consumption tax. It will lower growth rate by reducing consumption. The Trump fantasy of growing at the current rate or better, but having a trillion dollars of tariff income seems far fetched. It is inconceivable that the ROW will bear trillion dollars tax to do business with the USA.
I don’t see the palatable scenario working out. We will have to be prepared for some money printing.
Yes, tariffs can be looked at as a roundabout way to raise taxes — similar to currency supply inflation in that respect.
Deficit to GDP. I believe US is ~6.5%, EU SGP 3%, France about 4.6%?
I heard earlier today that for France it is around 5.8%, needs to be confirmed.
So, in your opinion Wolf, is Trump trying to fix things? Or does it look like the outcome is the same no matter who is “in charge”?
Howdy Xypher I am not the Lone Wolf, and believe Trump will do what Reagan did. Deficit spending and talk talk talk. Its all politicians do.
Didn’t Trump cut revenues massively driving up the deficits? IIRC, the last Presidents to drive down the deficits were Bush 1, Clinton and Obama.
There is literally a chart in this article showing tax receipts growing under Trump 1, brother
It’s a numbers game and nobody can do anything about it without massive pain. Although the numbers are modest than the current condition of most world economies, the effect is the same.
“Annual income twenty pounds, annual expenditure nineteen [pounds] nineteen [shillings] and six [pence], result happiness. Annual income twenty pounds, annual expenditure twenty pounds ought and six, result misery.” ~ David Copperfield
Hemingway also wrote a memorable quote that everyone knows.
In ancient history, a ‘debt jubilee’ was the ‘solution’ to a chronic problem
that punished savers and lenders and rewarded spenders, with government the worst offenders.
Is it safe to say that, overall, OBBBA was a tax increase, if we ignore the political fiction that extending the Trump 1 tax cuts was itself another tax cut?
Or are we in a lower tax environment now than before OBBBA?
Asking because of this line: “The ratio declined for the third consecutive quarter, driven by higher tax receipts, including from capital gains taxes and tariffs.”
I noticed grocery prices starting to go up again. I buy the same 15 items every week. The ones that are imported from Europe have been affected the most. They are up 15 to 20%., some more than that. I believe the tariffs are the cause. I can afford the increase so I just pay up.
We’re in a “”Kobayashi Maru” situation: it’s a no-win situation based on the fact that there is zero political will (from the voters, or from gov’t officials) to make the hard choices.
The reality is that spending needs to decrease, taxes on the lower and middle classes need to increase; And the chance of this happening in a meaningful way is precisely….zero.