Each market dances to a different drummer. But in some metros, the drummer hasn’t gotten out of bed yet.
By Wolf Richter for WOLF STREET.
The inventory of homes for sale in the Nashville metro spike to a new decade high in July. The inventory increases in the metros of Atlanta, Washington DC, and Columbus brought levels back into the normal-ish range that prevailed in the years before the pandemic. Inventory in the Boston metro has come up a lot, by 61% in two years, but remains well below the pre-pandemic levels. In the Detroit metro, inventories have surged by 35% in two years but are still down by 37% from 2019.
Each market dances to its own drummer, and inventories are diverging – though they’re increasing in all of them compared to 2024 and 2023. In some metros, such as Chicago, New York, and Philadelphia, that drummer hasn’t even gotten out of bed yet.
In other vast markets, discussed earlier here, inventories have reached by far the highest levels for July in the data from Realtor.com going back to 2016. Inventories have shot through the roof in Texas and spiked in the Florida metros, and they soared in the formerly hottest markets in California – some to new decade highs, and others still below the prepandemic years. And in other big metros in the West, inventories are also piling up, such as in Denver, Seattle, Phoenix, Tucson, Portland, and Las Vegas.
It’s not because new listings are inundating the market – they’re not, far from it. It’s because demand has plunged, and homes sit on the market for a long time before they sell or get pulled off the market.
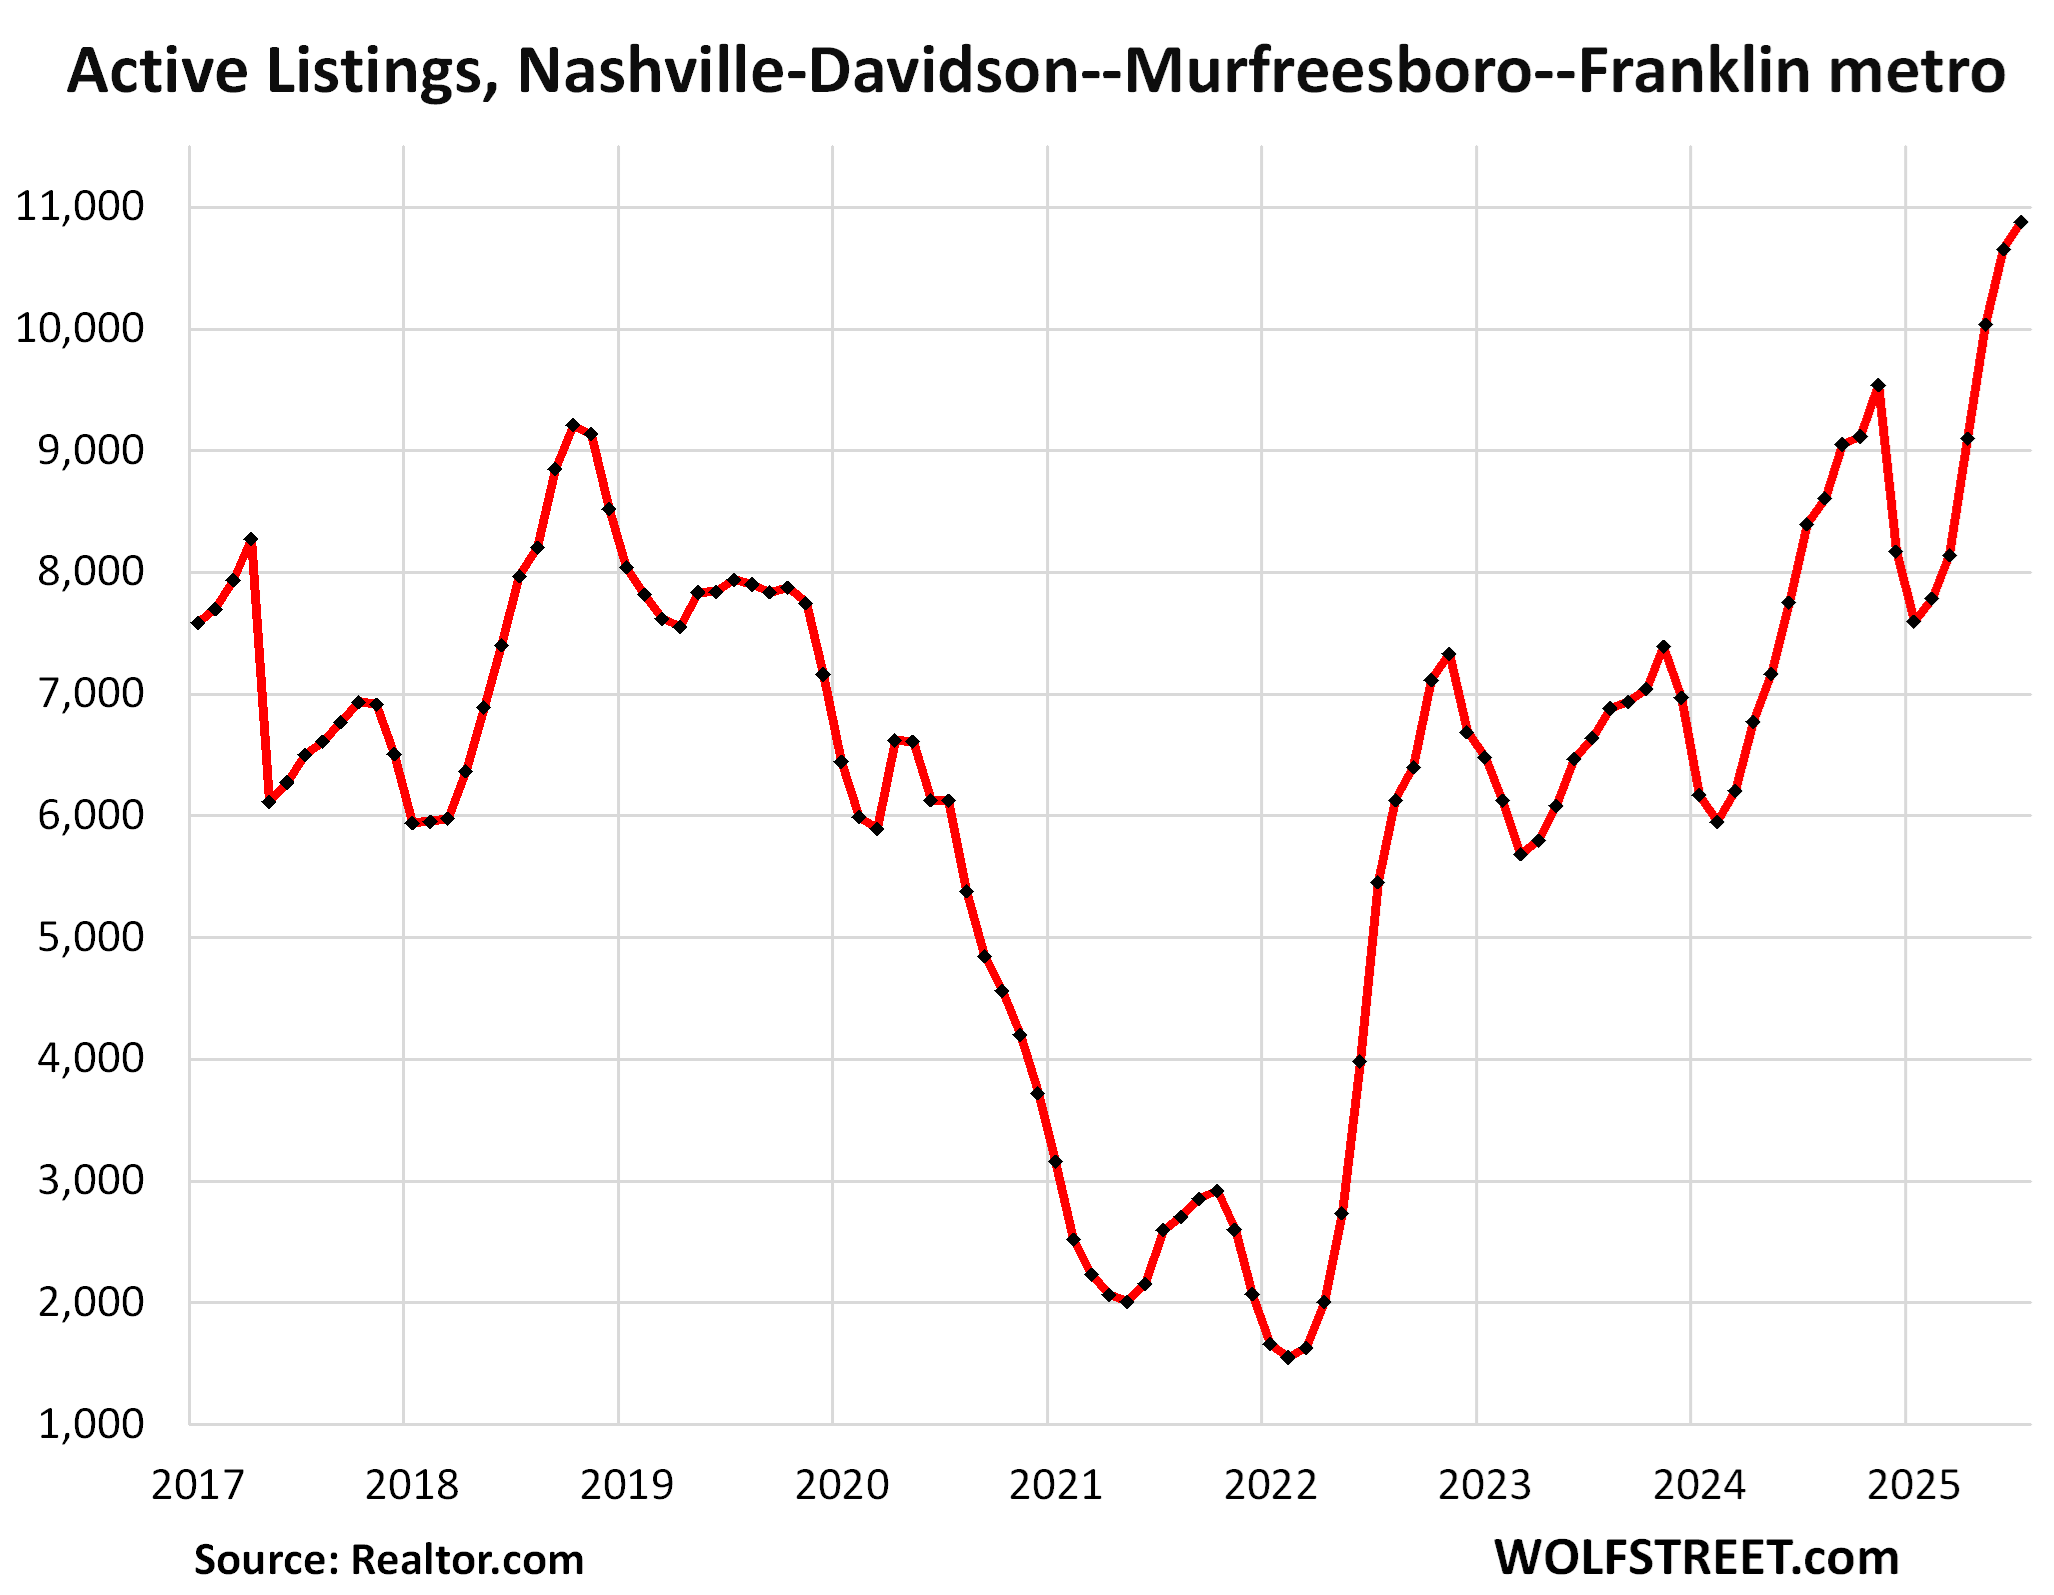
In the Nashville-Davidson–Murfreesboro–Franklin metro, active listings spiked by 30% year-over-year and by 64% from July 2023, to 10,880 listings, the highest in the data from Realtor.com, which goes back to 2016.
Each of the last three months have been records in the decade of data. The pandemic trough was filled in 2024, and now is the overshoot.
Properties sat 55 days on the market before they sold or got pulled off the market, that’s about 20 days longer than in the Julys before the pandemic.
The trough had been caused by the Fed-repressed 3% mortgage rates during a time of raging inflation which reached 9%, and enough buyers didn’t put their old home on the market in order to ride the price spike up all the way, which then fueled the price explosion further till mid-2022. And now, those homes are coming out of the woodwork, and demand has slumped.
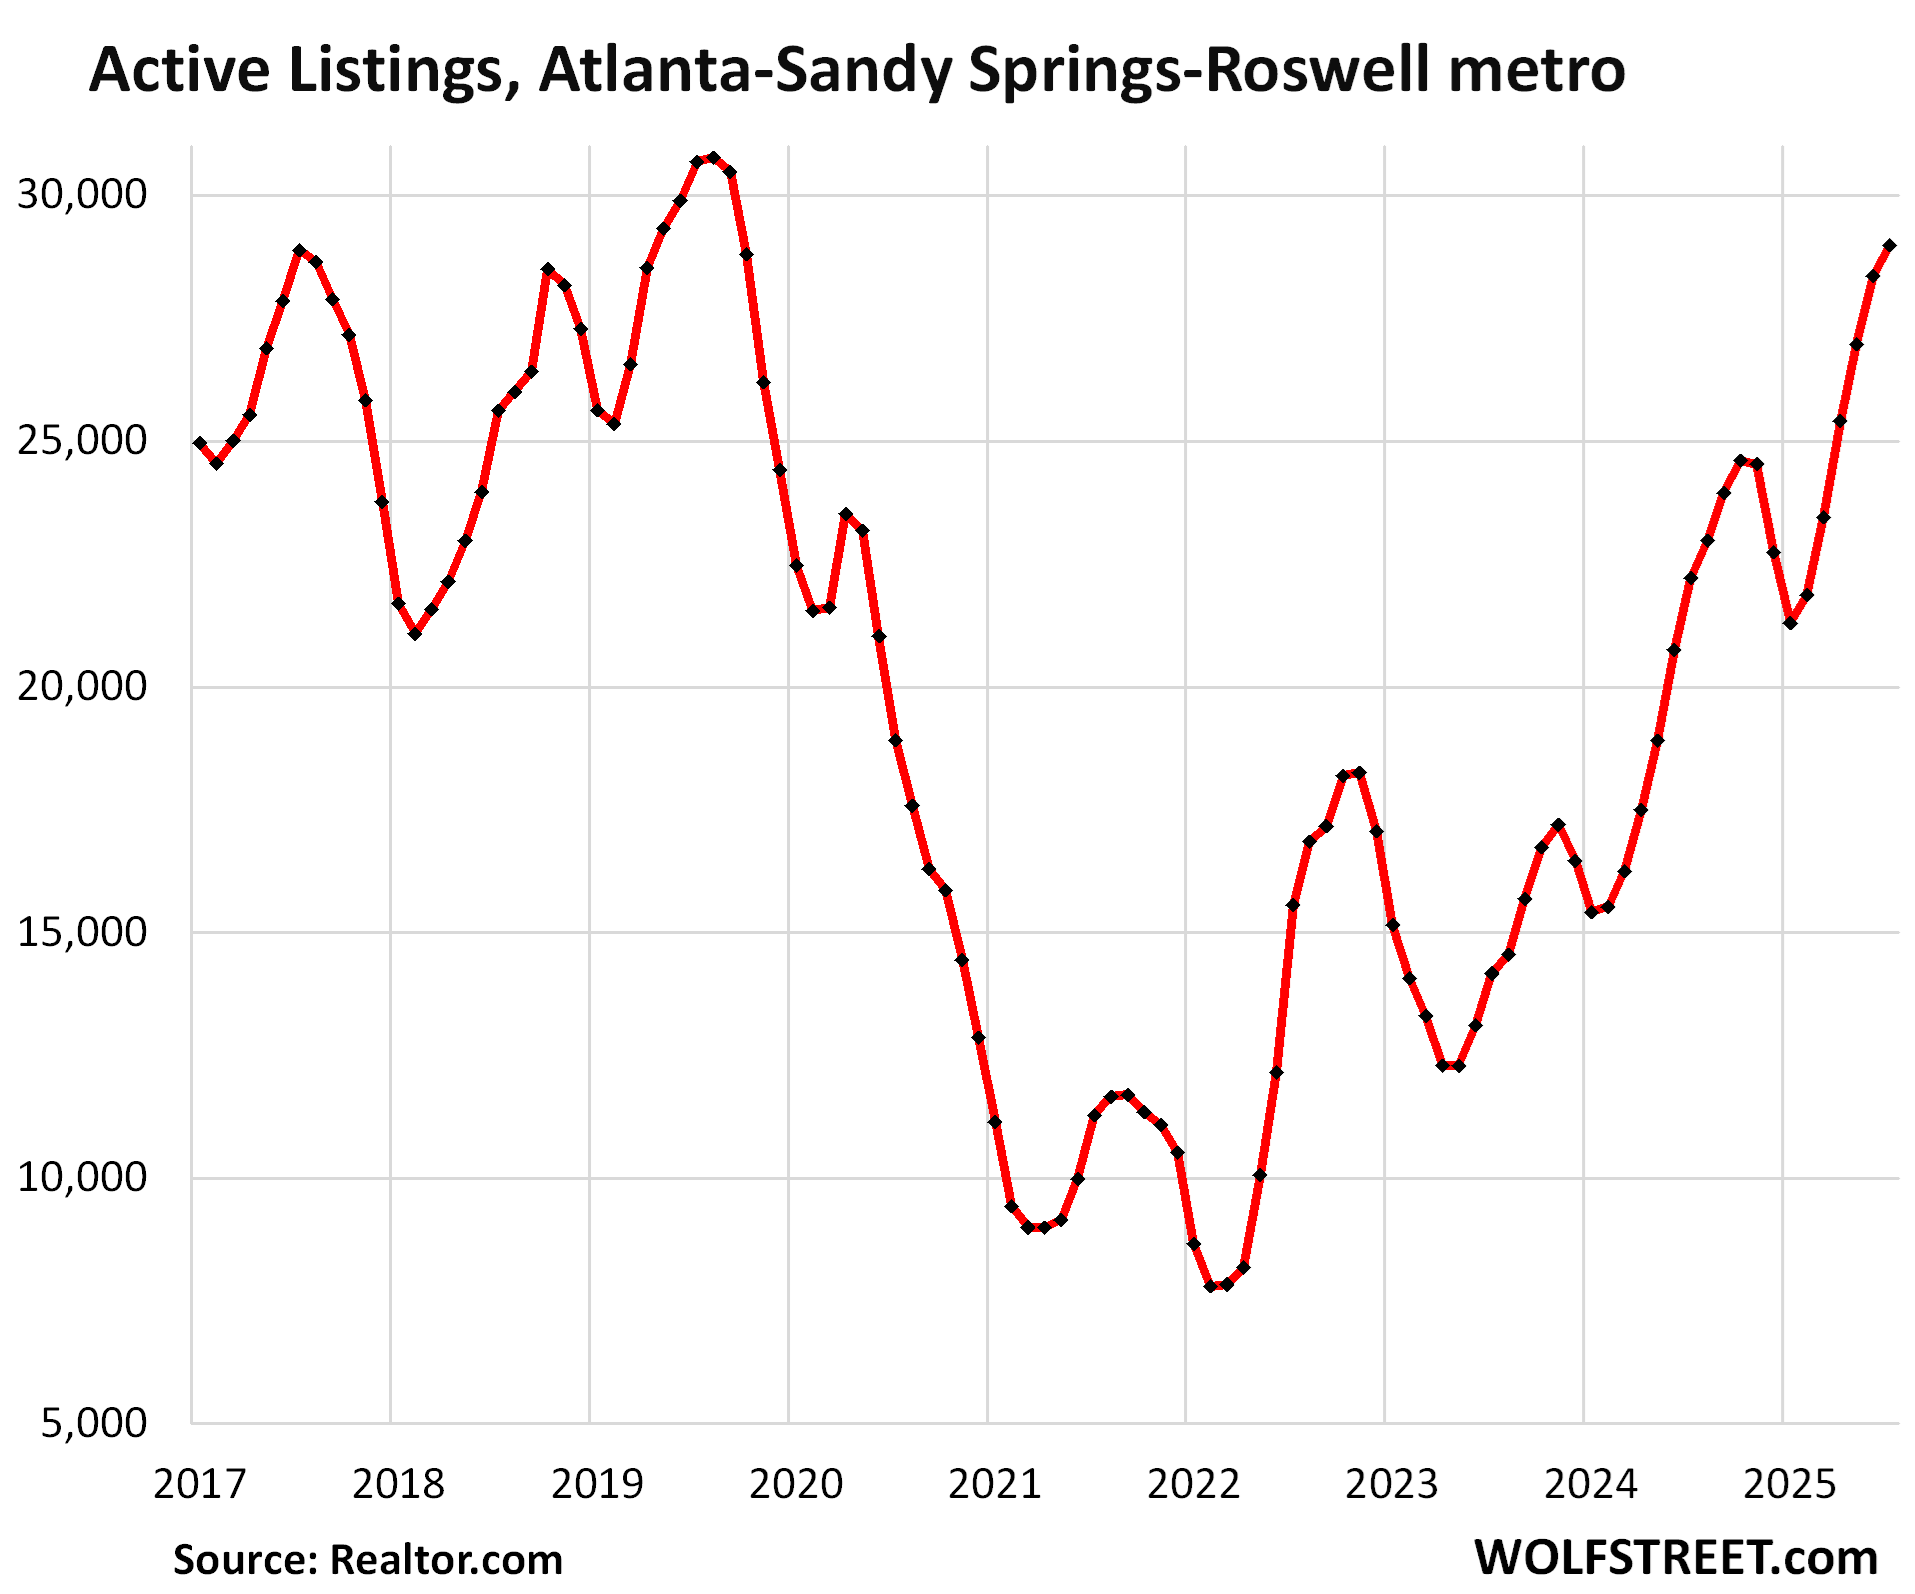
In the Atlanta-Sandy Springs-Roswell metro, active listings spiked by 31% year-over-year in July and by 105% from July 2023, to 28,989 homes listed for sale, the third highest July in the data from Realtor.com, behind the Julys of 2019 (30,690 homes) and 2016 (32,373 homes).
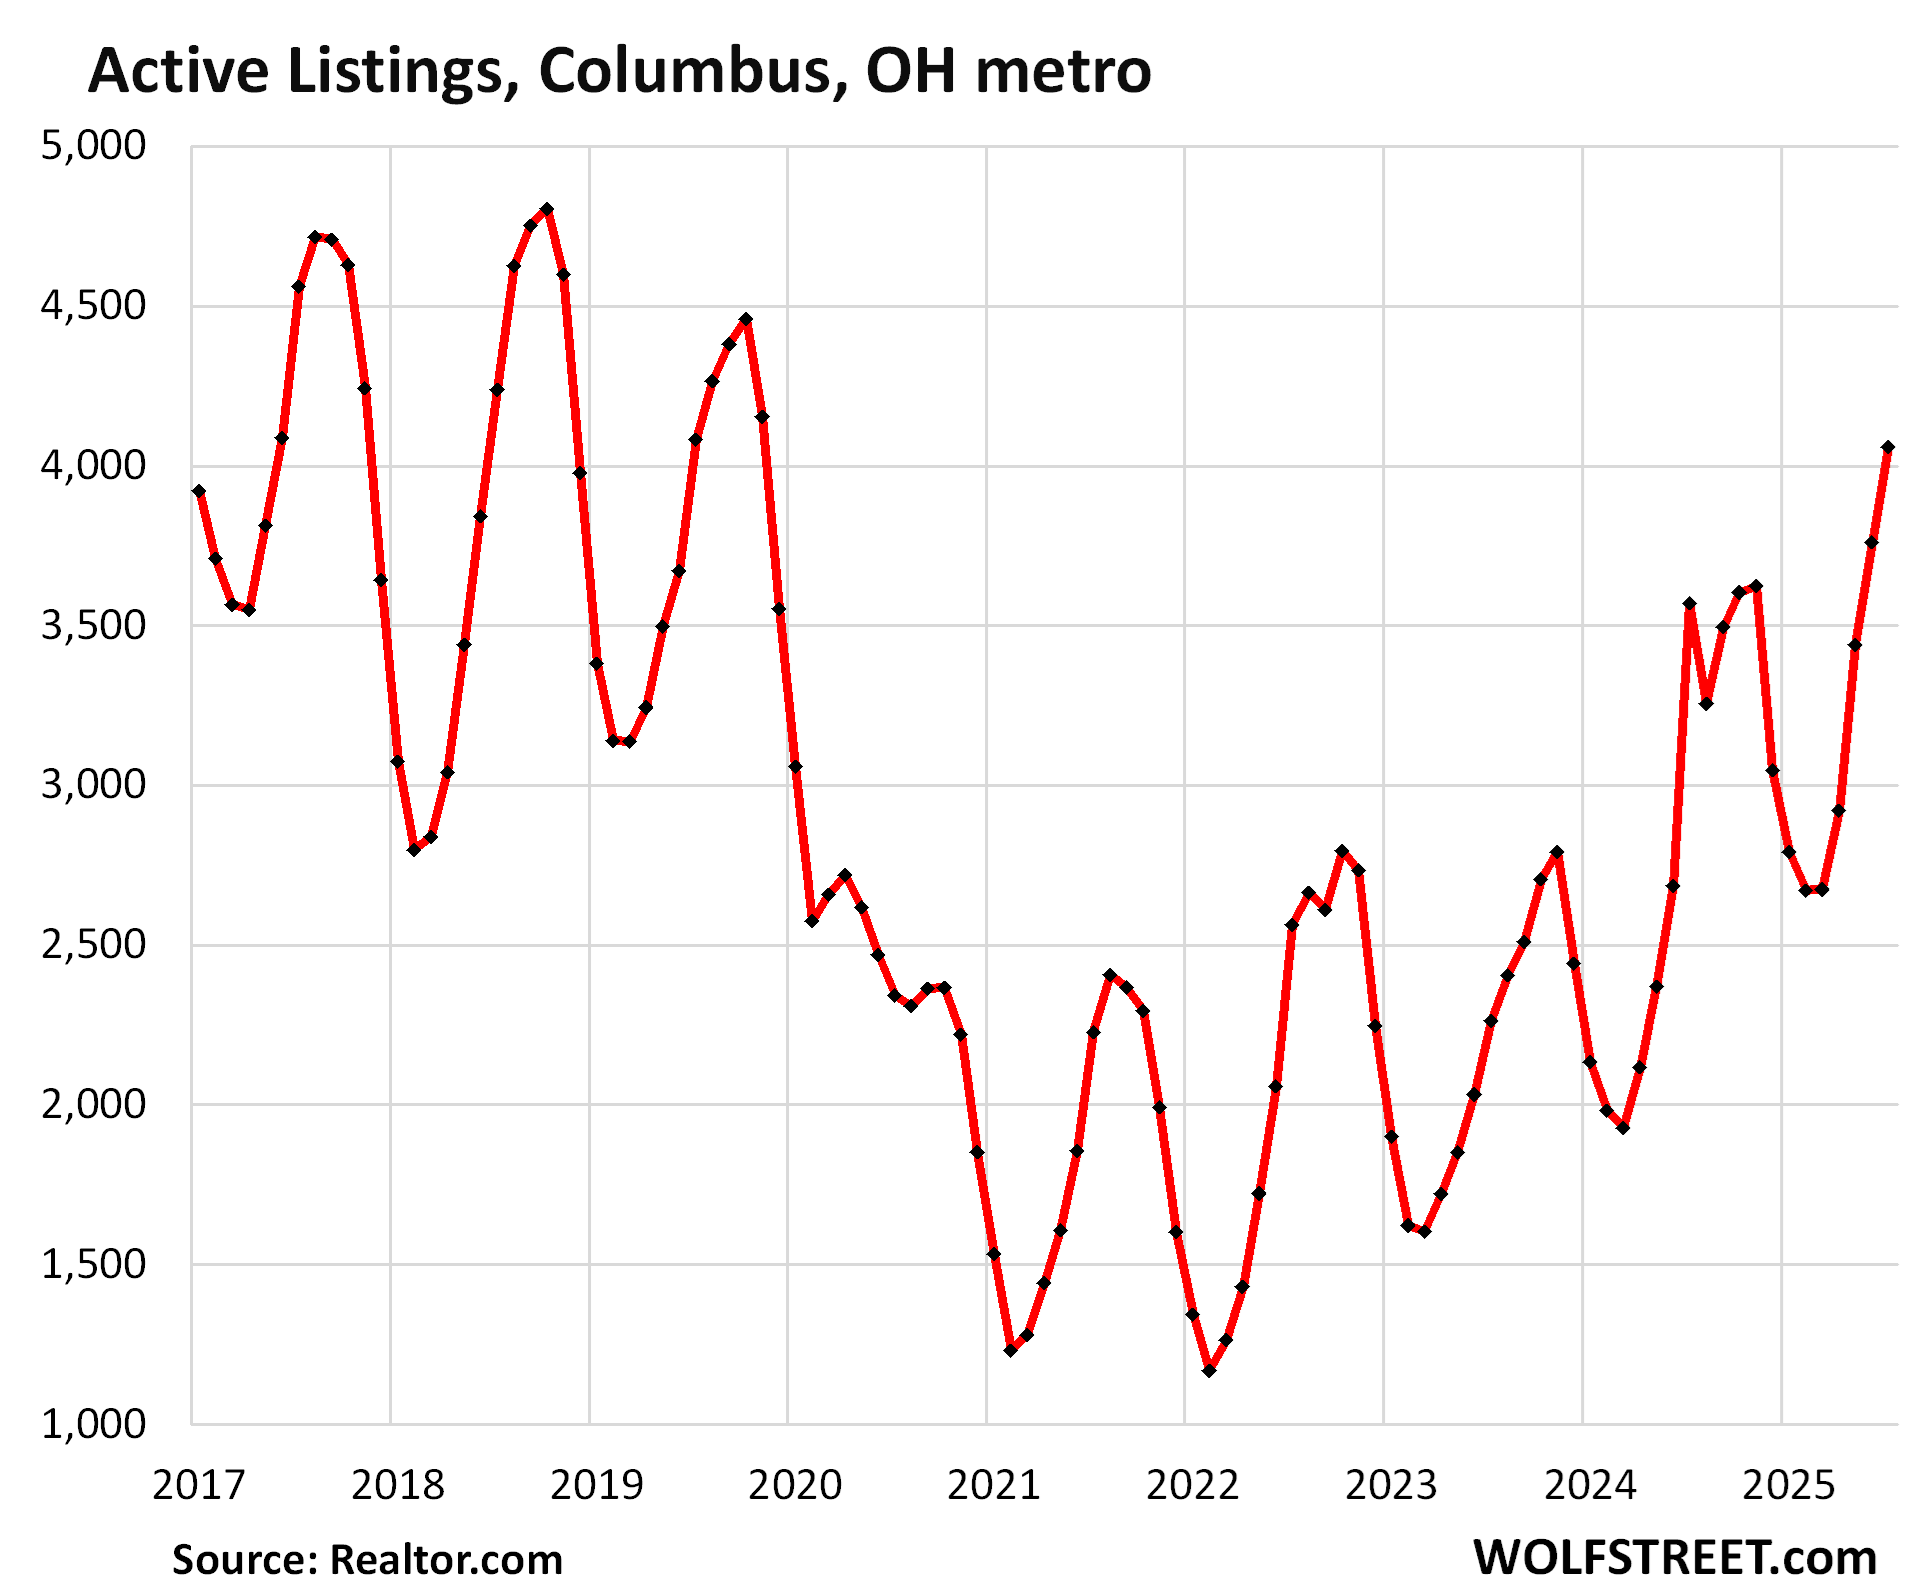
In the Columbus, OH, metro, inventory jumped by 14% year-over-year and by 79% from July 2023, to 4,058 homes, roughly flat with July 2019 and down by 4% from July 2018.
The seasonal peaks are around September or October.
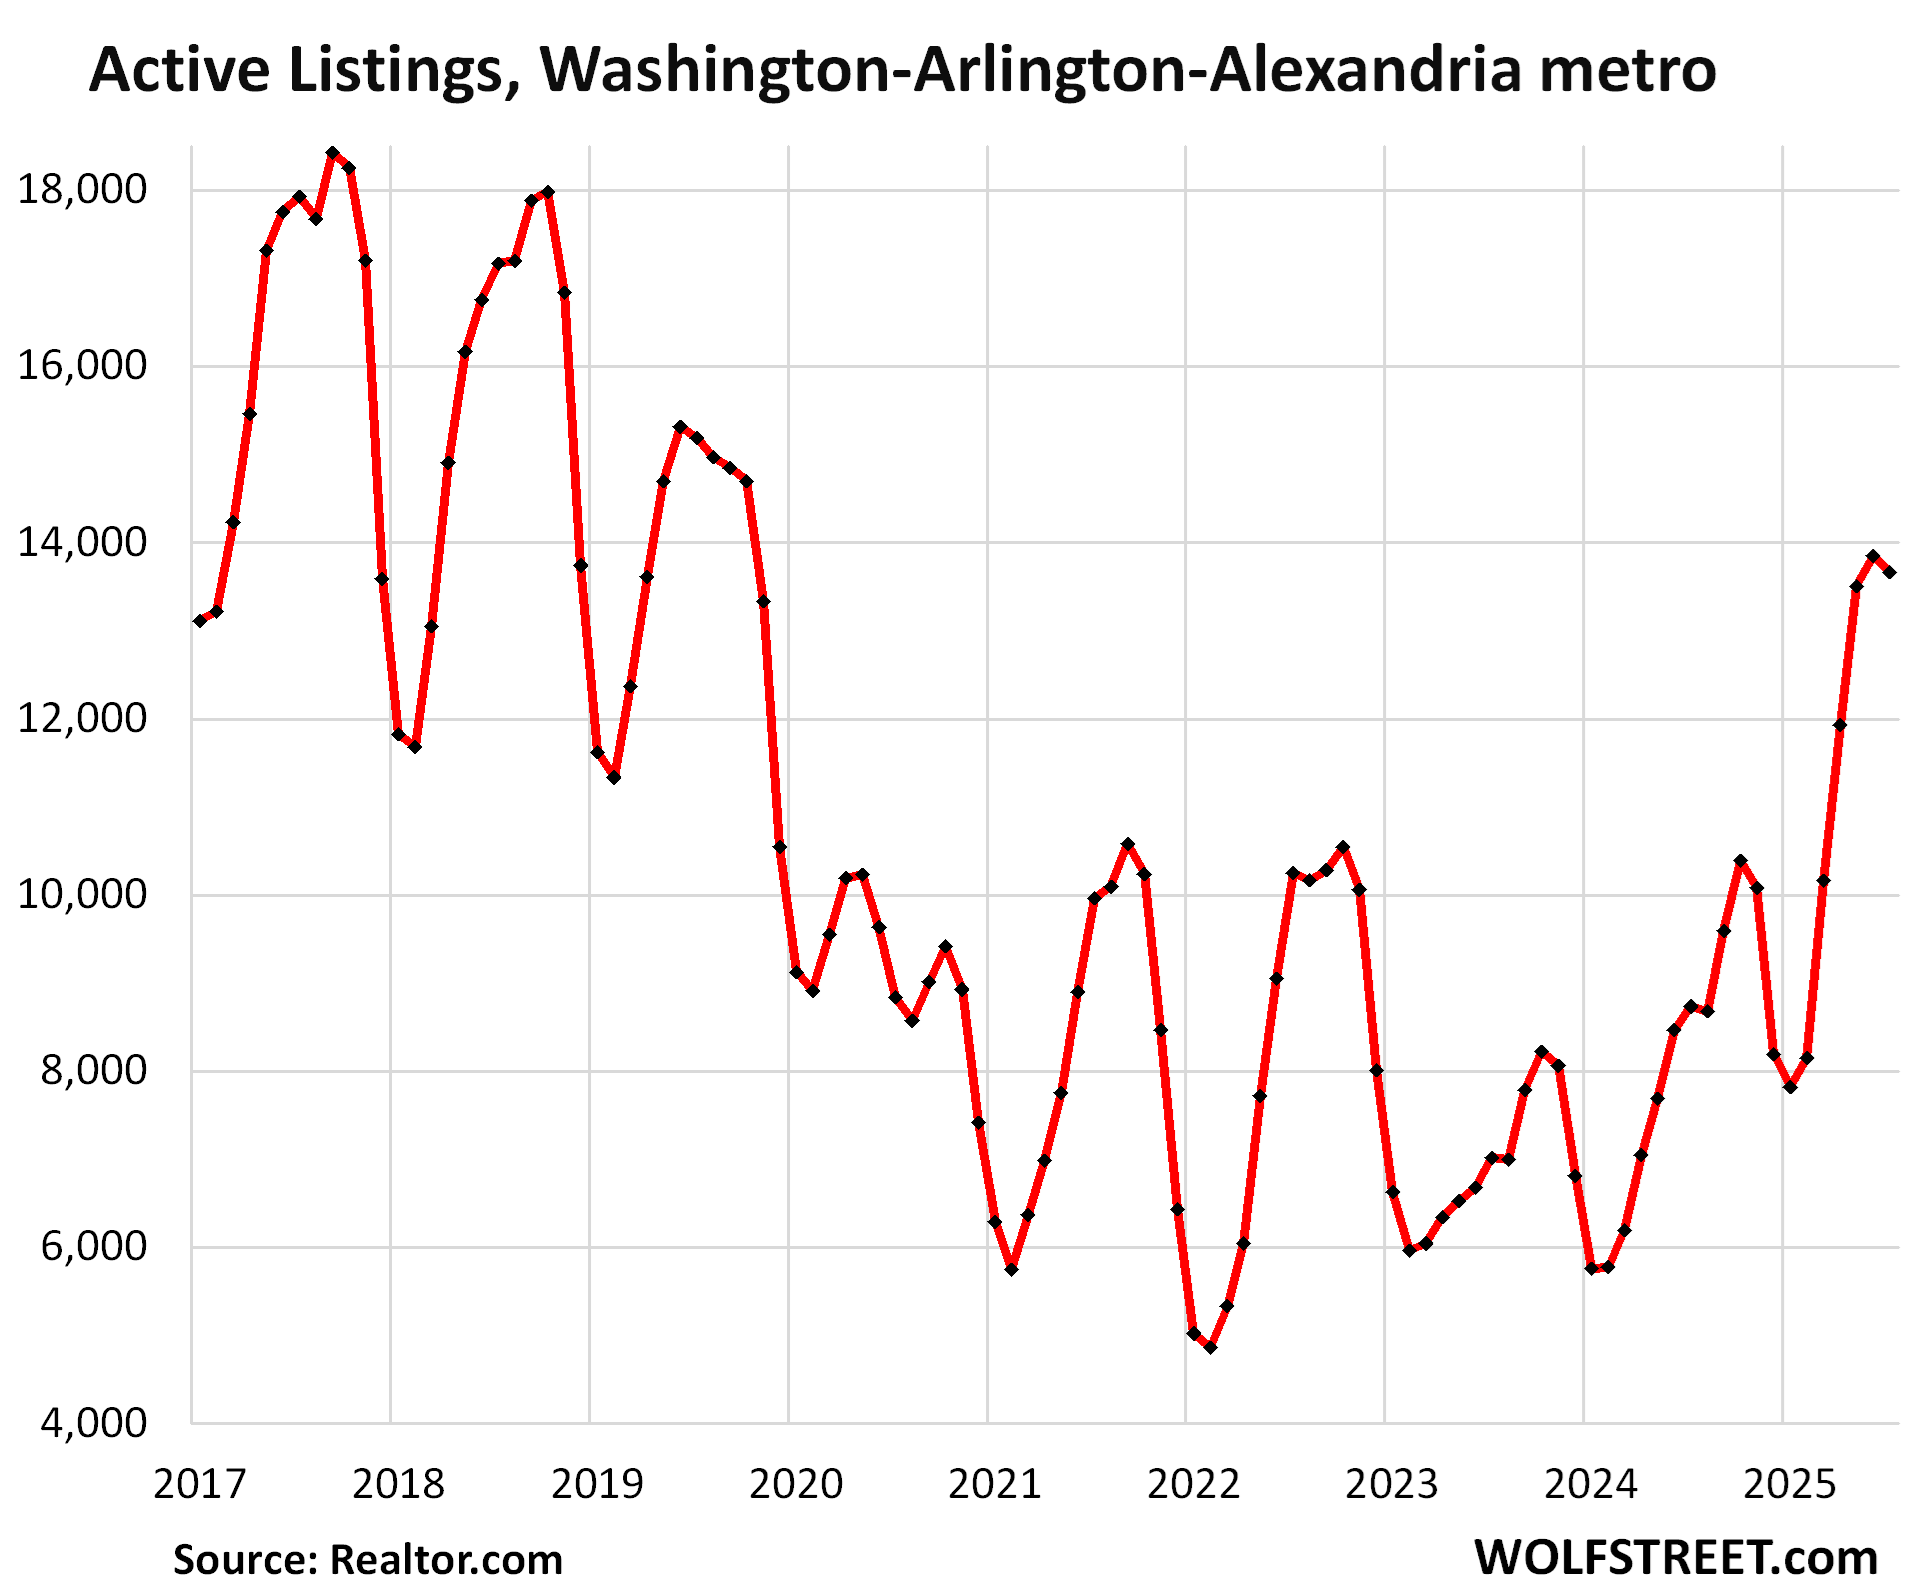
In the Washington-Arlington-Alexandria metro, active listings jumped by 56% year-over-year in July, and by 95% from July 2023, to 13,669 homes listed for sale, having suddenly in the span of a few months emerged from the pandemic trough, but remain below the prepandemic Julys.
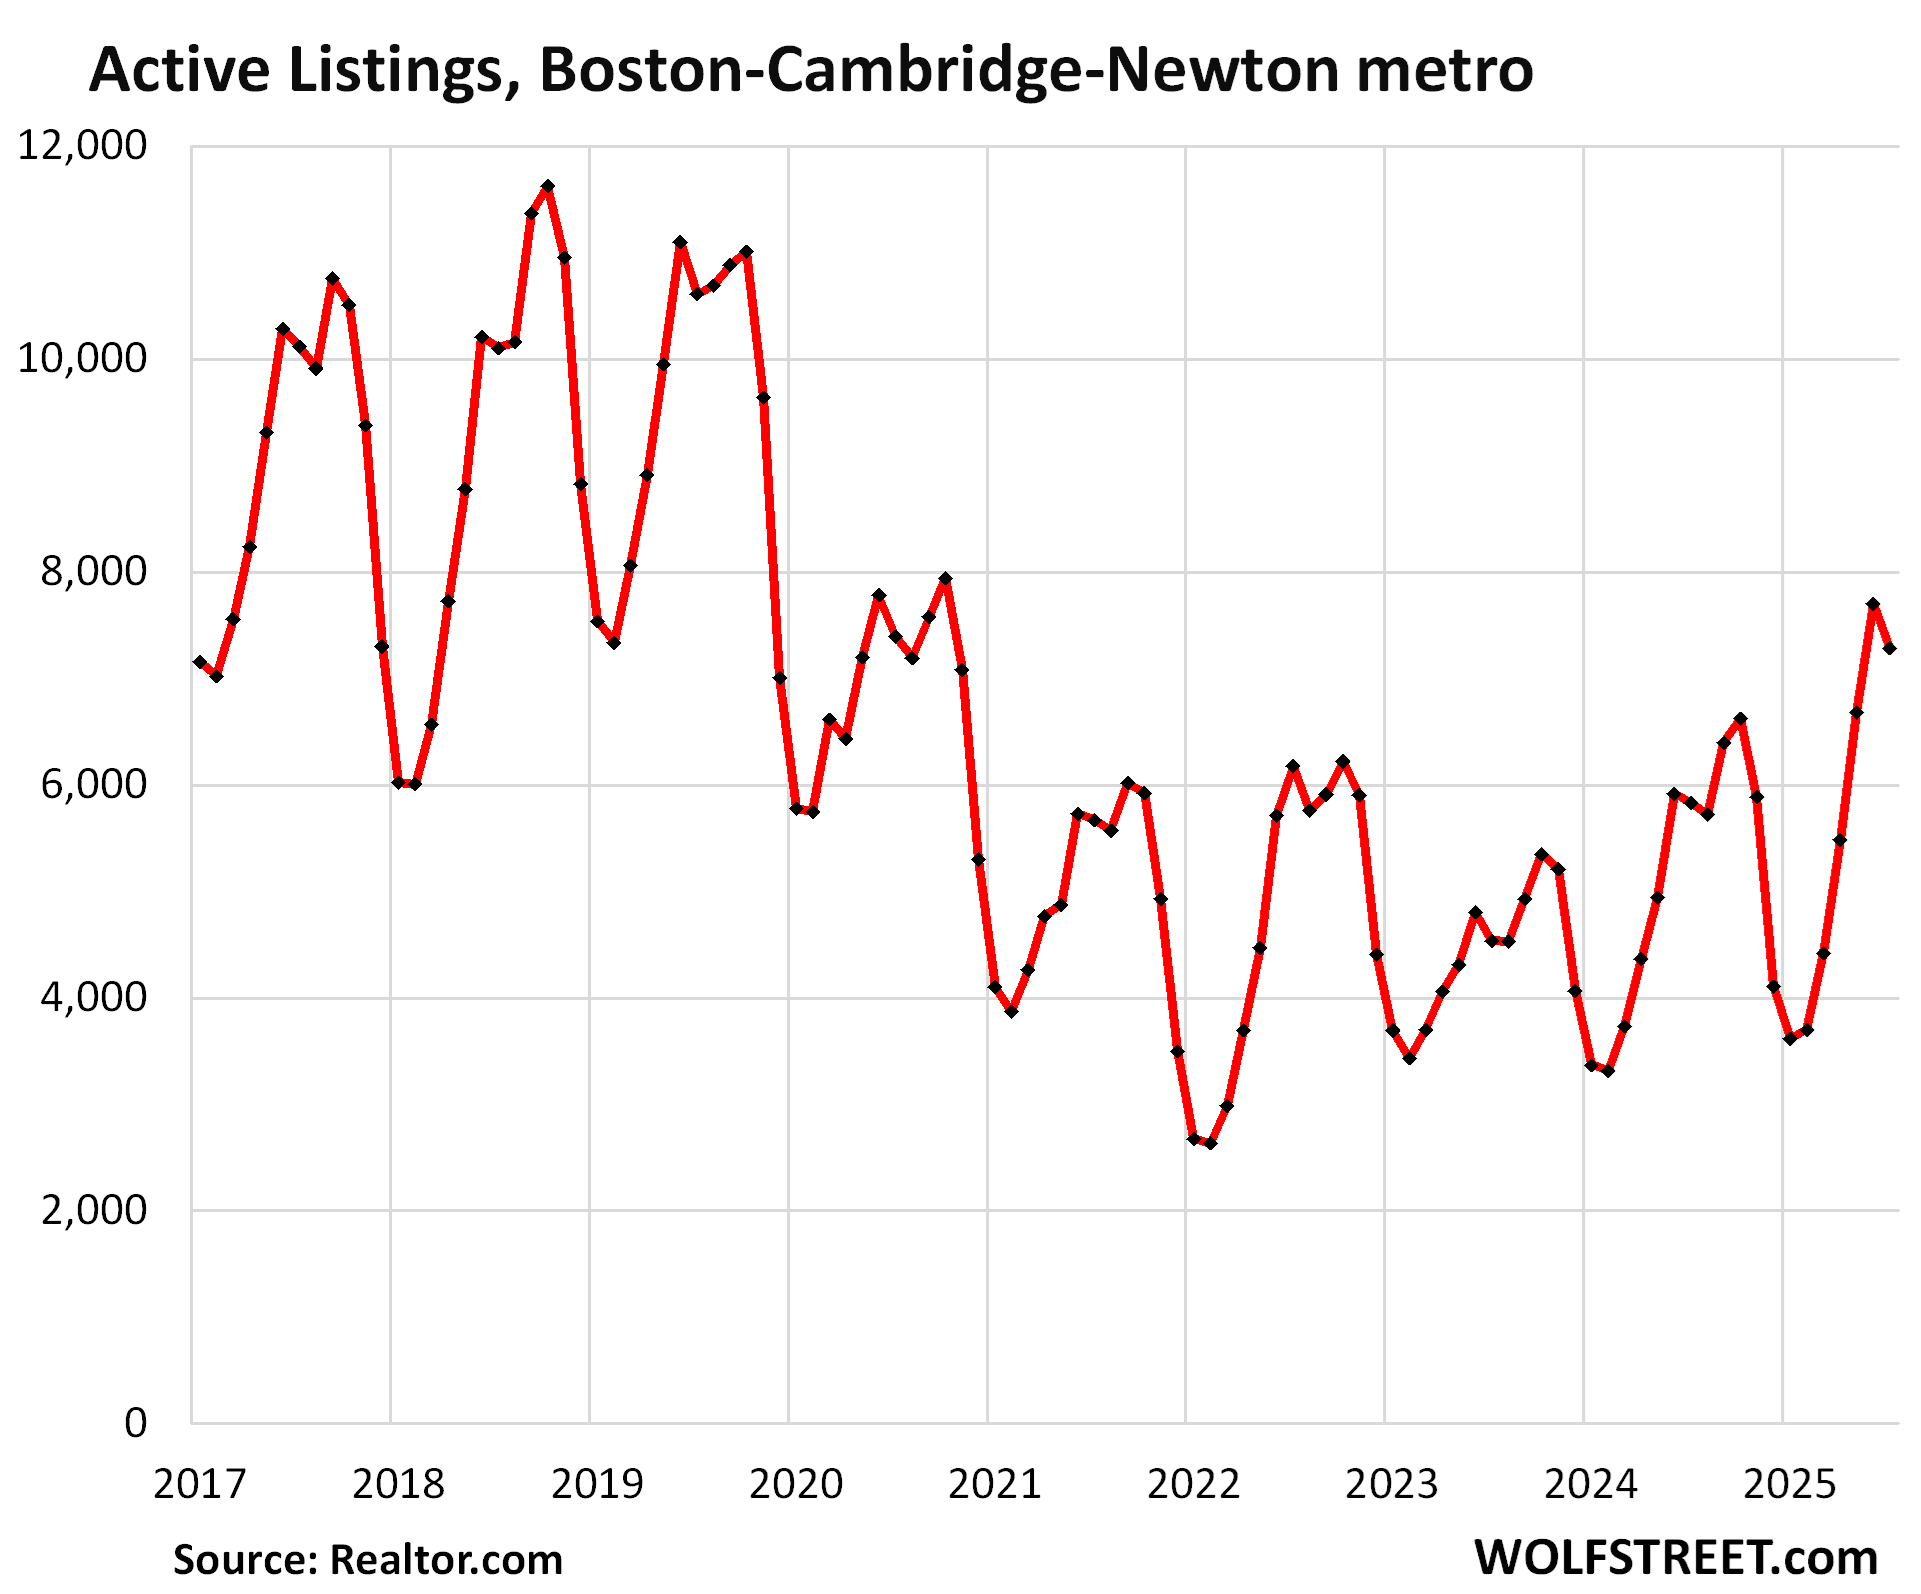
In the Boston-Cambridge-Newton metro, inventory jumped by 25% year-over-year and by 61% from July 2023, to 7,286 homes for sale, roughly level with July 2020, and well below the prepandemic years.
These big year-over-year increases over the past two year came off ultra-low levels. So active listings were still 31% below 2019 and 28% below the inventories in July 2018 and 2019.
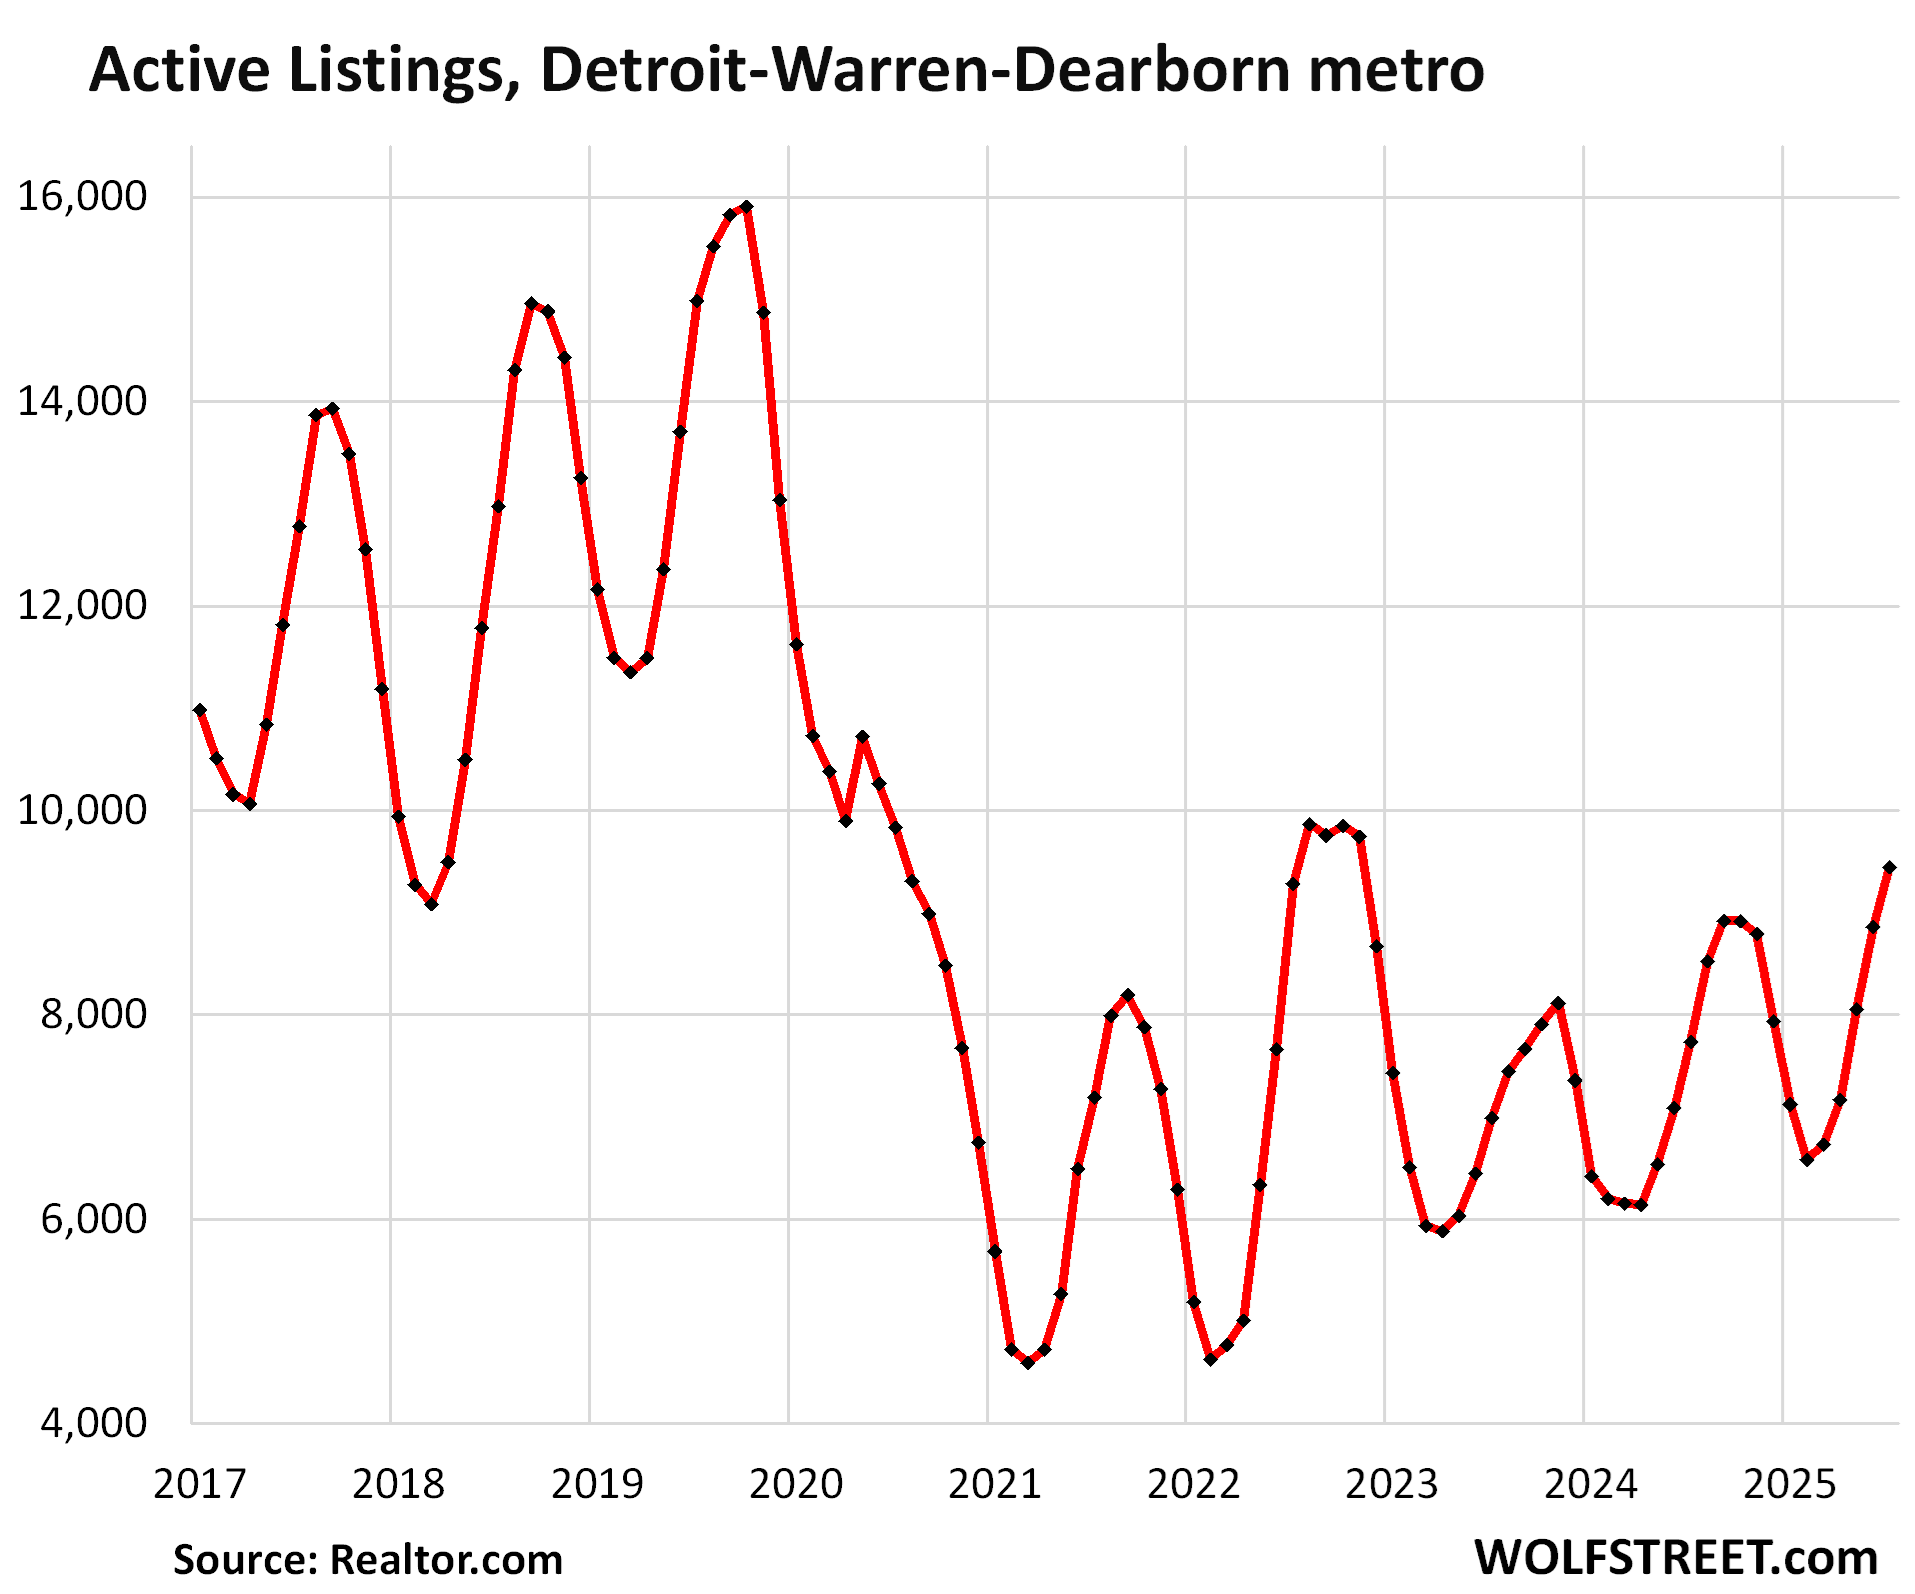
In the Detroit-Warren-Dearborn metro, active listings jumped by 22% year-over-year, and by 35% from July 2023 to 9,450 homes, just a hair below July 2020, and well below the prior Julys in the data from Realtor.com.
Compared to July 2019, listings were still down by 37%, and compared to 2018 by 27%. The seasonal peaks are in September or October.
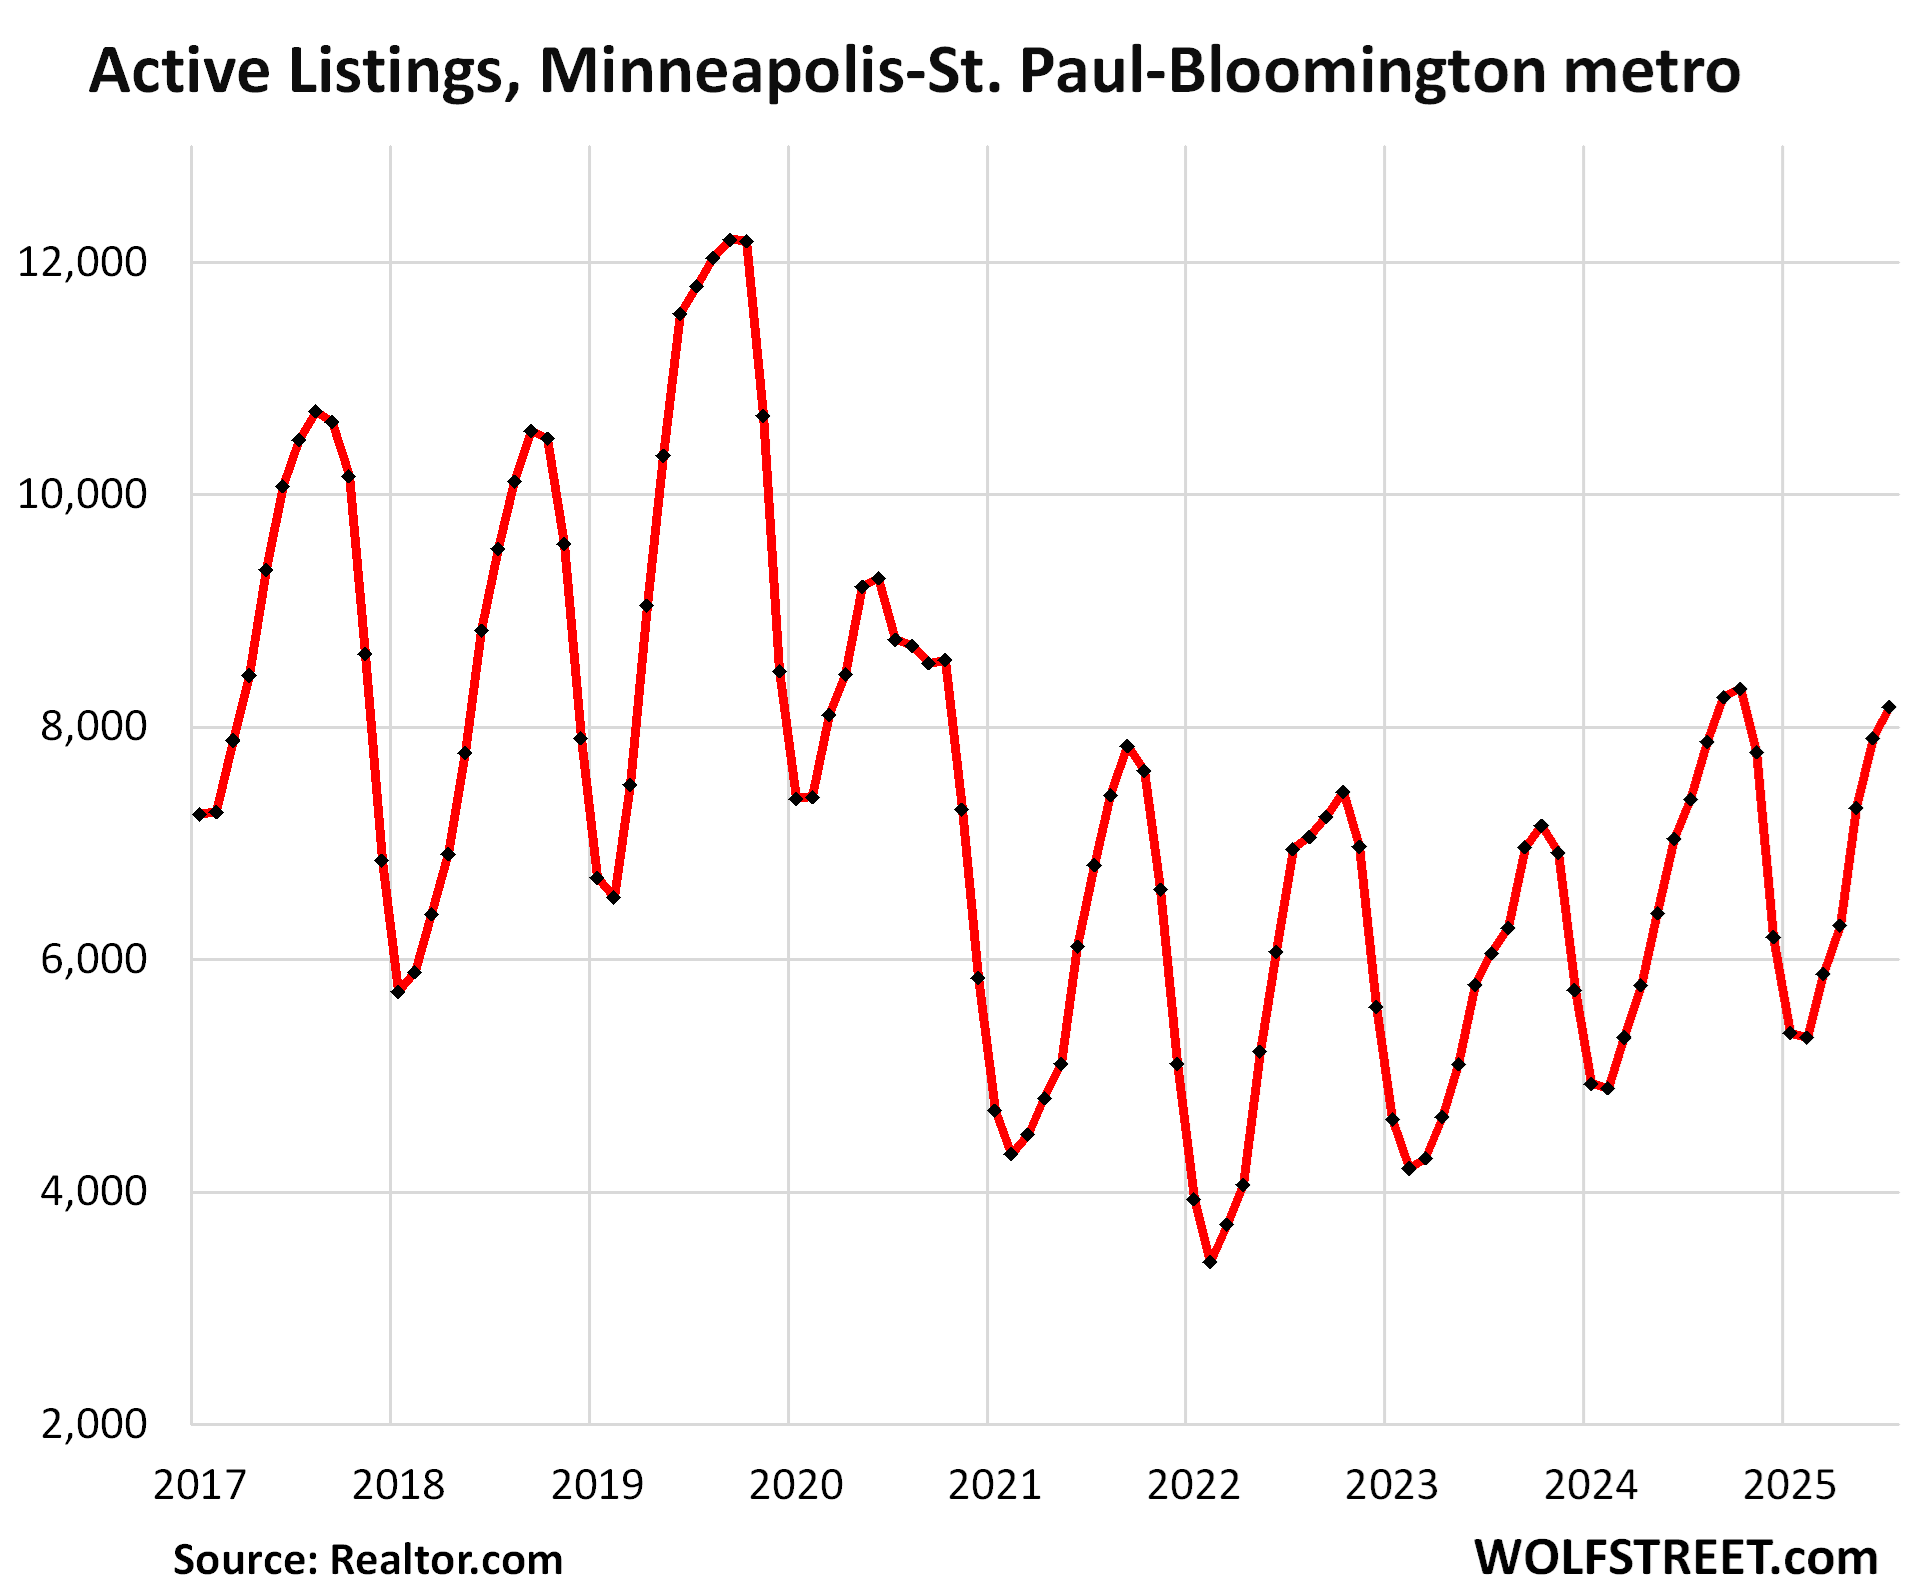
In the Minneapolis-St. Paul-Bloomington metro, active listings rose by 11% year-over-year, and by 35% from July 2023 to 8,174 homes, the highest since July 2020 and well below the pre-pandemic Julys.
Compared to July 2019, listings were still down by 31%, and compared to 2018 by 14%.
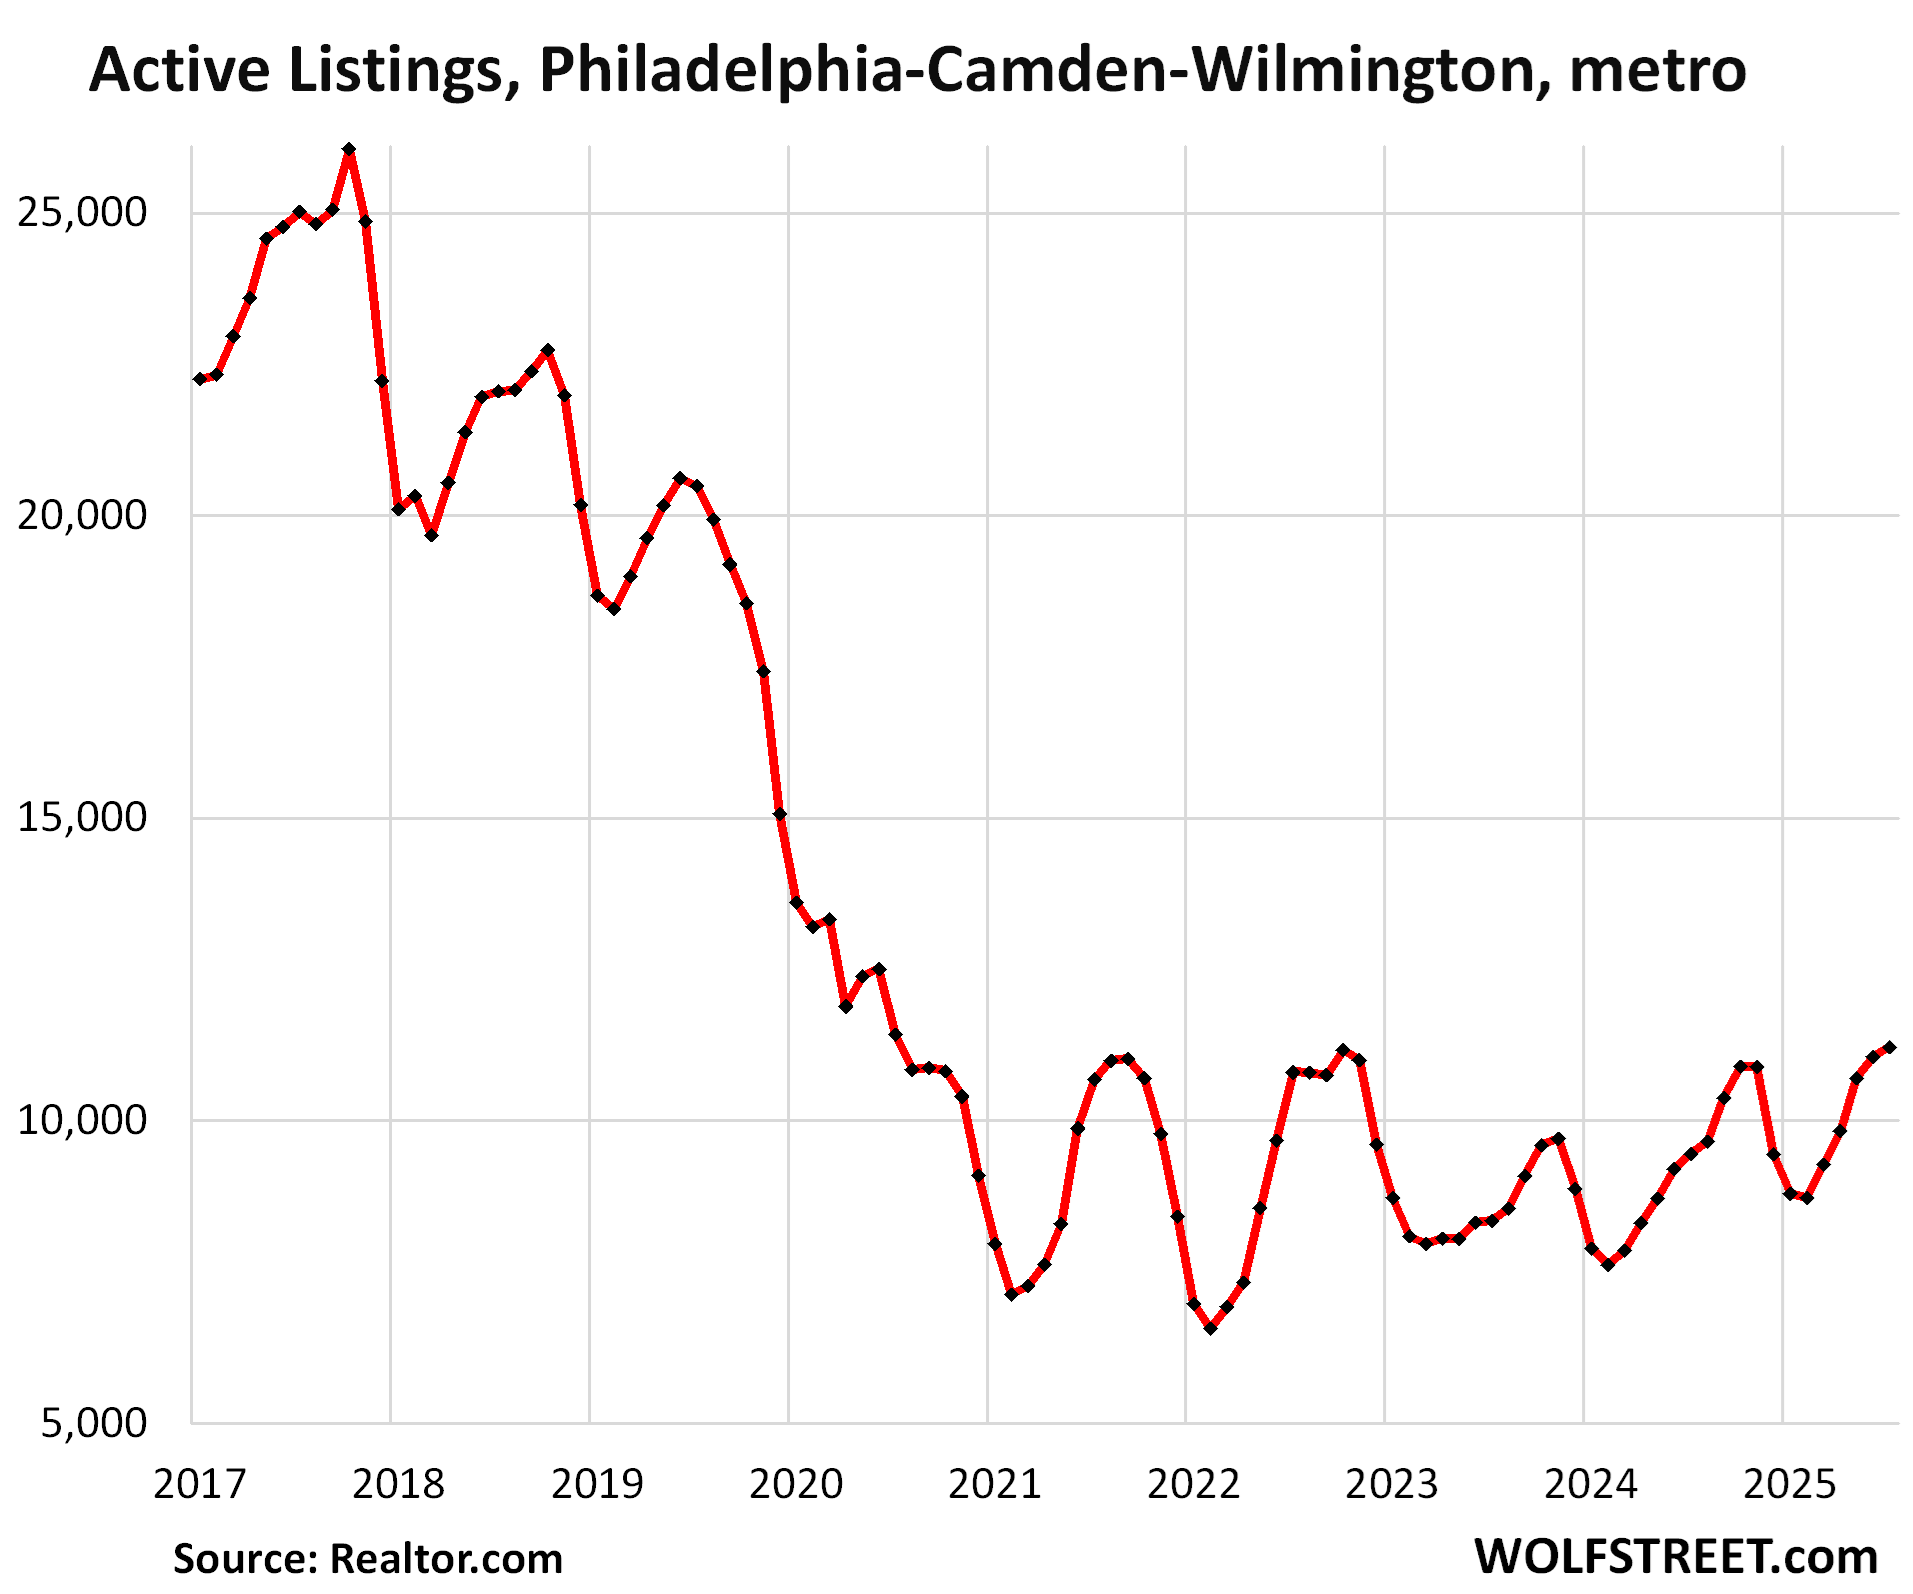
In the Philadelphia-Camden-Wilmington metro, active listings jumped by 19% year-over-year and by 35% from July 2023 to 11,227 homes, roughly level with July 2020 and below the prior Julys going back to 2016.
Compared to July 2019, listings were down by 45%, and compared to July 2018, by 49%.
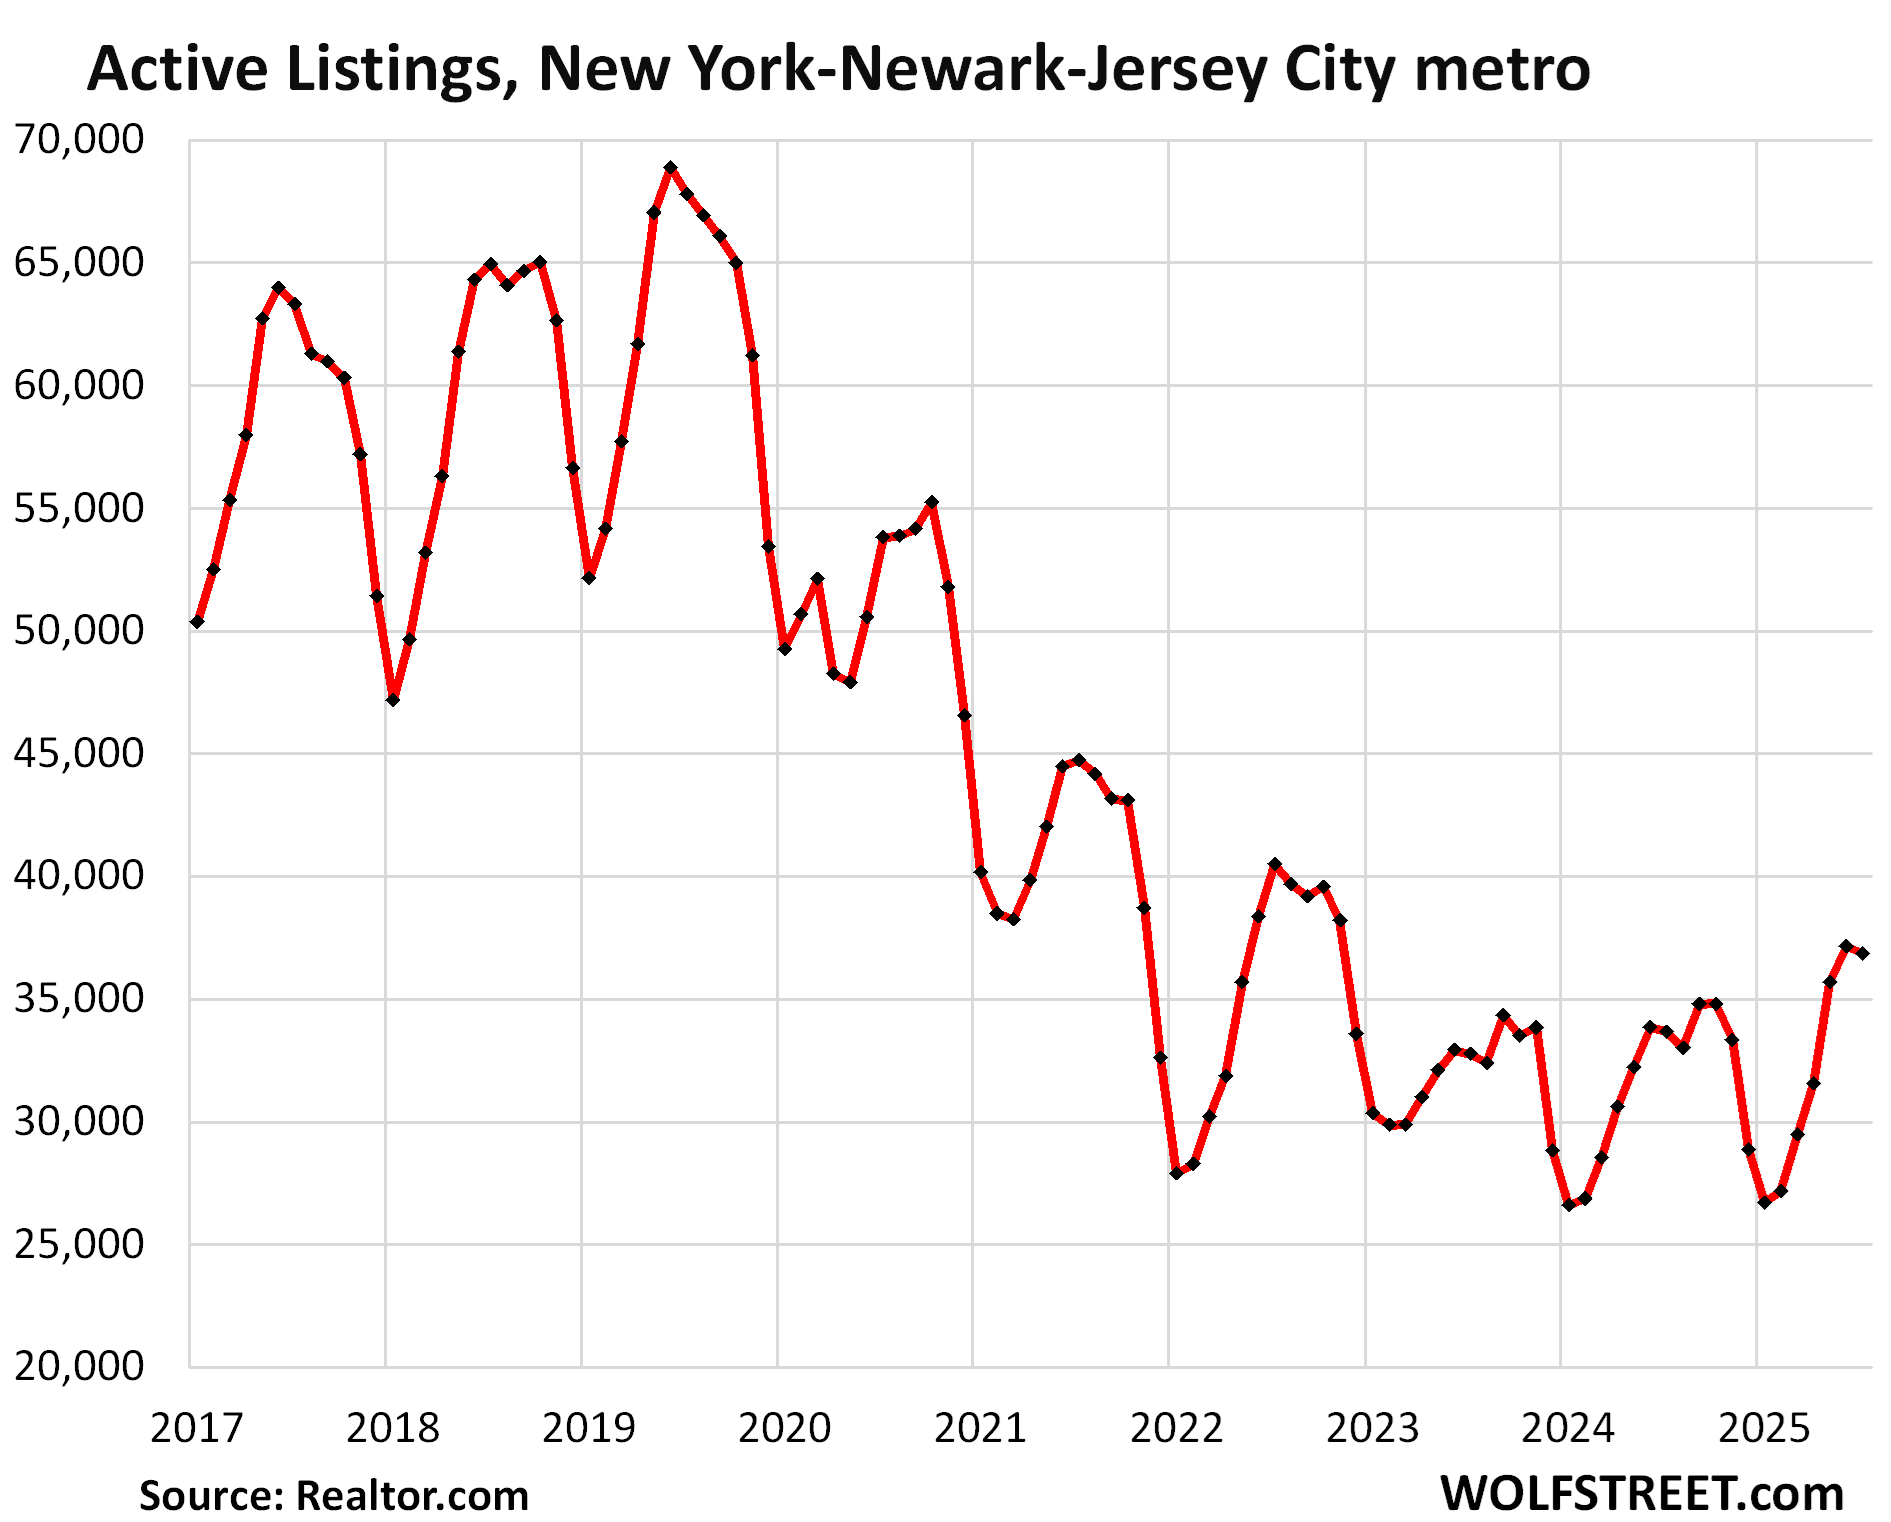
In the New York-Newark-Jersey City metro, active listings rose by 9% year-over-year and by 13% from July 2023 to 36,844 homes for sale, more than in July 2023 and 2024, but less than in any prior Julys in the data from Realtor.com which goes back to 2016.
Compared to July 2019, inventory is down by 46%, and compared to July 2018, by 43%.
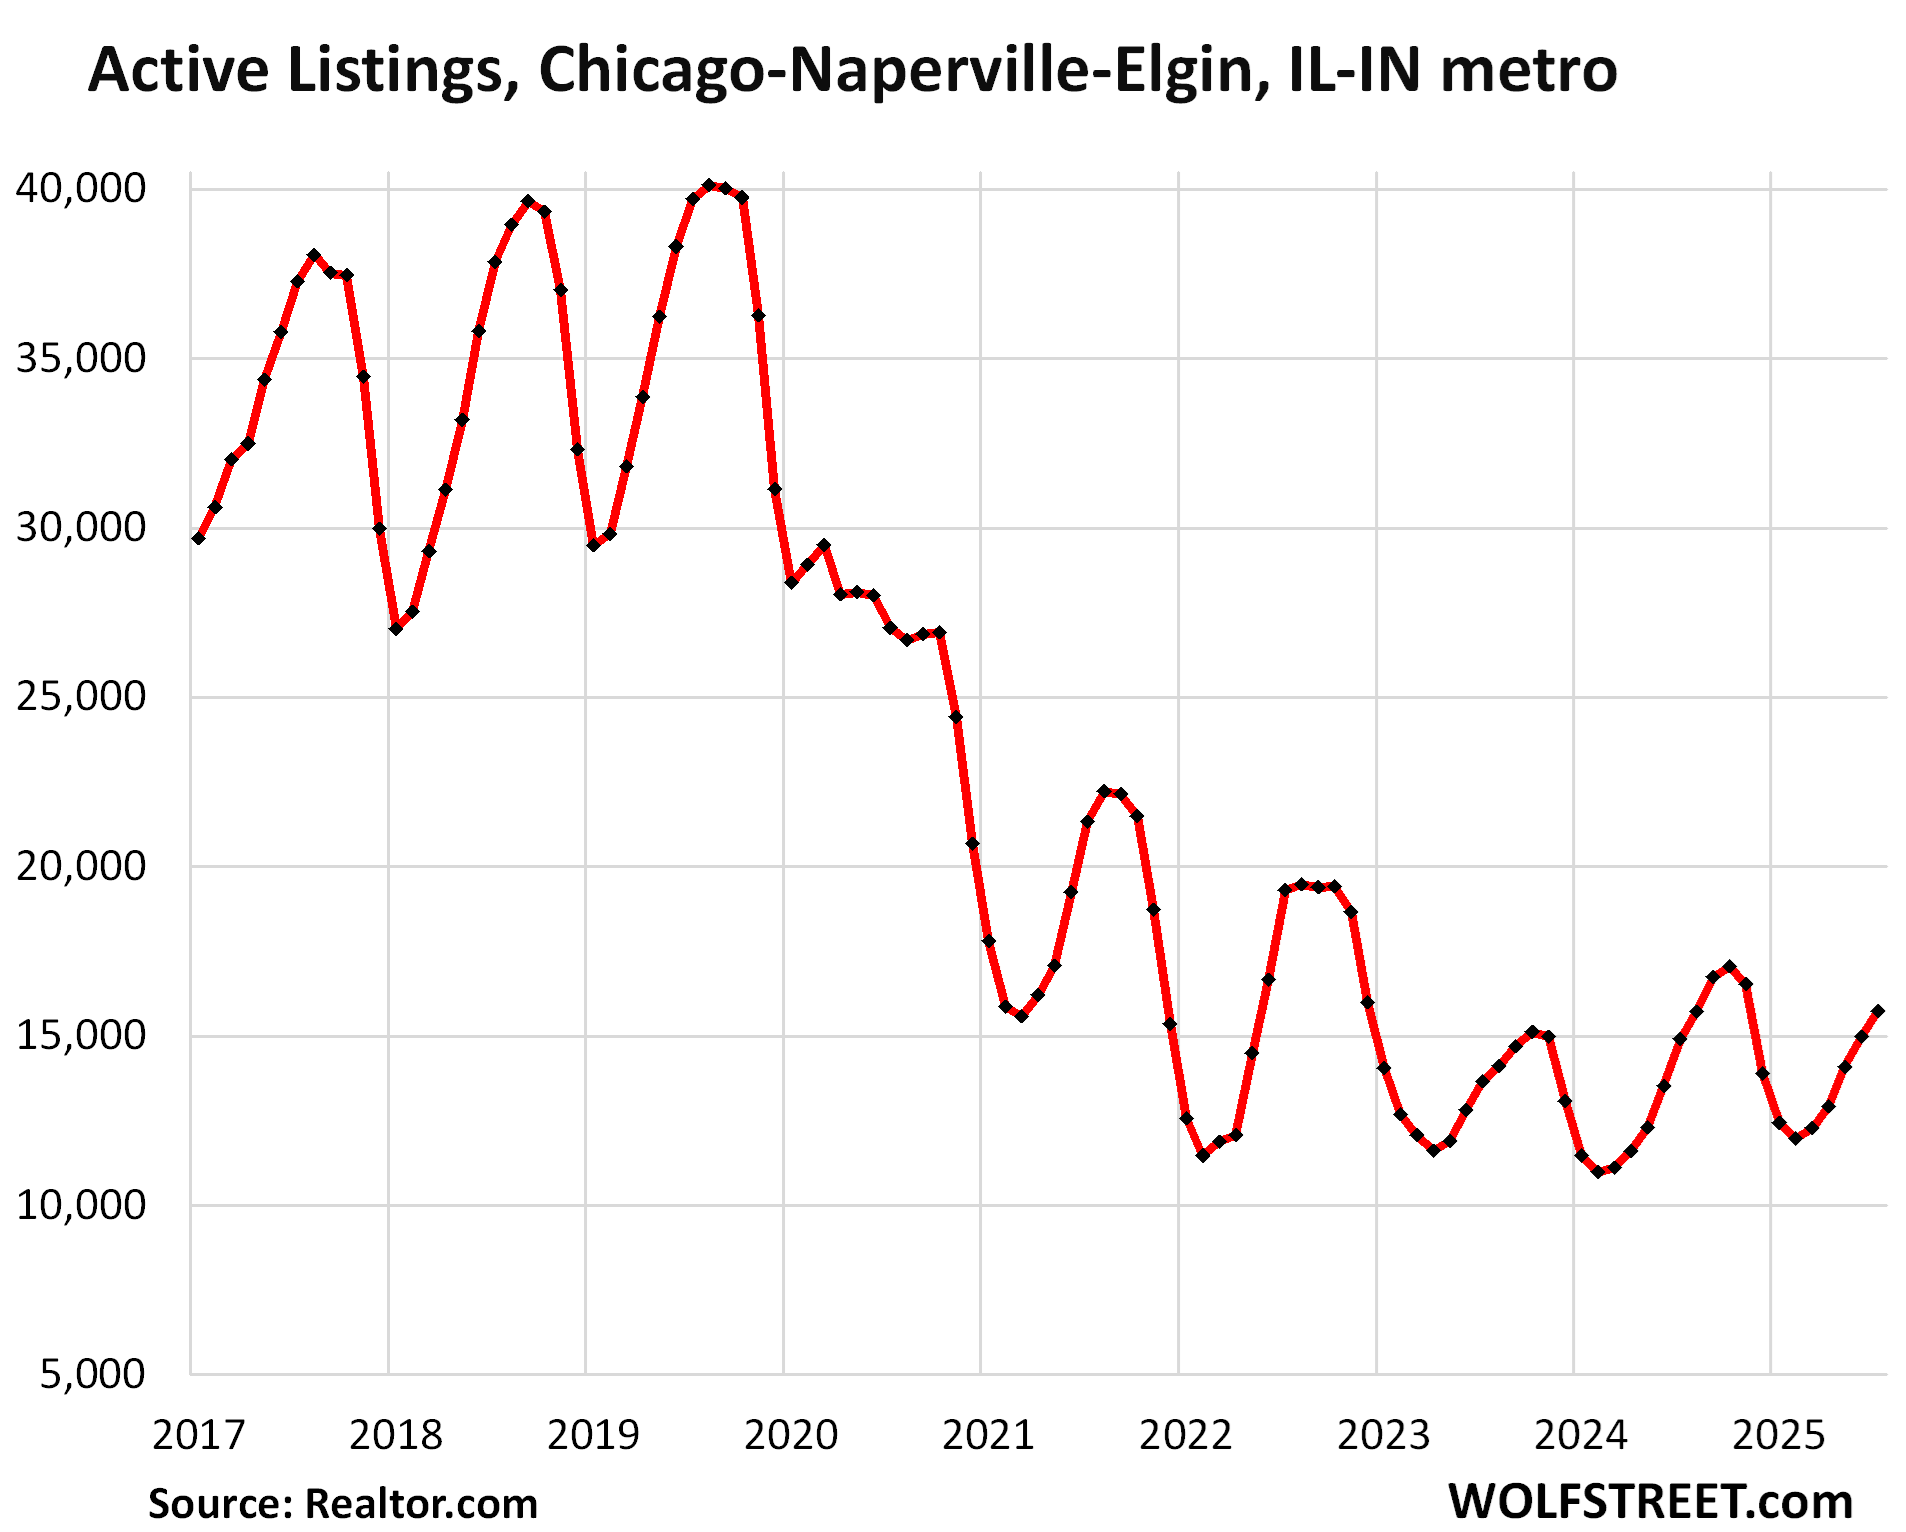
In the Chicago-Naperville-Elgin metro, active listings rose by 5% year-over-year and by 15% from July 2023, to 15,717 homes, well below the prior Julys.
Compared to July 2019, listings were down by 60%, and compared to July 2018, by 58%.
The seasonal highs are roughly in September and October. Chicago’s drummer hasn’t gotten out of bed yet.
Enjoy reading WOLF STREET and want to support it? You can donate. I appreciate it immensely. Click on the mug to find out how:

![]()
“The inventory of homes for sale in the Nashville metro spike to a new decade high in July. The inventory increases in the metros of Atlanta, Washington DC, and Columbus brought levels back into the normal-ish range that prevailed in the years before the pandemic. Inventory in the Boston metro has come up a lot, by 61% in two years, but remains well below the pre-pandemic levels”
Translation and prediction on what we will see across here and on Reddit
Folks in Atlanta, Washington DC and Columbus…”Oh maybe the market is slowing down but maybe there are still people buying….this shall pass or not”
Folks in Boston…”Nope not in my neighborhood, homes selling in less than a min and lines are out the door overbidding..”
Howdy Folks. What a fantastic ride this has been. Youngins should be amazed as the RE future unfolds. Fun to ride this out here at Wolfstreet.
THANKS Lone Wolf. No other place like your website.
Thanks WR.
Now the time has come for the prices to drop so that people can afford homes as shelter.
I was just talking with a colleague today that is trying to sell his place. He was stating that its priced very reasonable and doesn’t understand why it isn’t selling. So, I asked him what we do when a car sits on the lot a long time and doesn’t sell. His response…..”we lower the price until it sells”. Nice guy, but he couldn’t put two and two together. This seller entitlement is so deep it obscures reason. Eventually peoples hands will be forced and reality will settle in.
Cars on dealer lot cost money while houses on the market cost nothing. Owners can afford to wait.
The carrying costs of a home are far greater than the carrying costs of a car.
Yes, by orders of magnitude.
Homes /should/ be a depreciating asset given how much of a money pit they are…
Absolutely true, especially when one owns a vacant home languishing for sale, after the owner was transferred or moved to a new location and now is making 2 mortgage paym,anets .. one to keep roof over his/her head, the other, hoping someday to sell at 2021 price.
Definitely more homes getting listed in my neighborhood on Long Island. When we were buying last summer it was our home and one around the corner that were listed.
This summer Ive counted 7 so far….out of those only one looks like it needs a complete gut. The rest have been somewhat tastefully renovated over the years and will prolly sell quickly.
How do delistings affect these chart. You could have high delistings with low actives – still signalling a downtrend?
So delistings take homes off the market, and they reduce inventory, much like a sale would, except a delisting likely means a relisting in the near-ish future. So then you have this shadow inventory out there on top of the regular inventory.
Right Wolf. Delistings come back on market eventually. In a way they are still on the market as agents know it didn’t sell and may reach out if there is a buyer looking at the area.
Wolf could be a pilot in a jumbo jet that got hit by a (flying projectile) from a military plane and was in a major Mayday situation and Wolf would announce over the intercom “Keep calm, passengers, this is your captain, 👨✈️, we have some turbulence – such is the atmosphere. No reason to panic. If you can’t breathe, hold your breath until we land safely….oh…and that big hole in the side of the plane – not to worry, just enjoy the view and relax until Captain Wolf returns safely to terra firma.”……CRASH, BOOM!
That plane ride is today’s real estate disaster.
Are sales tracked indepent of whether or not homes appear on the MLS, or are sales based on MLS data? The skew in the data seems to be regional, and with a very sharp cliff. This leads me to ask myself questions, such as, “Has there been a regional change in selling practices, such as realtors switching to a pocket-listing black market in some areas, where (untracked) sales are still occurring but listings are not?” Surely there has not been some supernatural “Left Behind” type incident in some region where people have simply drkpped off the face of the earth. People have to live somewhere, whether as buyers or renters, so buying and rdnting activity can’t just magically”disappear”.
1. So, just to clarify, this is inventory, not sales.
2. The inventory is composed of the listing in the MLS. Pocket listings are on top of that.
3. In terms of your other questions, what is happening is that, AS ALWAYS, each real estate market is different. During the Housing Bust, the first markets keeled over in mid-2005, the last ones didn’t keel over until late 2007 (San Francisco). Some markets didn’t have a Housing Bust at all, such as those in Texas and Denver. Like I said, each market dances to a different drummer, and in some markets, the drummer hasn’t gotten out of bed yet.
Low Buyer demand is REAL. My last 3 sales have had almost no showings. Human nature to ask for it all and only time will convince the seller IT’S THE PRICE. When I was a young agent in 2008 I would lose these listings only to have another agent re-list the home at a much lower price. Once the “Housing Shortage” narrative is gone and replaced by “Price Declines” we should see a lot more listings from sellers with FOMO.
I wonder if having had the largest crash in ’08, those places panic first, and the urge to get out might be much larger than other places that did not have the great crash.
It does seem that there is some correlation. Now, it will be interesting to see if these slower places catch up this time, or if their stability is real.
I bet on catch up, as it sinks in over the next three years.
I think a lot of people are also waiting for the rate cut, which seems baked in the cake, in spite of data like we just saw, rising inflation.
It will come down to jobs. Those areas with good jobs can withstand a lot of turbulence. Those markets that are speculative will likely suffer the most.
Austin has lot of high paying jobs but still down 20 plus percent from peak abs going down.
The real problem is.. home prices went up like crazy in the last free years due to fed suppressing mortgage rates.
Now at 6 percent plus homes are still priced like 3 percent rates.
Something has to give in… either the rates go back to 3 percent or prices decline or everyone gets a big pay raise .
Correct. Out here in my slice of flyover, the kids are choosing new over existing. I do not recall a year were our work was skewed so heavily towards new construction.
There is no rate cut ‘baked in’ at all and if the Federal Reserve does cut its overnight short term interest rates then it is likely long term rates including mortgage interest rates will rise by a corresponding percentage which is exactly what happened the last time the Fed cut by 100 basis points.
Pirates would say:
Arghhhh People be sellin’!
So what you’re saying is there’s still room for inventory to creep up. I don’t usually see charts for Minneapolis-Saint Paul, thanks for including my metro Wolf!
The markets that are holding up have less new home construction to compete with. The Texas and Florida markets have had considerable new home construction in the last 5 years and so there is more inventory.
Even the market with less new homes are suffering because of high unaffordability.
Case in point is California
The trough happened because of Fed-repressed 3 percent mortgage rates. But the Fed only controls the short term rates, not the longer term rates. I’m still trying to understand how the mortgage rates got so low during this period. Because they also bought MBS? Because the banks are stupid? Because of Fanny and Freddy? In any case, this is a disaster for many and a windfall for some.
The Fed bought trillions of dollars of MBS and Treasury notes and bonds, which created huge demand for those longer-term securities, pushed up their prices, and thereby pushed down longer-term yields. They were the relentless bid in the bond market. That was the official policy of the Fed at the time. 30-year mortgage rates roughly track the 10-year yield but are higher.
Banks didn’t care. They sold those mortgages to the government which guaranteed them, securitized them into MBS, and sold them to the Fed and investors. And banks collected their fees.
All this has been super-well documented for five years. I don’t understand why there’s still a question about that.
Golden handcuffs are real – nobody selling a 2.5% mortgage.
Howdy Peter. I loved the ” Golden Handcuffs ” term. Those silly prisoners had no idea how Govern ment tricked them with ZIRP.
What about Job losses, divorces, deaths? All of these still happen. Additionally, I have seen a big percentage of the homes on the market right now in my area that were bought during the low rate period. I also experienced many of the people who had FOMO bidding 100-200K above asking so at the end of the day the rate isn’t nearly as important as the monthly payment. For those that over-extended themselves at the low rate (as far as payment is concerned) they are in a bind regardless of what interest rate they have.
Wow! Thanks WR! I think the faltering Intel plant in Columbus, Ohio, is going to cause a lot of damage. The area built up for it. Google, Facebook, HP, etc started to move assets to the area. Now it’s all in limbo. The home prices are still crazy in C-bus.
Wolf, I very much appreciate the charts and information you provide. Thank you.
For this to be truly meaningful, it would be nice if the included the run up to the 2007-2009 recession. I think charts from 2005 would be much more instructive to understand what is going on now as it would show the run up in inventory that these don’t include. they are helpful and I don’t mean to sound ungrateful.