Austin, Oakland, New Orleans, San Francisco, Birmingham, Washington DC, Fort Myers, Denver, Portland, and Phoenix.
By Wolf Richter for WOLF STREET.
Different housing markets don’t move in lockstep, except when money is free and FOMO reigns. And when the free money washed over the land from 2020 into 2022, in form of mortgage rates far below the rate of inflation, prices exploded in all markets together in near-lockstep. But this has ended, and in many markets, prices have begun to sag.
So here are 10 bigger cities where prices of single-family homes have declined more seriously, seasonally adjusted, after the gigantic price explosion over the prior few years. Of these 10 cities, 8 have double-digit price declines for single-family homes from their peaks in mid-2022 through June. The remaining 2 have declines of 9% from their peaks:
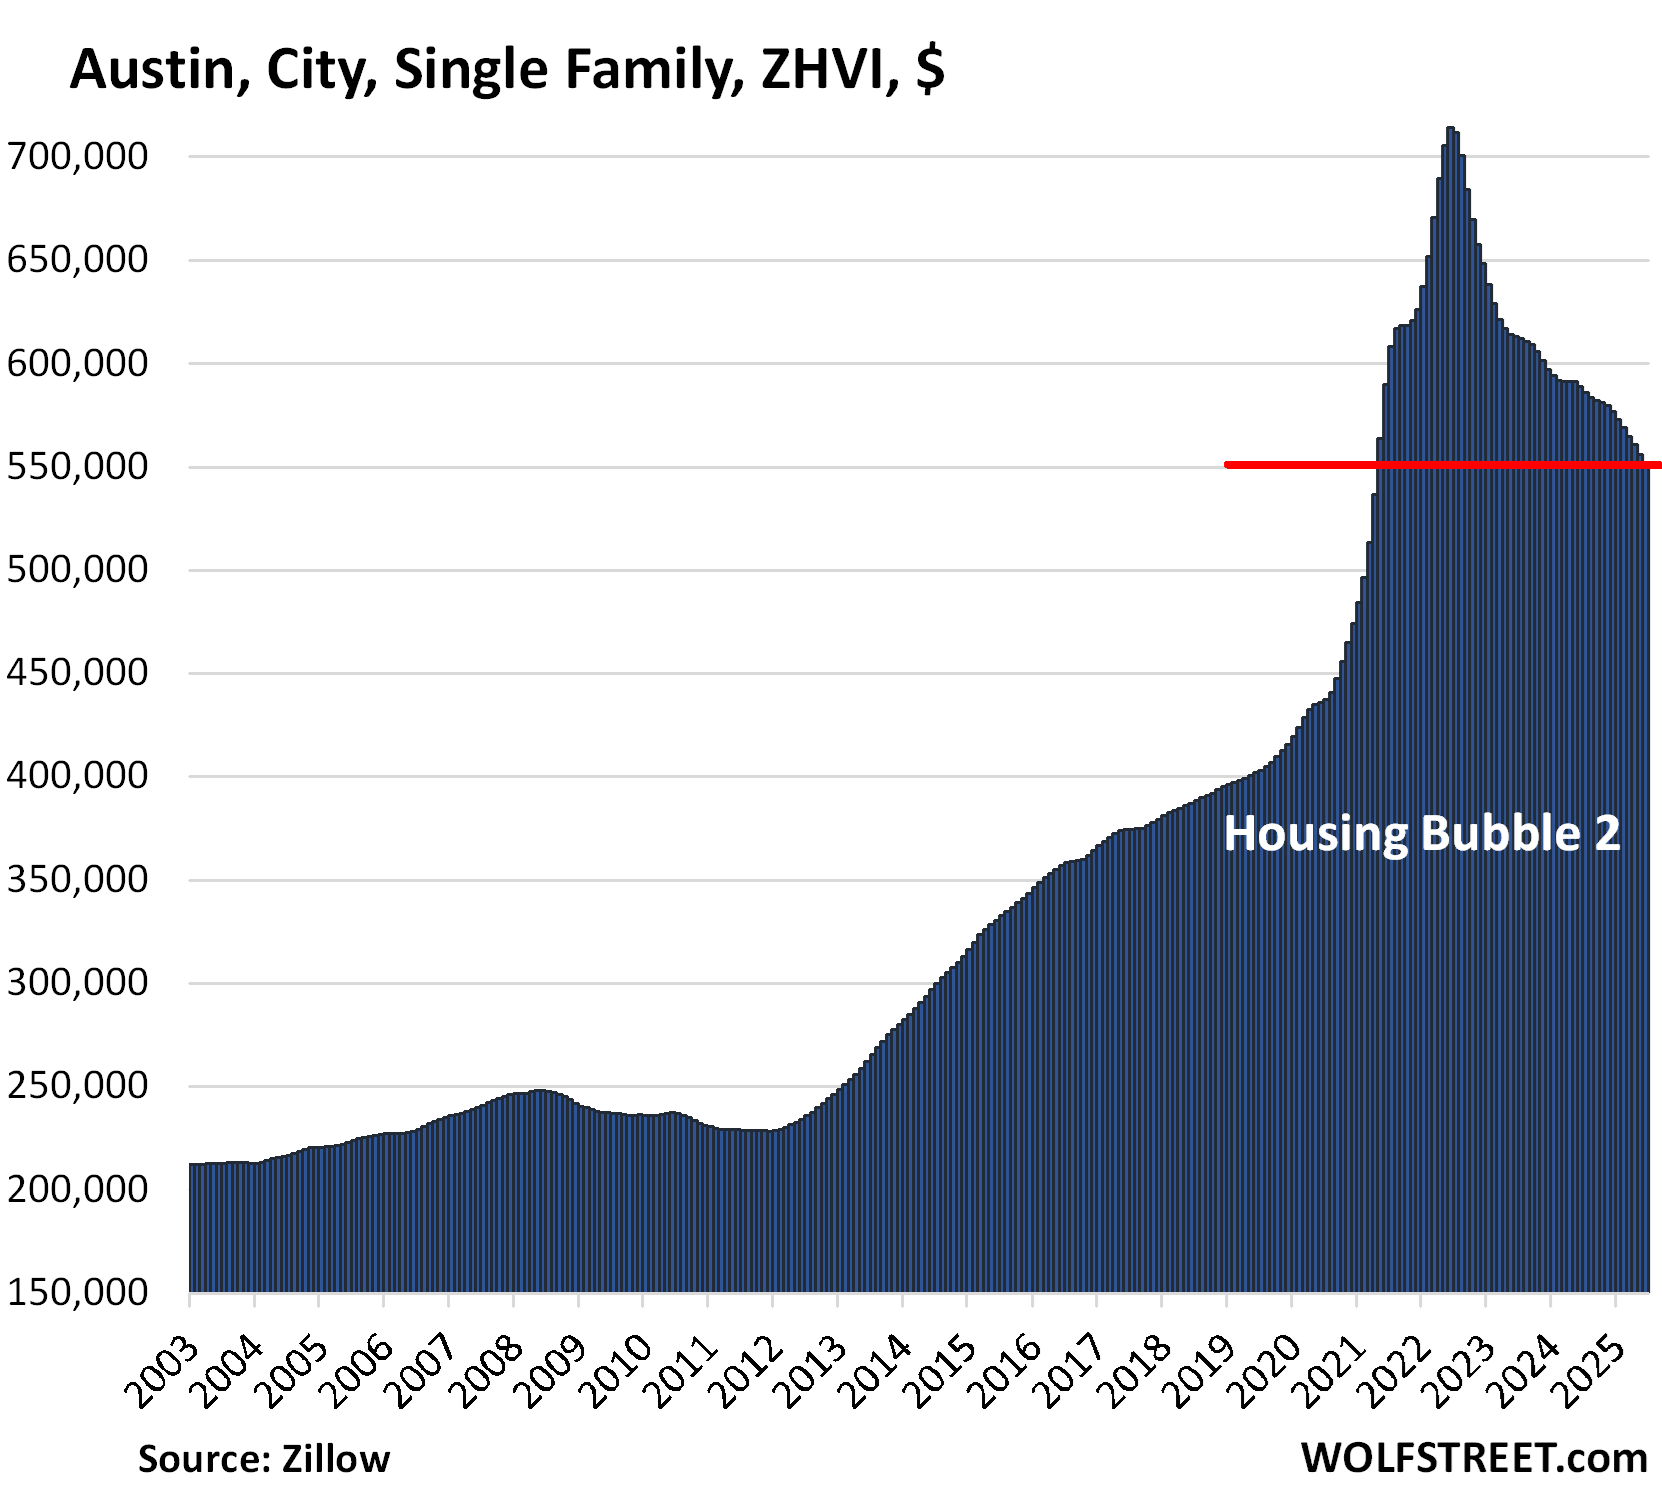
- Austin, TX: -23%
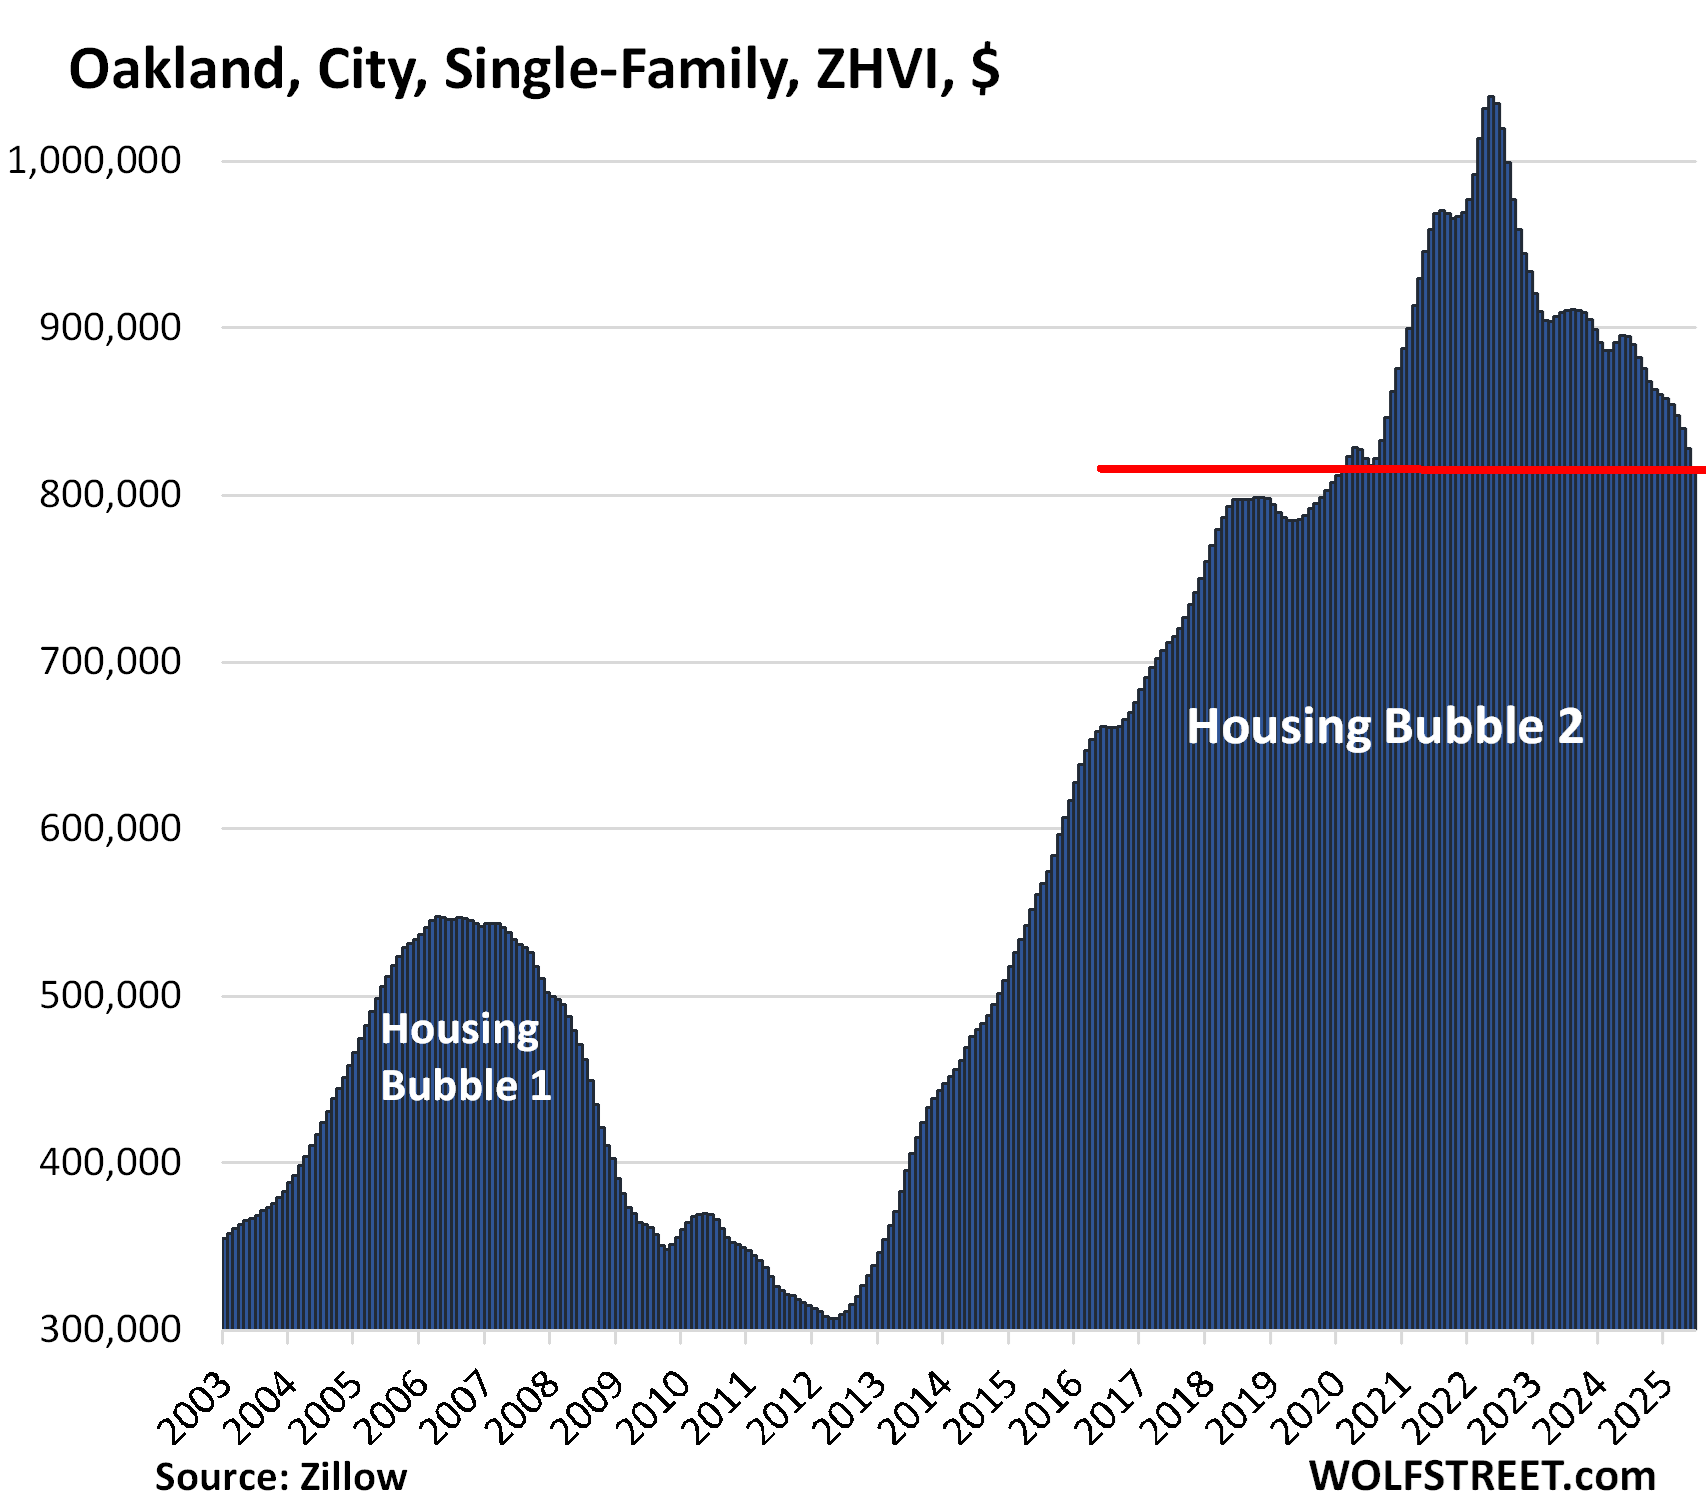
- Oakland, CA: -22%
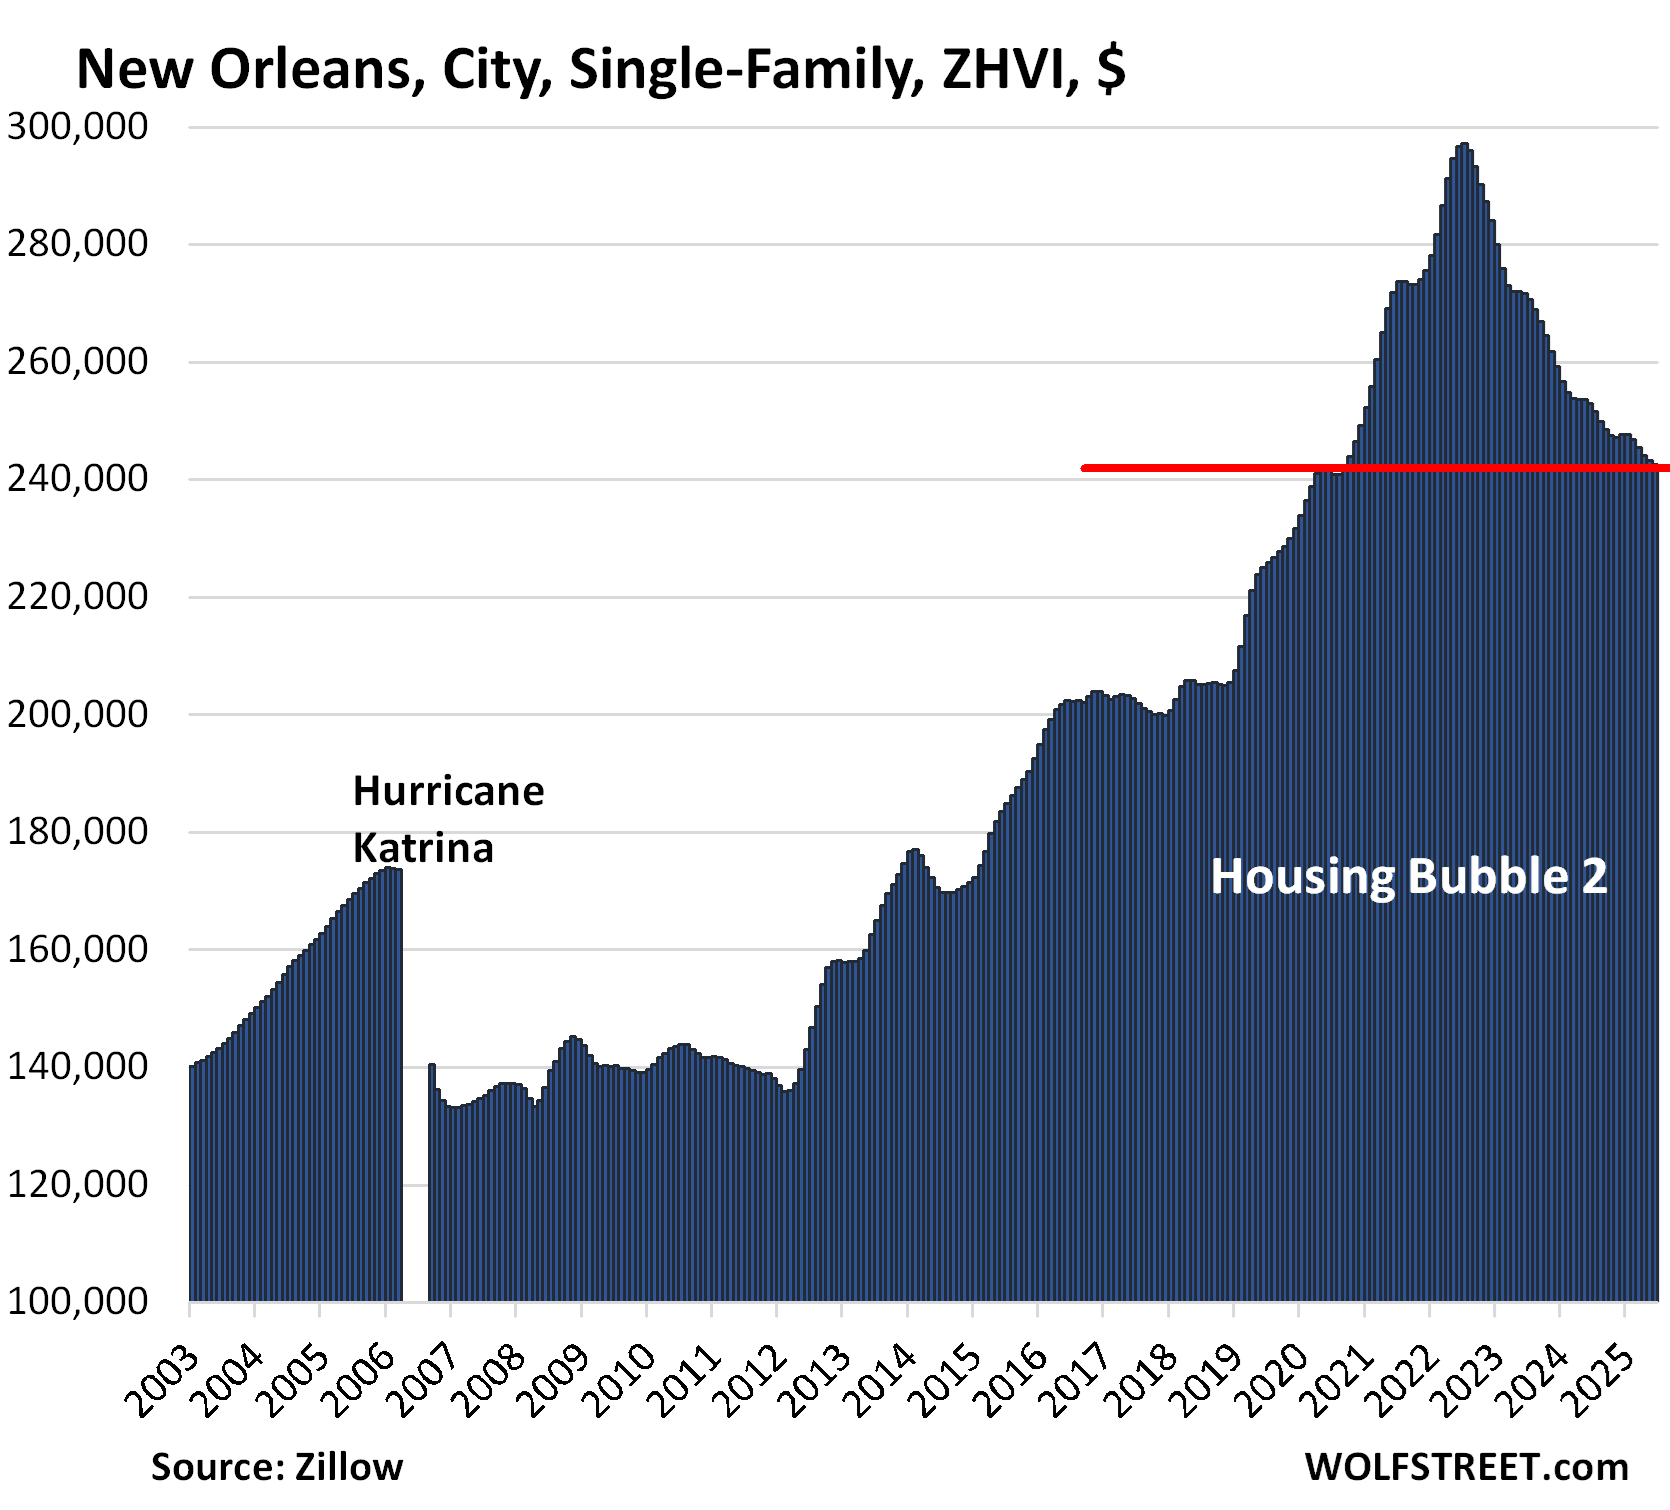
- New Orleans: -18%
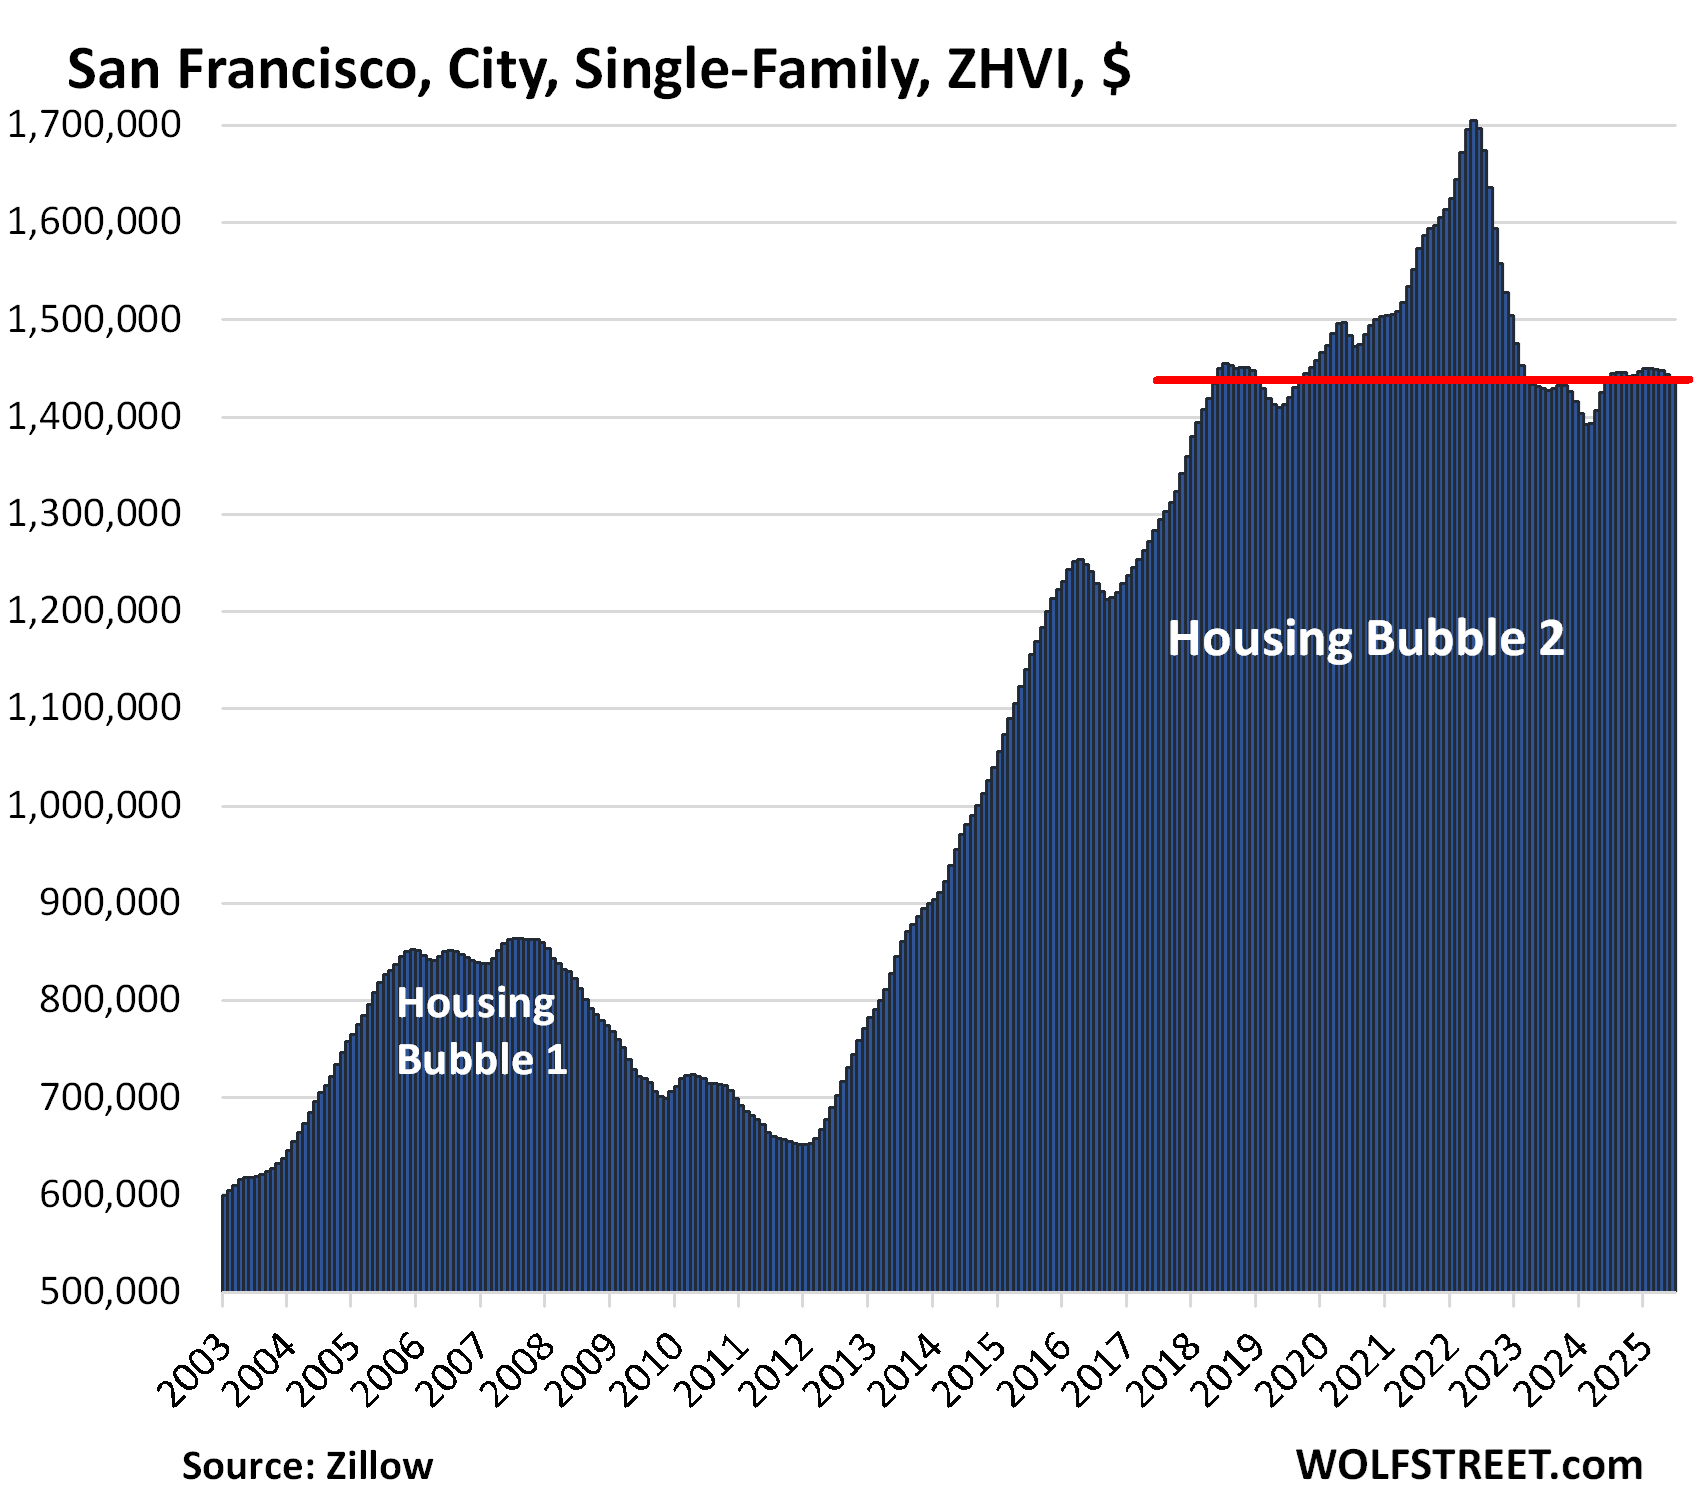
- San Francisco, CA: -16%
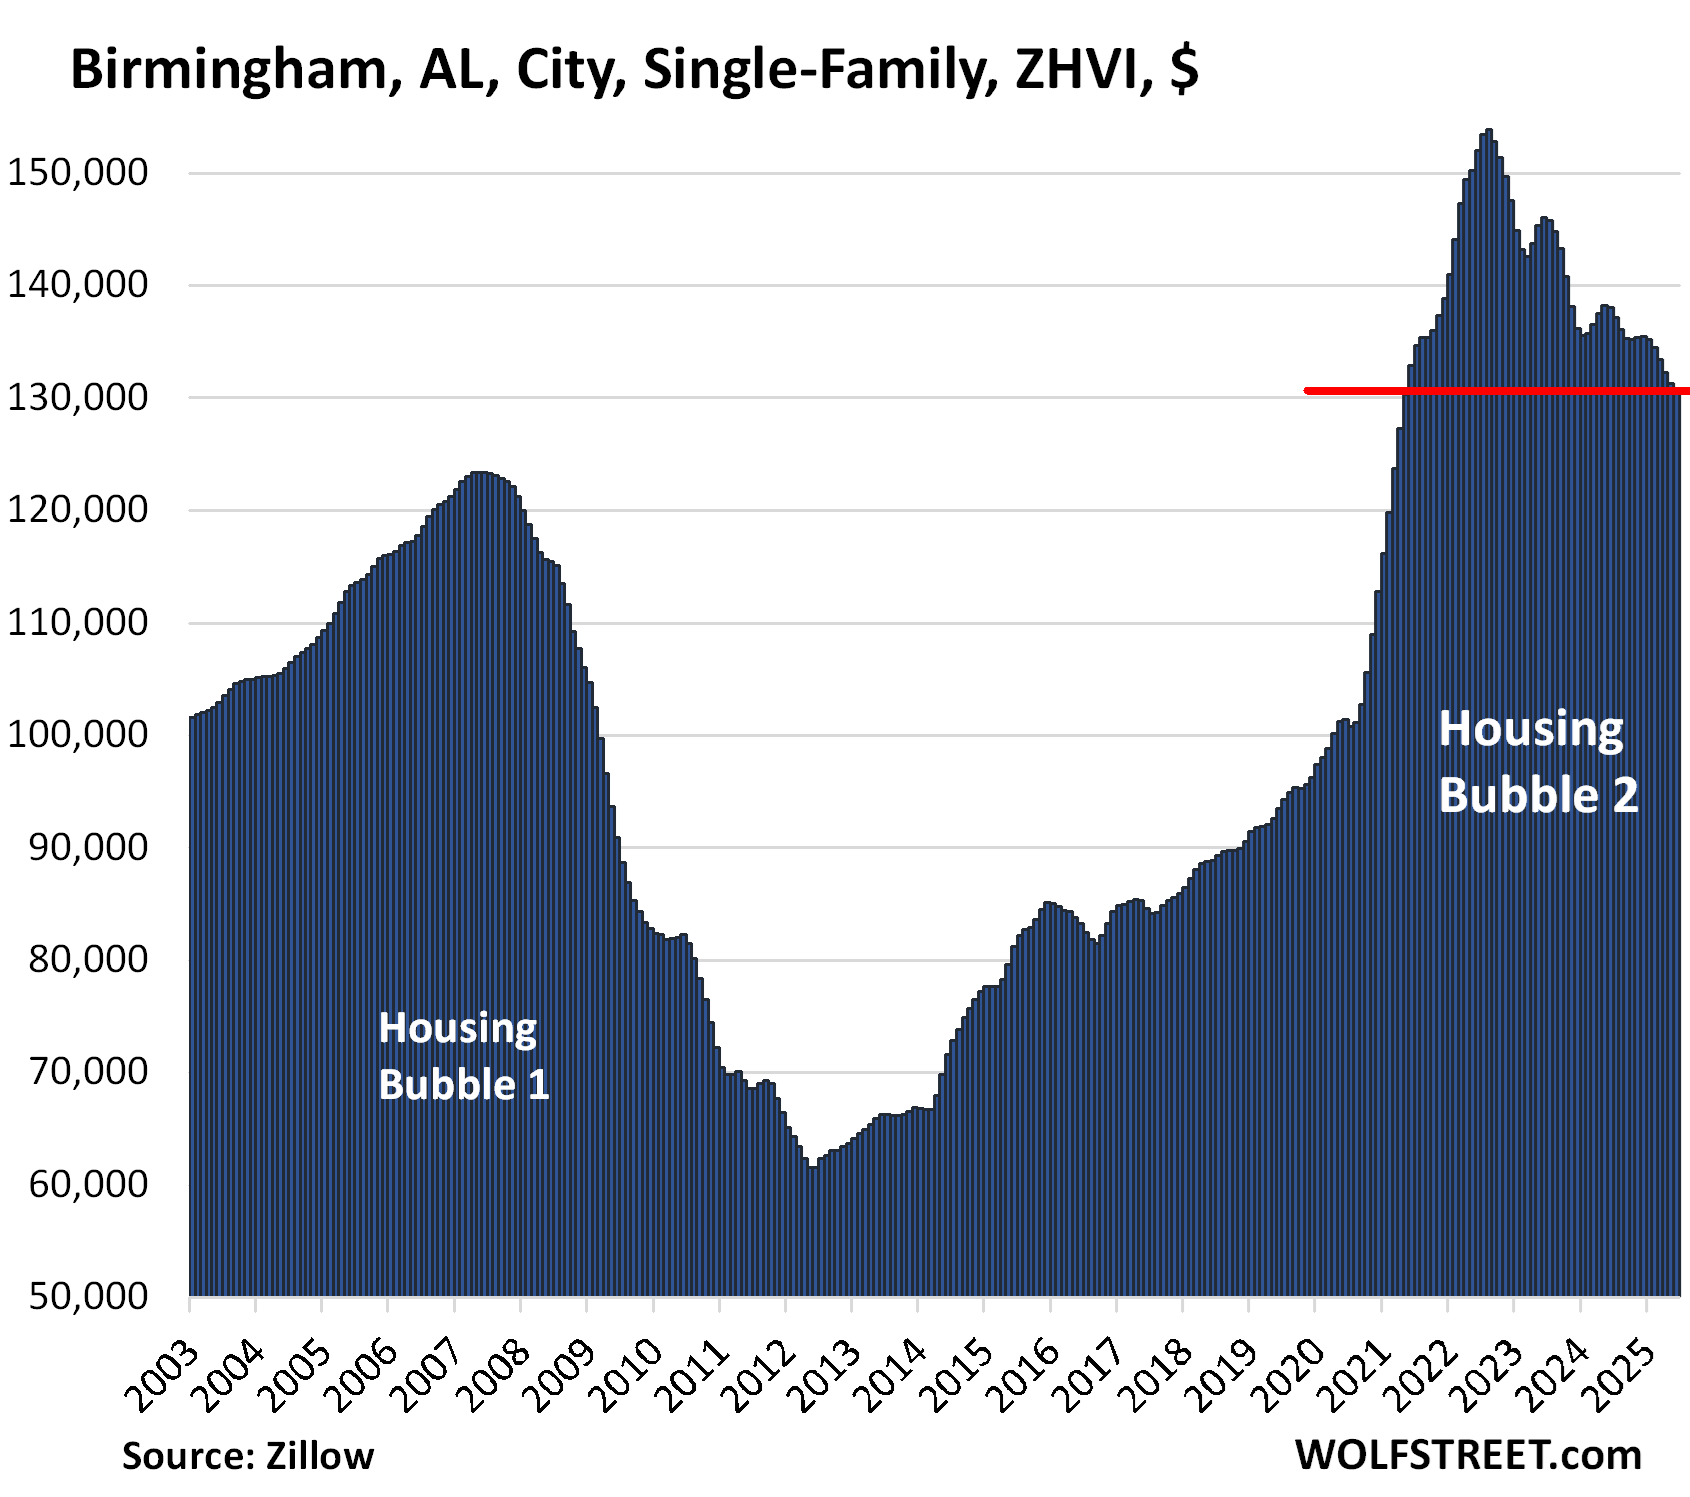
- Birmingham, AL: -15%
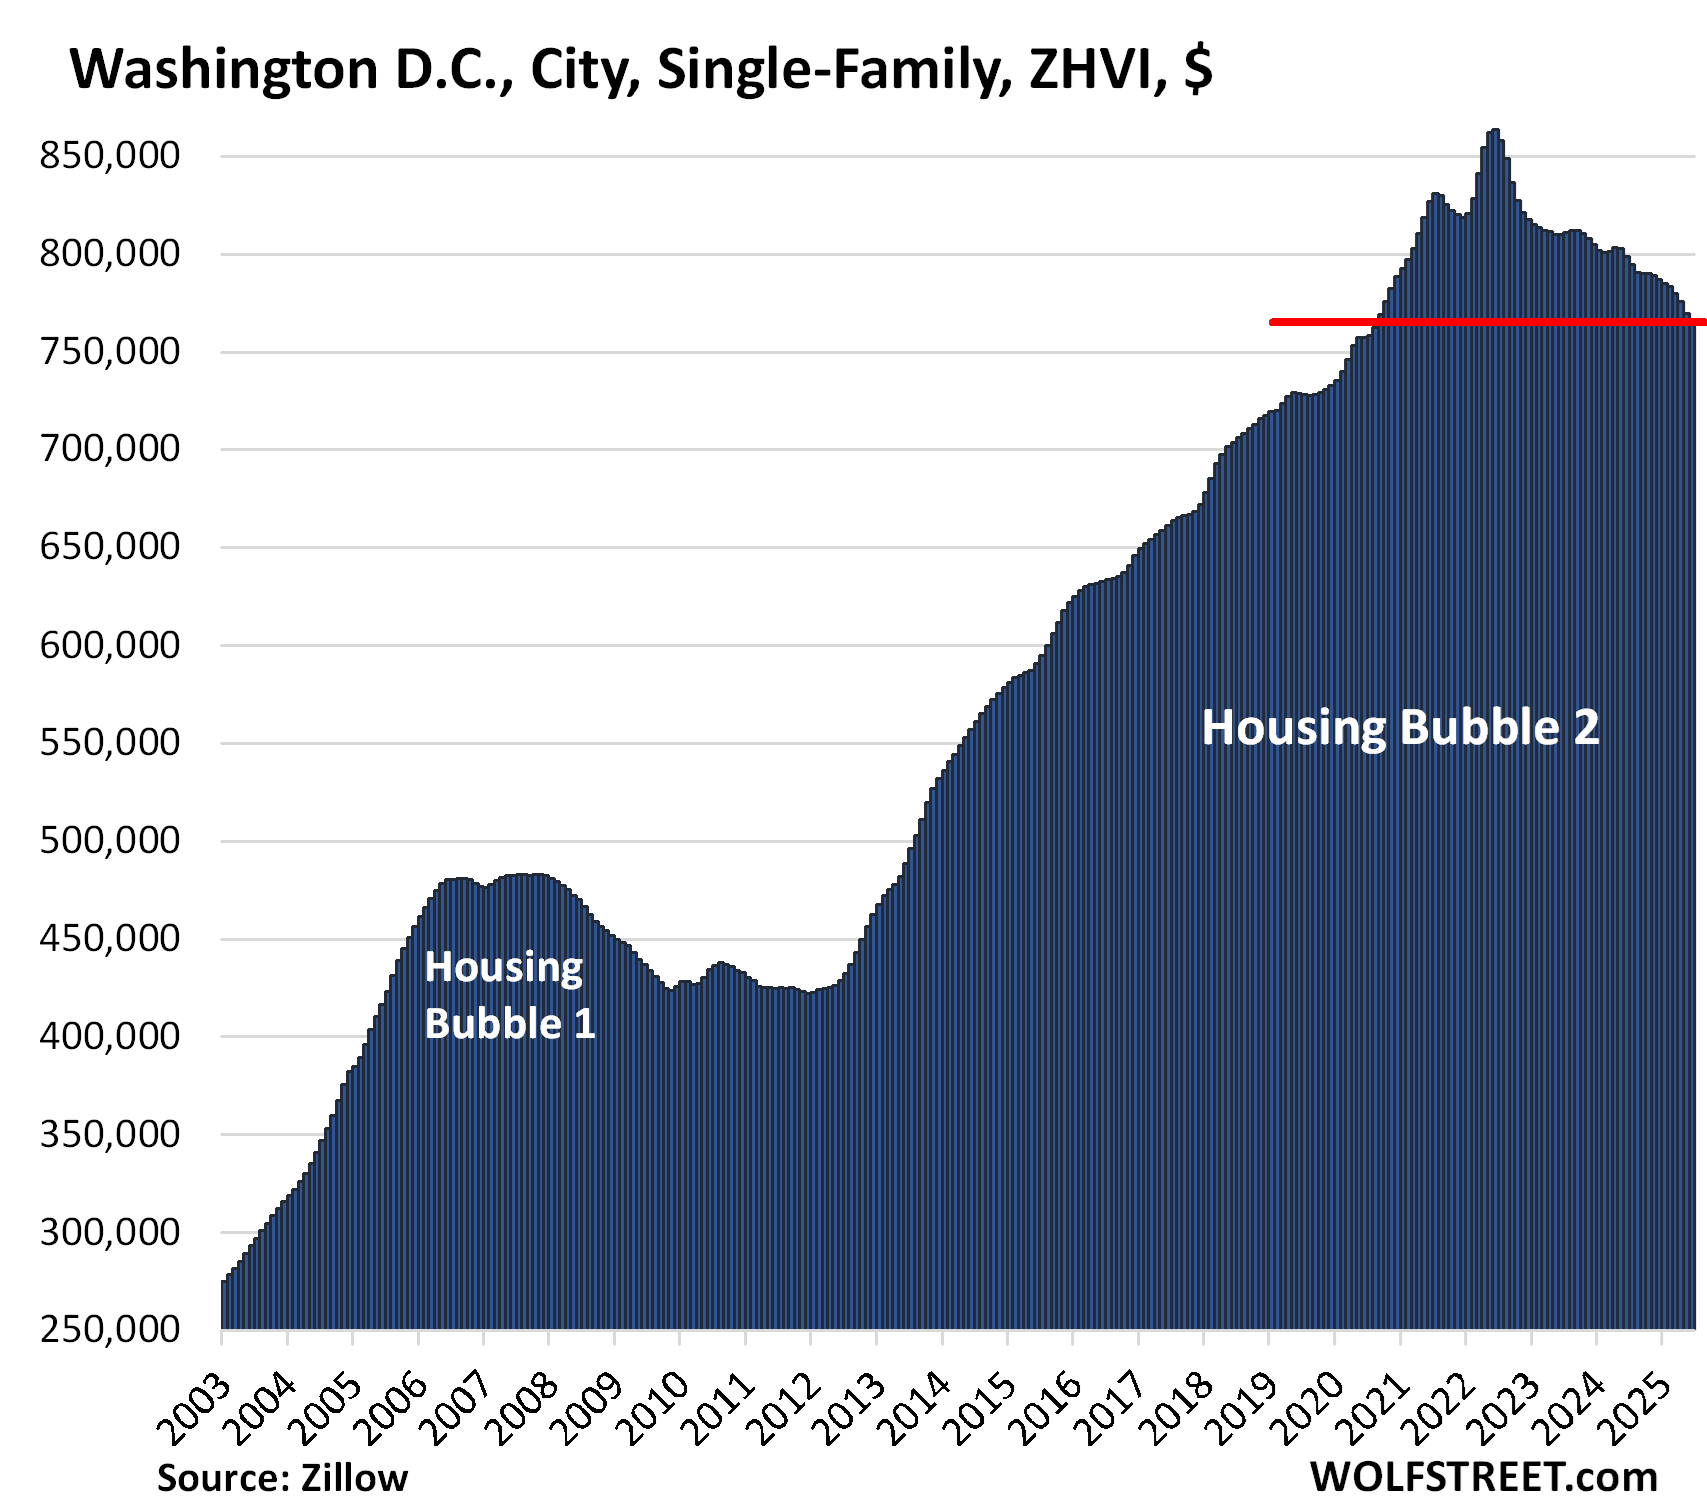
- Washington, DC: -12%
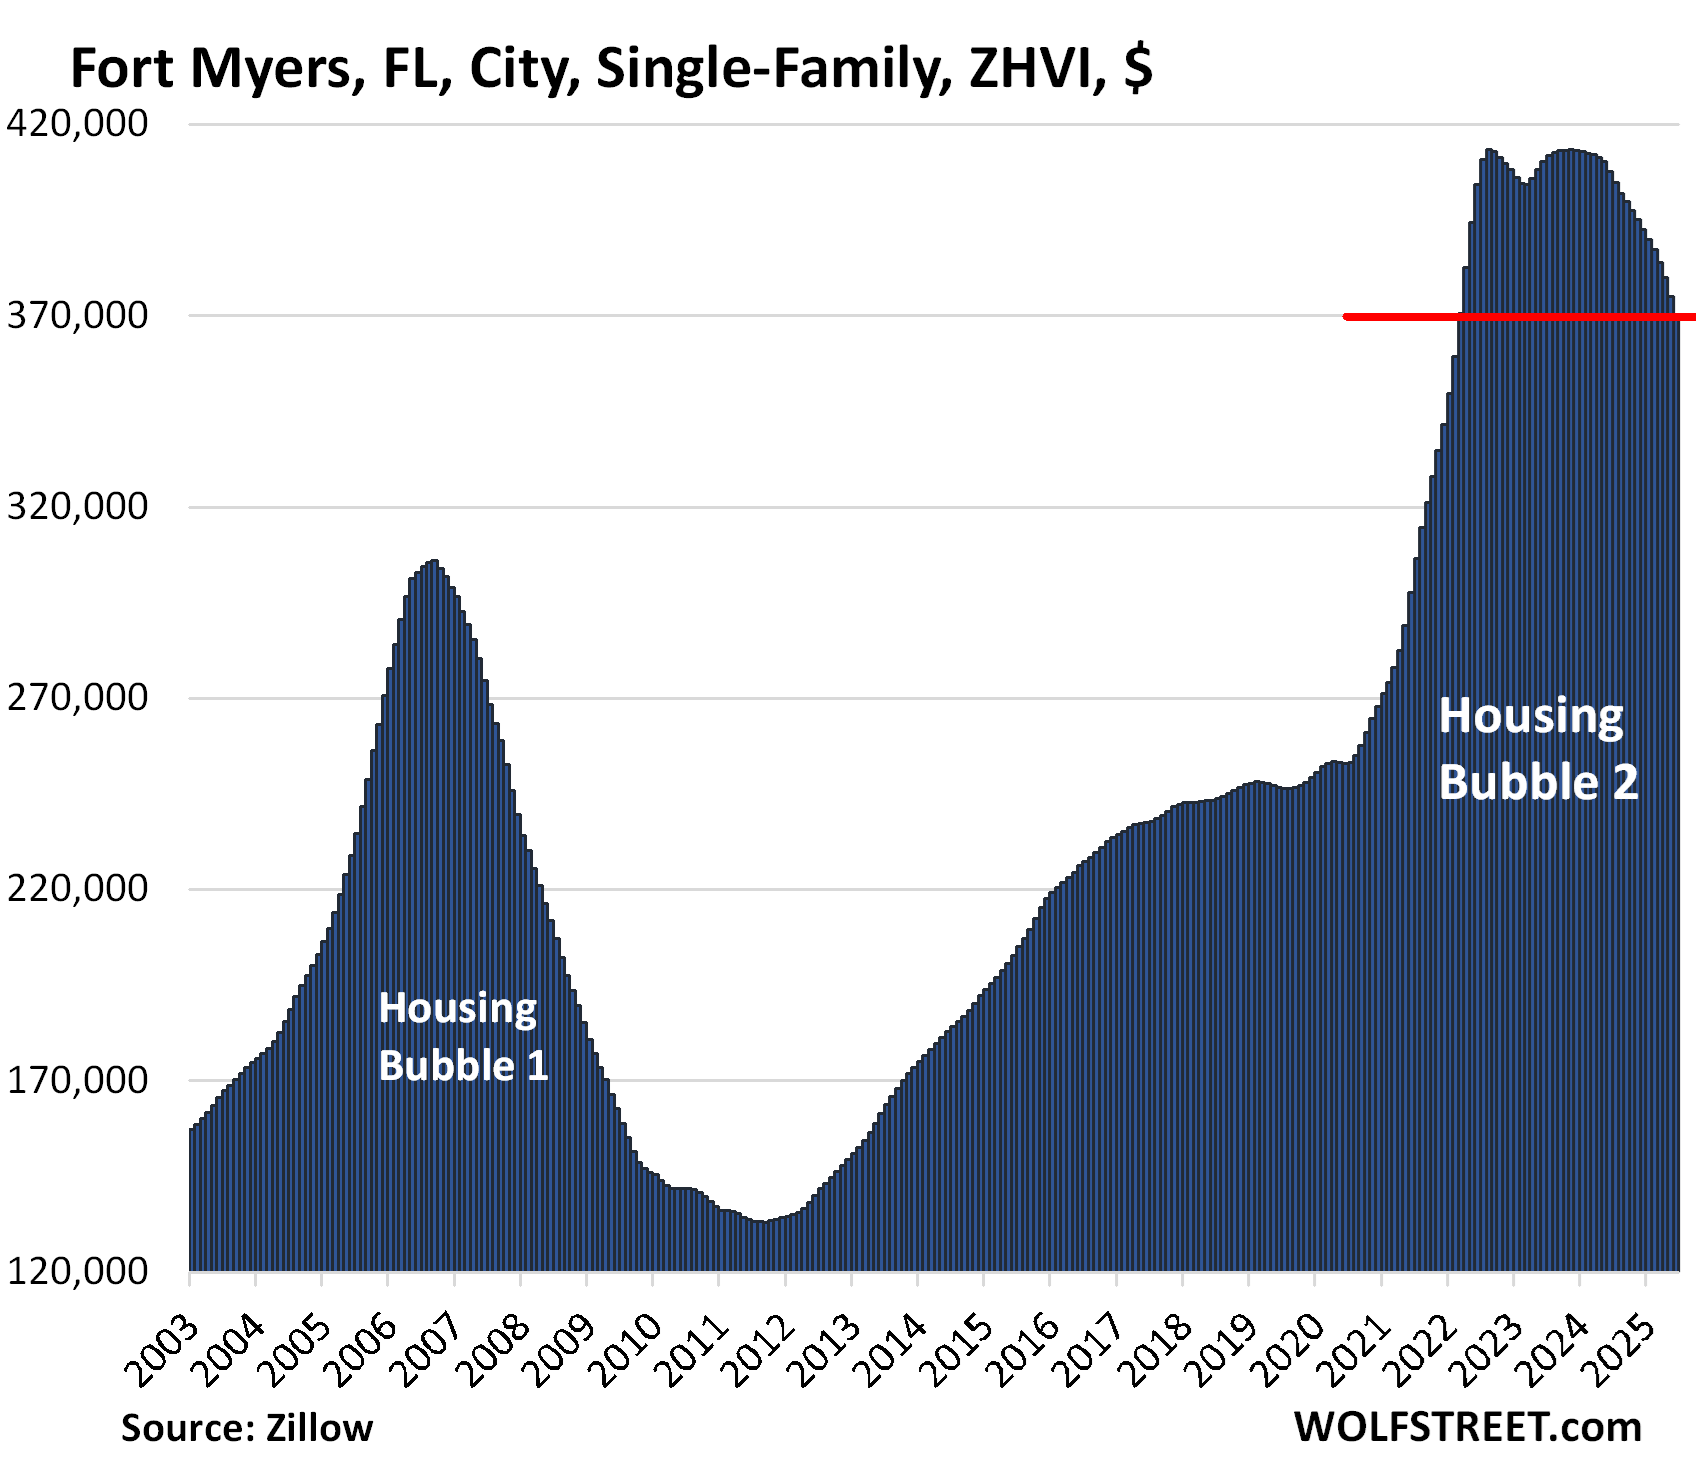
- Fort Myers, FL: -10%
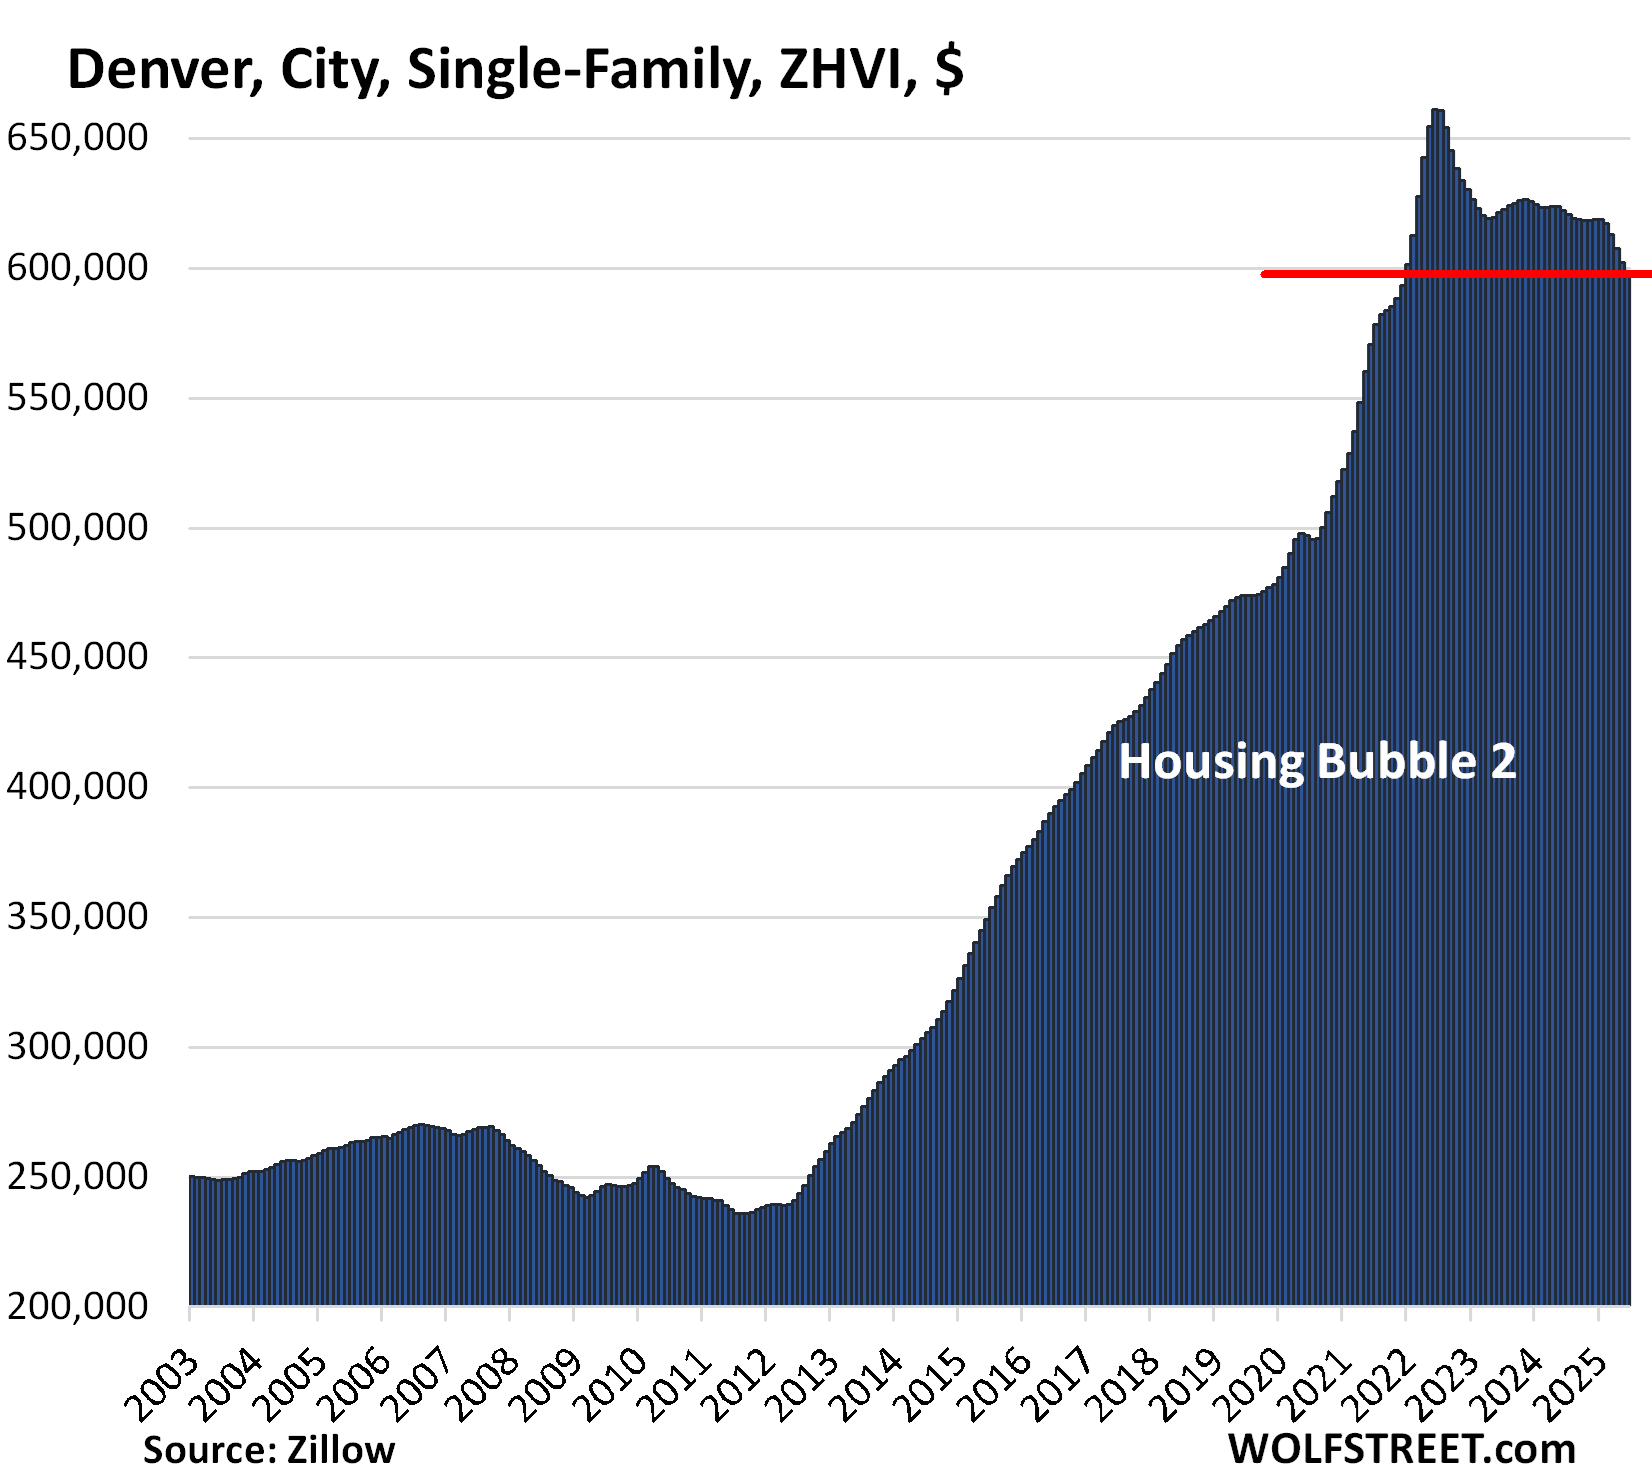
- Denver, CO: -10%
- Portland, OR: -9%
- Phoenix, AZ: -9%
Month-over-month, single-family home prices declined in all of these cities in June, topped off by Oakland (-1.6%) and Fort Myers (-1.4%).
And year-over-year, prices declined in all 10 cities in June, topped off by Fort Myers (-9.2%) and Oakland (-8.9%).
But condo prices are well ahead on that slippery slope: The 19 Bigger Cities with the Biggest Price Declines of Condos (-12% to -24% from Peak through June)
These prices here are seasonally adjusted three-month moving averages of “mid-tier” single-family homes in “cities” (not in Metropolitan Statistical Areas, or metros, which are much larger). The values are from the Zillow Home Value Index (ZHVI), which is based on millions of data points in Zillow’s “Database of All Homes,” including from public records (tax data), MLS, brokerages, local Realtor Associations, real-estate agents, and households across the US. It includes pricing data for off-market deals and for-sale-by-owner deals. These are not median prices.
The 10 Bigger Cities with the biggest price declines.
The metrics in each table from left to right: price decline from the peak, month-over-month change (MoM), year-over-year change (YoY), and increase since January 2000.
| Austin, City, Single-Family Home Prices | |||
| From Jun 2022 peak | MoM | YoY | Since 2000 |
| -23% | -0.9% | -6.4% | 170% |
Prices exploded by 64% in two years on the way up. But they’re taking their goodly time on the way down. They’re now back where they’d first been in May 2021, having undone in 36 months what they’d done in 14 months. Easy does it.
| Oakland, City, Single-Family Home Prices | |||
| From May 2022 peak | MoM | YoY | Since 2000 |
| -22% | -1.6% | -8.9% | 291% |
Note the month-to-month plunge of 1.6%, which followed the 1.4% plunge in May (seasonally adjusted three-month average!). This is fast! Prices are back to February 2020.
In the decade between mid-2012 and the peak in May 2022, prices had exploded by 236%.
| New Orleans, City, Single-Family Home Prices | |||
| From Jun 2022 peak | MoM | YoY | Since 2007 |
| -18% | -0.2% | -4.0% | 108% |
Back to September 2020.
| San Francisco, City, Single-Family Home Prices | |||
| From May 2022 peak | MoM | YoY | Since 2000 |
| -16% | -0.5% | -0.1% | 234% |
Prices are back to where they’d first been in May 2018. That was seven years ago.
Over the decade through mid-2022, prices exploded by 146%. But during the era of the price explosion from mid-2020 through mid-2022 in other markets, prices in San Francisco jumped “only” 14%, as some of the highly paid tech talent was leaving the city, and after prices had already shot up by 127% over the prior eight years to sky-high levels.
| Birmingham, AL, City, Single-Family Home Prices | |||
| From Jul 2022 peak | MoM | YoY | Since 2000 |
| -15% | -0.4% | -5.3% | 33% |
| Washington D.C., Single-Family Home Prices | |||
| From Jun 2022 peak | MoM | YoY | Since 2000 |
| -12% | -0.8% | -4.3% | 276% |
Back to August 2020.
| Fort Myers, City, Single-Family Home Prices | |||
| From Apr 2024 peak | MoM | YoY | Since 2000 |
| -10% | -1.4% | -9.2% | 199% |
Note the 9.2% year-over-year drop.
| Denver, City, Single-Family Home Prices | |||
| From Jun 2022 peak | MoM | YoY | Since 2000 |
| -10% | -0.8% | -4.0% | 215% |
Back to December 2021. In the decade through mid-2022, prices had spiked by 174%.
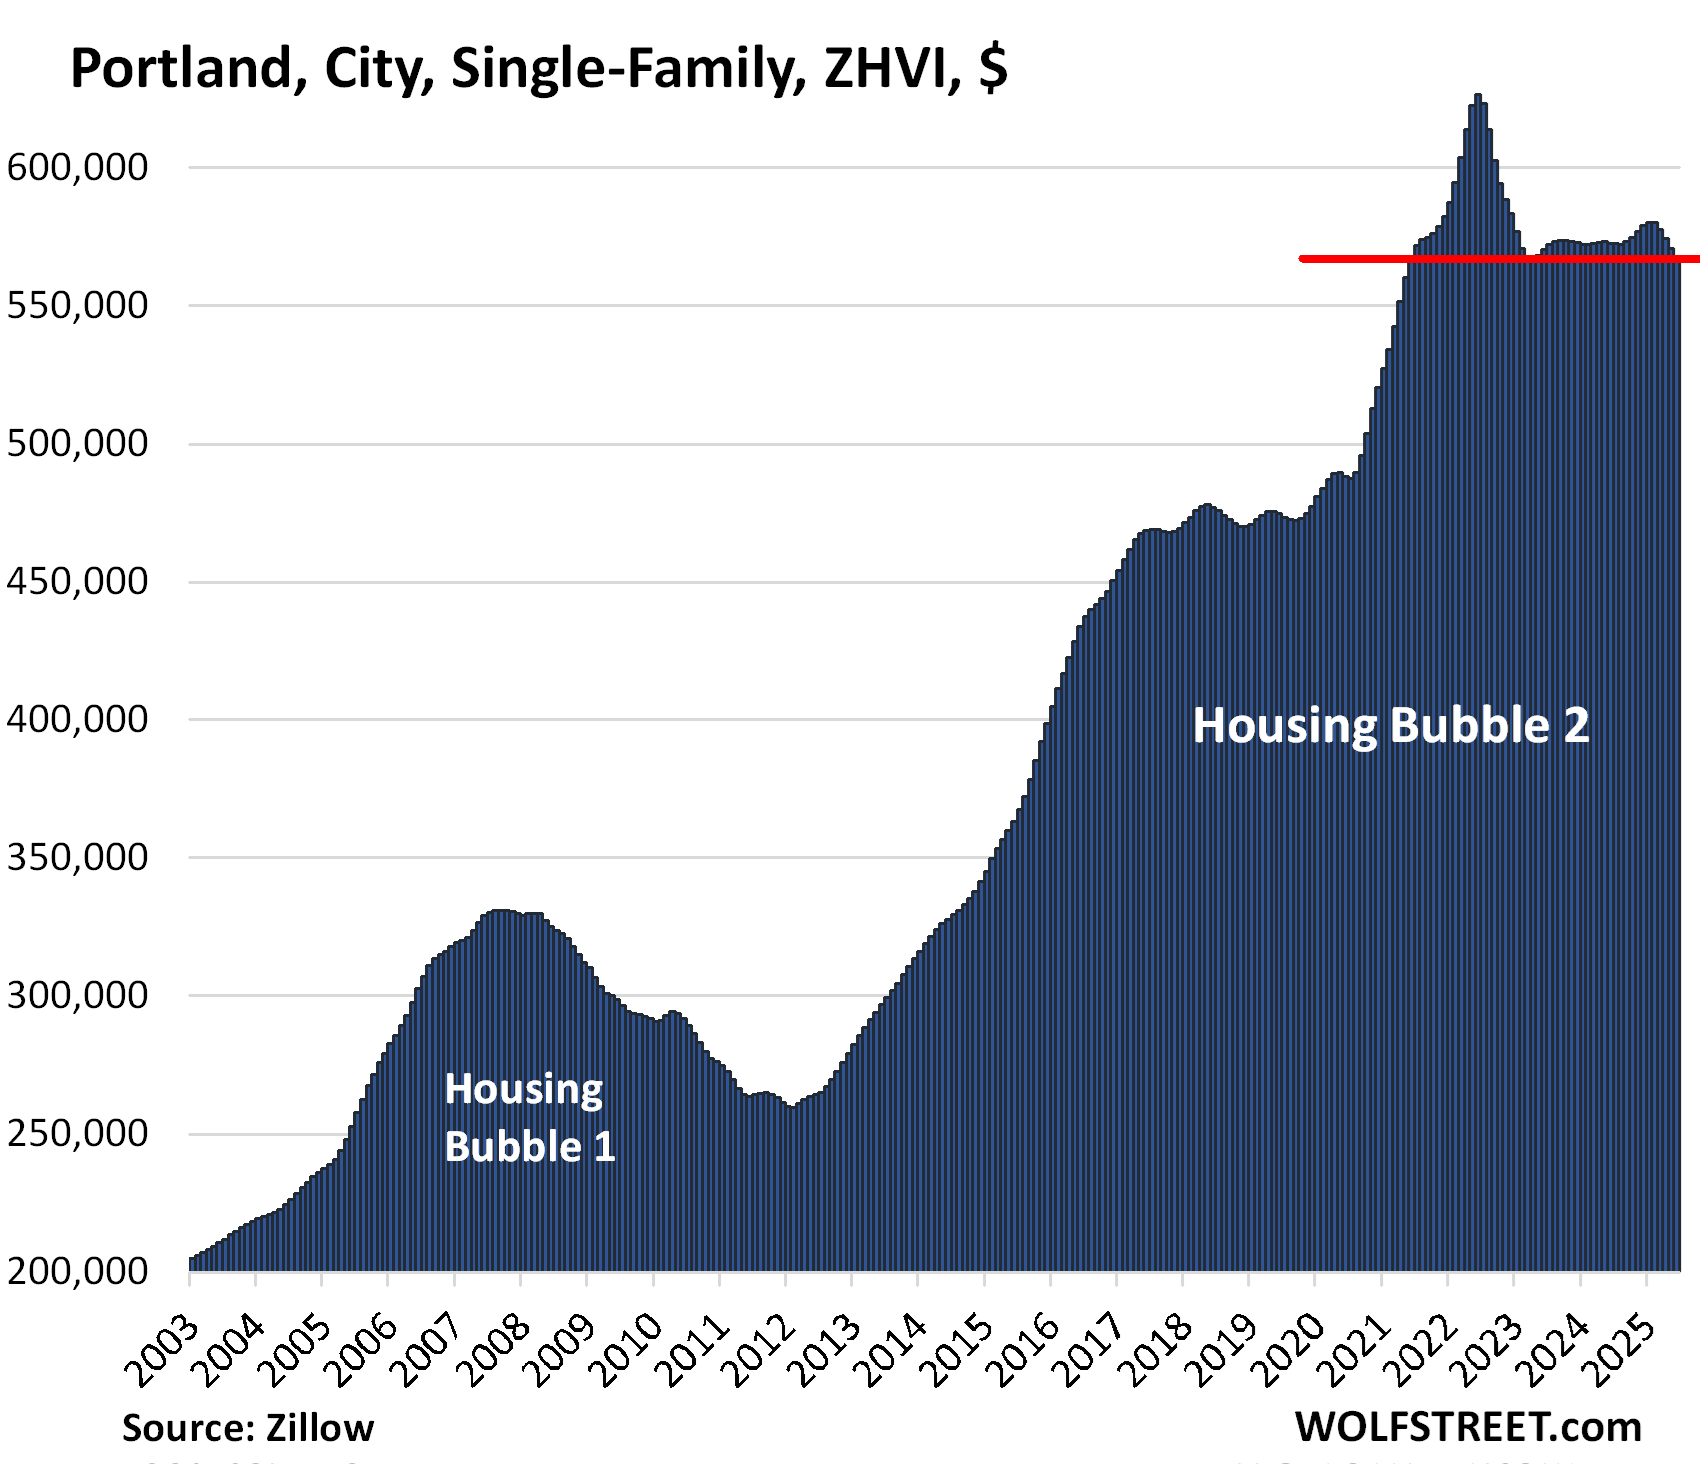
| Portland, City, Single-Family Home Prices | |||
| From May 2022 peak | MoM | YoY | Since 2000 |
| -9% | -0.5% | -0.8% | 223% |
Back to June 2021
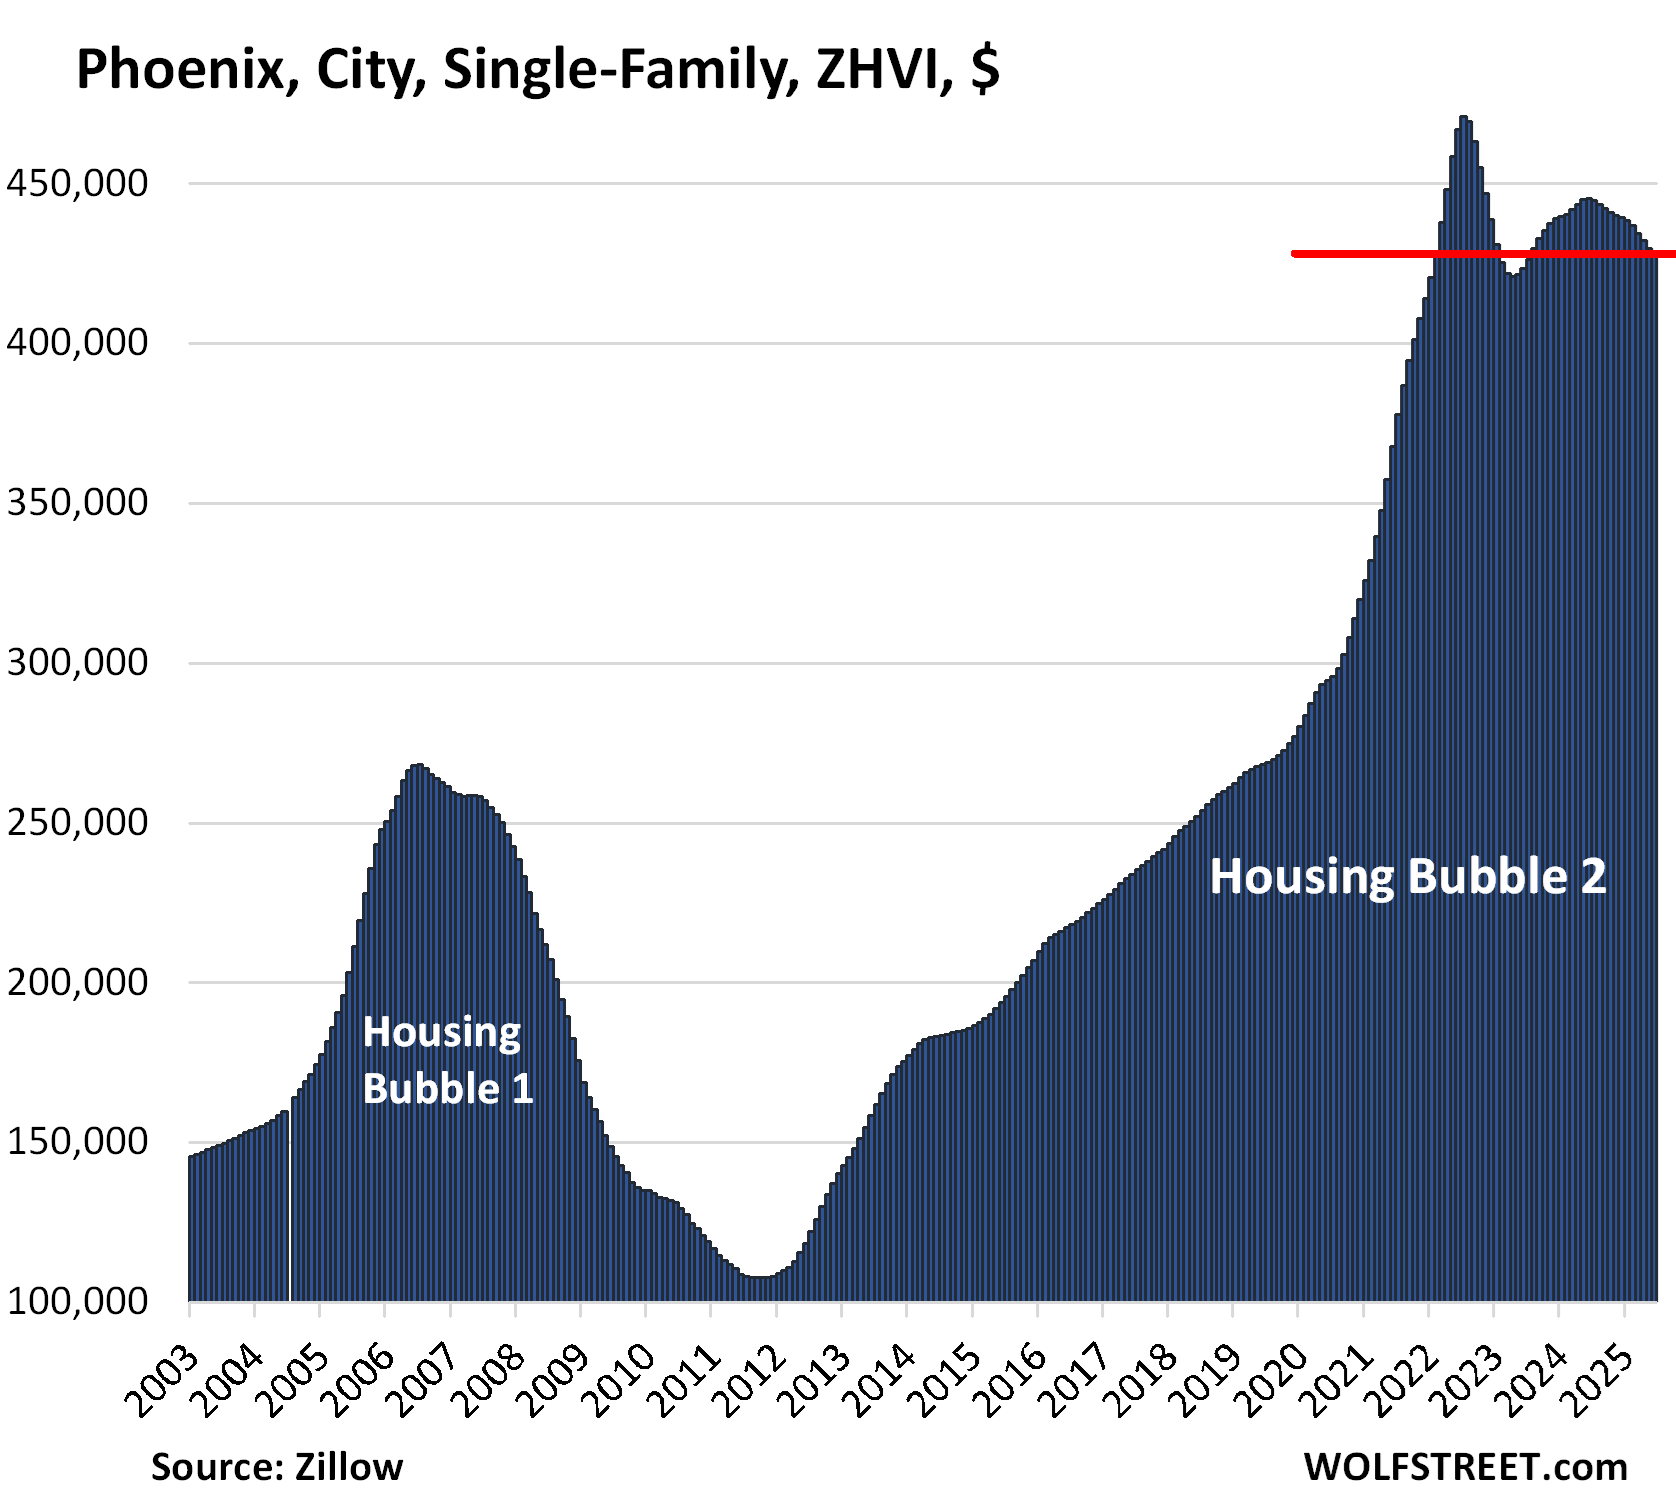
| Phoenix, City, Single-Family Home Prices | |||
| From Jul 2022 peak | MoM | YoY | Since 2000 |
| -9% | -0.5% | -4.0% | 252% |
Prices exploded by 62% from April 2020 through July 2022, which was totally nuts, pushing the 10-year price increase through mid-2022 to 339%.
The kinds of price explosions documented in these charts that occurred through mid-2022 – and in similar charts of housing markets across the US – should never occur in housing markets. Homes are not cryptos. They’re a sign something went seriously awry.
And we know what went seriously awry: The Fed’s reckless monetary policies that repressed mortgage rates below 3% even as inflation was raging toward 9%. Borrowing at 3% while inflation is much higher is better than free money.
Or at least it seemed that way back then. And it proved irresistible, triggered a huge bout of FOMO, and the craziest home-buying behavior ever.
But that free-money era ended in 2022, when the Fed U-turned, hiked its short-term interest rates, and shed by now $2.3 trillion in securities via its QT program.
Enjoy reading WOLF STREET and want to support it? You can donate. I appreciate it immensely. Click on the mug to find out how:

![]()
? another 50% to make housing affordable??….
what do you think? would that be a crash or just a return to sanity.
It won’t be allowed to happen nationwide. Probably a few cities like the previous RE bust
Baby, you ain’t seen nothin’ yet!
Patiently waiting for prices in Seattle to drop.
They dropped, just haven’t reached to -9% yet. They’re at -7%. They dropped 0.9% for the month:
Wolf, to buy a 2200 sq ft home in the nice burbs on “the Eastside” still demands $1M to join. Thats $6k/mo with 20% down.
Meanwhile you can rent that house for a bit over 1/2 that price.
Meanwhile, down here in the PHX sandbox (far east valley) in my 55+ community everything has come to a standstill. Almost nothing moving, though this is not Ghe “season”. When we were in-season, not much moving then either.
Even after the correction, prices are much higher than 2020 in almost all of them. Most cities in the Midwest and Northeast are close to all time highs.
Yes, I’m trying to time a 1031 of my Madison WI rentals to somewhere with attractive rental yields, but haven’t hit that price elsewhere yet. I’ve increased rents 11% but my property taxes have gone up 10% and insurance has gone up 15% and the Midwestern bubble won’t last as people realize they can move to Tennessee or Florida or NC or wherever for less and way less taxes.
Your rent is up 11%, but property taxes are up 10% and insurance is at 15%?
Seeing as how property taxes and insurance are probably much smaller amounts than your rent, sounds like you’re making out like a bandit.
People/companies often talk about expenses going up by x% so prices should go up by a similar % to cover them.
Only if the margins are super tight. Otherwise it’s just more $$ flowing through to the bottom line and the justification/increase is kinda BS.
1) people who aren’t landlords don’t understand there are alternative investments, so yes, I’m making a profit but if I can make a bigger profit elsewhere I will
2) repairs and maintenance as we all know have massively increased in price. Have you had a house painted or roofed recently? Checked the price of a furnace or A/C?
3) taxes and insurance combined are about 3% of the value of the property. Therefore, my gross rent margin has to be 10%, minimum to pay T&I, repairs/maintenance, and come out with a net rent income that beats Treasuries.
What is this concept of investments that you’re talking about? It sounds intriguing…
Honestly, I was speaking to the BS idea that if expenses go up X%, and revenues have to go up by a similar % to stay whole.
It’s been the justification for a lot of the inflationary pricing increases we’ve seen over the years (oligopoly, anyone?), and it sounded like you might be using a similar justification.
Maybe not, but the point that it is still BS for anything other than close to break even margins still stands.
Well yeah. If expenses go up x%, a manager of a business tries to increase revenues by y%, otherwise the manager/owner is taking a pay cut. How often do you voluntarily take a pay cut?
I’ve been a landlord for pushing 2 decades and the rough numbers are:
Buy at gross rent multiple of 10%.
3% goes to taxes & insurance, 3% goes to repairs and maintenance and vacancies, 6% net profits.
Over the long term, property tax hikes have exceeded inflation significantly so guess what? I need to raise rents above inflation in repairs and maintenance (which tracks inflation). End result: My net is pretty much the same as it was 15 years ago adjusted for inflation.
Now we’re pretty much down to semantics, but because this is a topic I used to have to explain to a surprising number of people years ago and in another life, here’s the example I used to give when it came to talking about how margins were used for financial analysis.
$100 revenue
$1 expense
99% profit margin
$50 revenue
$1 expense
98% profit margin
Small difference in margin percent, huge difference in actual variable profit.
This example is different, but also similar (using the original numbers above, but increasing expenses and revenue by 10% each)
$110 Revenue
$1.10 Expenses
now your net has just increased by 10%.
Not necessarily a bad thing but in this extreme example, revenues would clearly not have had to increase at the same percentage as expenses.
This is very basic – you clearly know your expenses at a much deeper level, just walking down memory lane and highlighting some of the logic behind what I was saying. Regards
They have already done that in droves and have ruined the state of TN
Still a long way to drop. The commercial real estate disaster hasn’t even really started yet.
Interesting times Wolf!
Hmmmmm………,tis a start.
I will have me coffee/move on with me day,see what the future holds,til then,still on “buyers strike”.
To be clear, those price drops should correspond to a proportional drop in real estate taxes, but I’d love to know if that’s actually true. Having dealt with the county assessors, on numerous properties, these corrupt bastards are very slow to adjust assessments down and almost always have to be fought in court, even when the values around your properties are crashing.
It takes time for the county to “catch up” to a downturn. It helps to be proactive.
If only the appreciation column matched the starting year in the graph. But again, it would appear that Oakland and SF have merely more than doubled since 2003, which would be between 3-4% annualized, not much more than inflation in the longer run (Oakland appears to be 3.75%). And for SF almost certainly less than median household income has increased.
So yeah, if you bought in 2021, sorry. If you bought in 2003, your leveraged inflation hedge that you live in is doing just fine.
As an aside, the RE culture in the Bay Area as Wolf knows is to deliberately underprice the listing and generate an auction. For several houses in the area of my Bay Area summer house, the auctions have not even brought the list price, i.e. they have actually sold for under list. So the list prices will drop rapidly now.
In my neck of Florida, the RE culture is to list property for significantly over the expected sale price in hope of landing a sucker like a Venezuelan looking to drop money in the USA. Interestingly several places in my area have (as expected) sold for below ask, but at a percentage similar to the Bay Area sales.
Just anecdotes but interesting to me at least.
So after the 22% price drop, Oakland is still up by 130% from 2003 (close to double the rate of inflation), but 2003 wasn’t low-priced, it was already sky-high. So you can measure from the top of Housing Bubble 1 (2006) and say: Oh, look, Oakland is up only 50%, it’s low-priced now and a deal. But you’re measuring from the prior peak that blew up.
2003 wasn’t really bubble land as prices in California were flat for most of the ‘90’s.
2.65% inflation vs 3.75% appreciation. The 1% difference happens to approximate productivity gains long term and the appreciation rate approximates household income growth which has been 4.2% in SF.
Can prices drop more? Sure yeah of course.
Are they kind of “fair” now? Yeah. Kind of on a long term basis.
Wolf since there is no real stress broadly on households leverage wise but houses are unaffordable in most areas, if I had to buy the home across the street from me today which is exactly the same my payment would be +130% more, how does this resolve without waves of selling and foreclosures which looks unlikely now? Just many years of prices trending down to a more affordable level?
I’m not sure what to think on prices the more I think about it.
Copper tariffs, other tariffs, low unemployment, the immigrants who do a large amount of the construction being deported, and the apparent thin profit margins/rate buydowns builders are complaining about…
I don’t really know that prices across the board will drop to reasonable levels. I think this is the final maturity point of the US real estate with the rest of the west. Housing prices in almost all western countries are largely unaffordable for the working stiff. The old adage of 1% rate change is equal to 10% price change certainly isn’t tracking in my neck of the woods. We’ve had 12-18 months of prices holding nearly steady, which is a price drop considering inflation… But a starter home is still 500k and up. Meanwhile most jobs barely scrape 25/hr.
Just checking if I’m blocked yet. 😉
I review all your comments before they’re published. It’s a special privilege, but many people have that privilege.
*illegal immigrants
Sucks that builders can’t use cheap labor wah
You also get what you pay for.
May force hefty construction profits to shrink. May happily coincide with a broader slowdown in home construction following the early 20s boom. And just maybe, enforcing the laws that have been democratically enacted by the citizenry may force companies that have previously engaged in illegal hiring practices to 1) offer higher wages to US citizens, and 2) join the chorus for a much more sane, sensical, and humane immigration policy that allows some form of legal non-permanent migration status for laborers. Would be much better for all of us (and all of them, but maybe not for the companies!) than our current system that weirdly incentivizes foreigners to break the law by entering illegally, staying illegally, and living in the shadows.
The Bubble is taking a baby hit, but is still giving the finger to the crash fan boys. Until supply increases and or demand drops, prices remain high. “Winner take all” scenario, popular areas to live just don’t have enough housing. Many factors at play here, but I wonder if the aging in place trend is a major driver? All of the “mature “ folks I hang with remain in their homes. Many are greatly over housed, but they like where they live. Smaller homes are not available, or not located where the want to live (zoning).
A baby hit is all it’s going to get.
There might be some additional nominal price drops but 5 years from now, nominal prices will be about the same but 20% lower inflation adjusted which will put them 40%+ lower on a real basis in 2030 compared to 2020.
what nominal drop ? a lot of once hot markets are down more than 20% from peak e.g. Austin.
Inventory up and prices down a bit here in my Phoenix suburb, but still grossly over priced.
Trump said he may exclude capital gains taxes on houses?
LOL, another Trump-said.
There are thousands of Trump-saids every day.
Capital gains exemption is 250K for single, 500K for married couple.
Even if Trump forgoes cap gains for homes, it wont make much dent in inventory.
If people lose 25-50% of equity on Zillow, does this make the stock market go down?
Any correlation?
People run in herds
Most people don’t care about equity unless they’re borrowing against it or selling