US home prices nearly flat year-over-year, but fell in 21 of our 33 metros: Austin, Tampa, Miami, San Diego, San Jose, San Francisco, Los Angeles, San Antonio, Dallas, Phoenix, Orlando, Atlanta, Denver, Raleigh, Houston, Seattle… YoY gains shrink further in Boston, Chicago, New York…
By Wolf Richter for WOLF STREET.
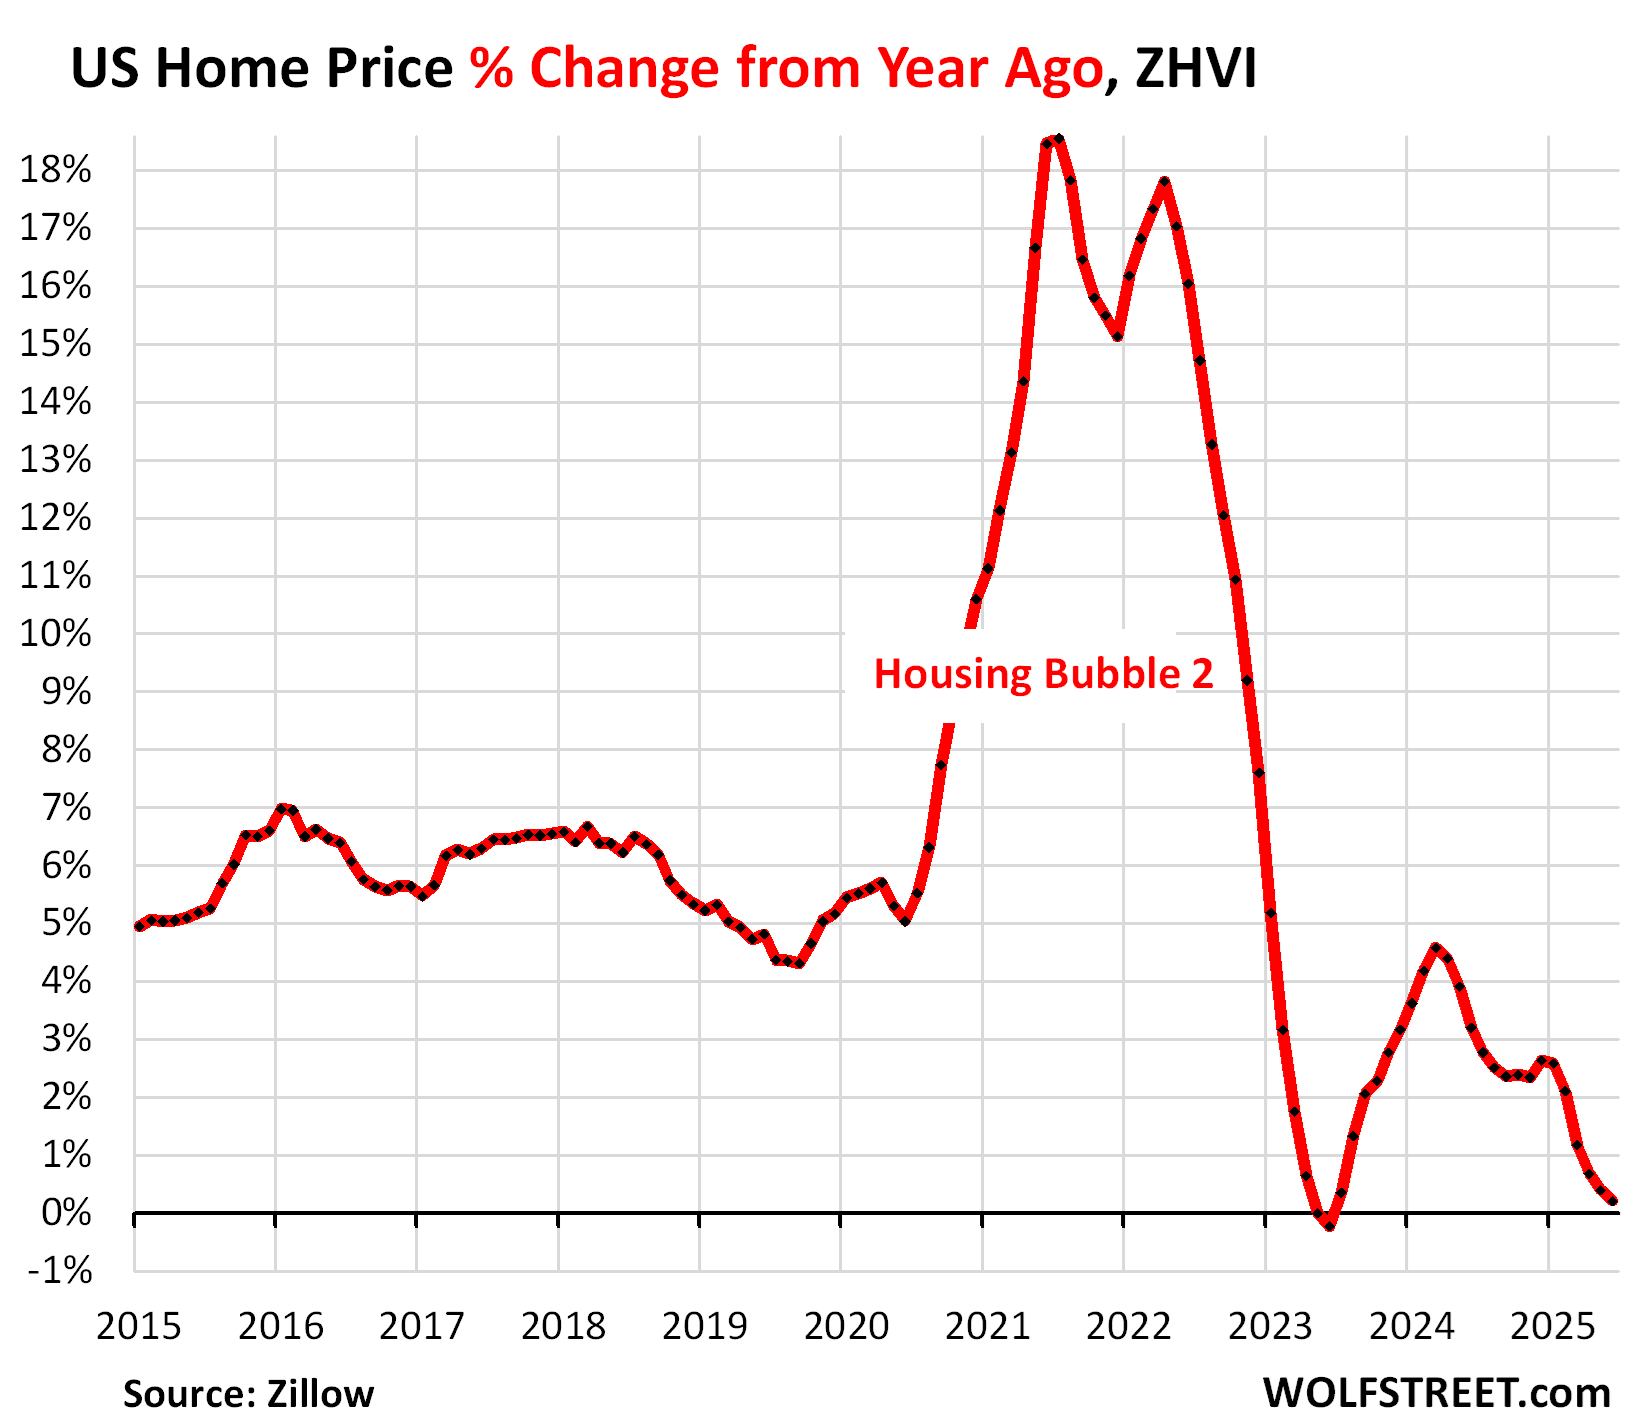
The year-over-year price gains of mid-tier single-family homes, condos, and co-ops in the US nearly vanished in June: prices rose by just 0.2% compared to June a year ago. But that wasn’t equally spread around.
Of the 33 largest and most expensive metropolitan statistical areas (MSA) that we track here, the number with YoY price drops has expanded every month this year. At the end of 2024, only 6 of the 33 metros had year-over-year price drops. In June, the number rose to 21 (from 18 in May). The three additions: Los Angeles, San Jose, and Nashville. And the YoY price drops worsened in nearly all of them, including in San Diego (from -1.9% in May to -2.4% in June).
In the US overall, the year-over-year price gains have been losing steam for over a year, after the spurt in 2023 and early 2024, whittled down the YoY price gain in June to just 0.2%. But it wasn’t spread equally:
The 21 of 33 metros with year-over-year price declines:
Florida and Texas metros occupy the top 5 spots on the list of the biggest year-over-year declines among our 33 metros. In June, the list grew to 21, from 18 in May and from 6 at the end of 2024.
Year-over-year declines in June:
- Austin: -5.8%
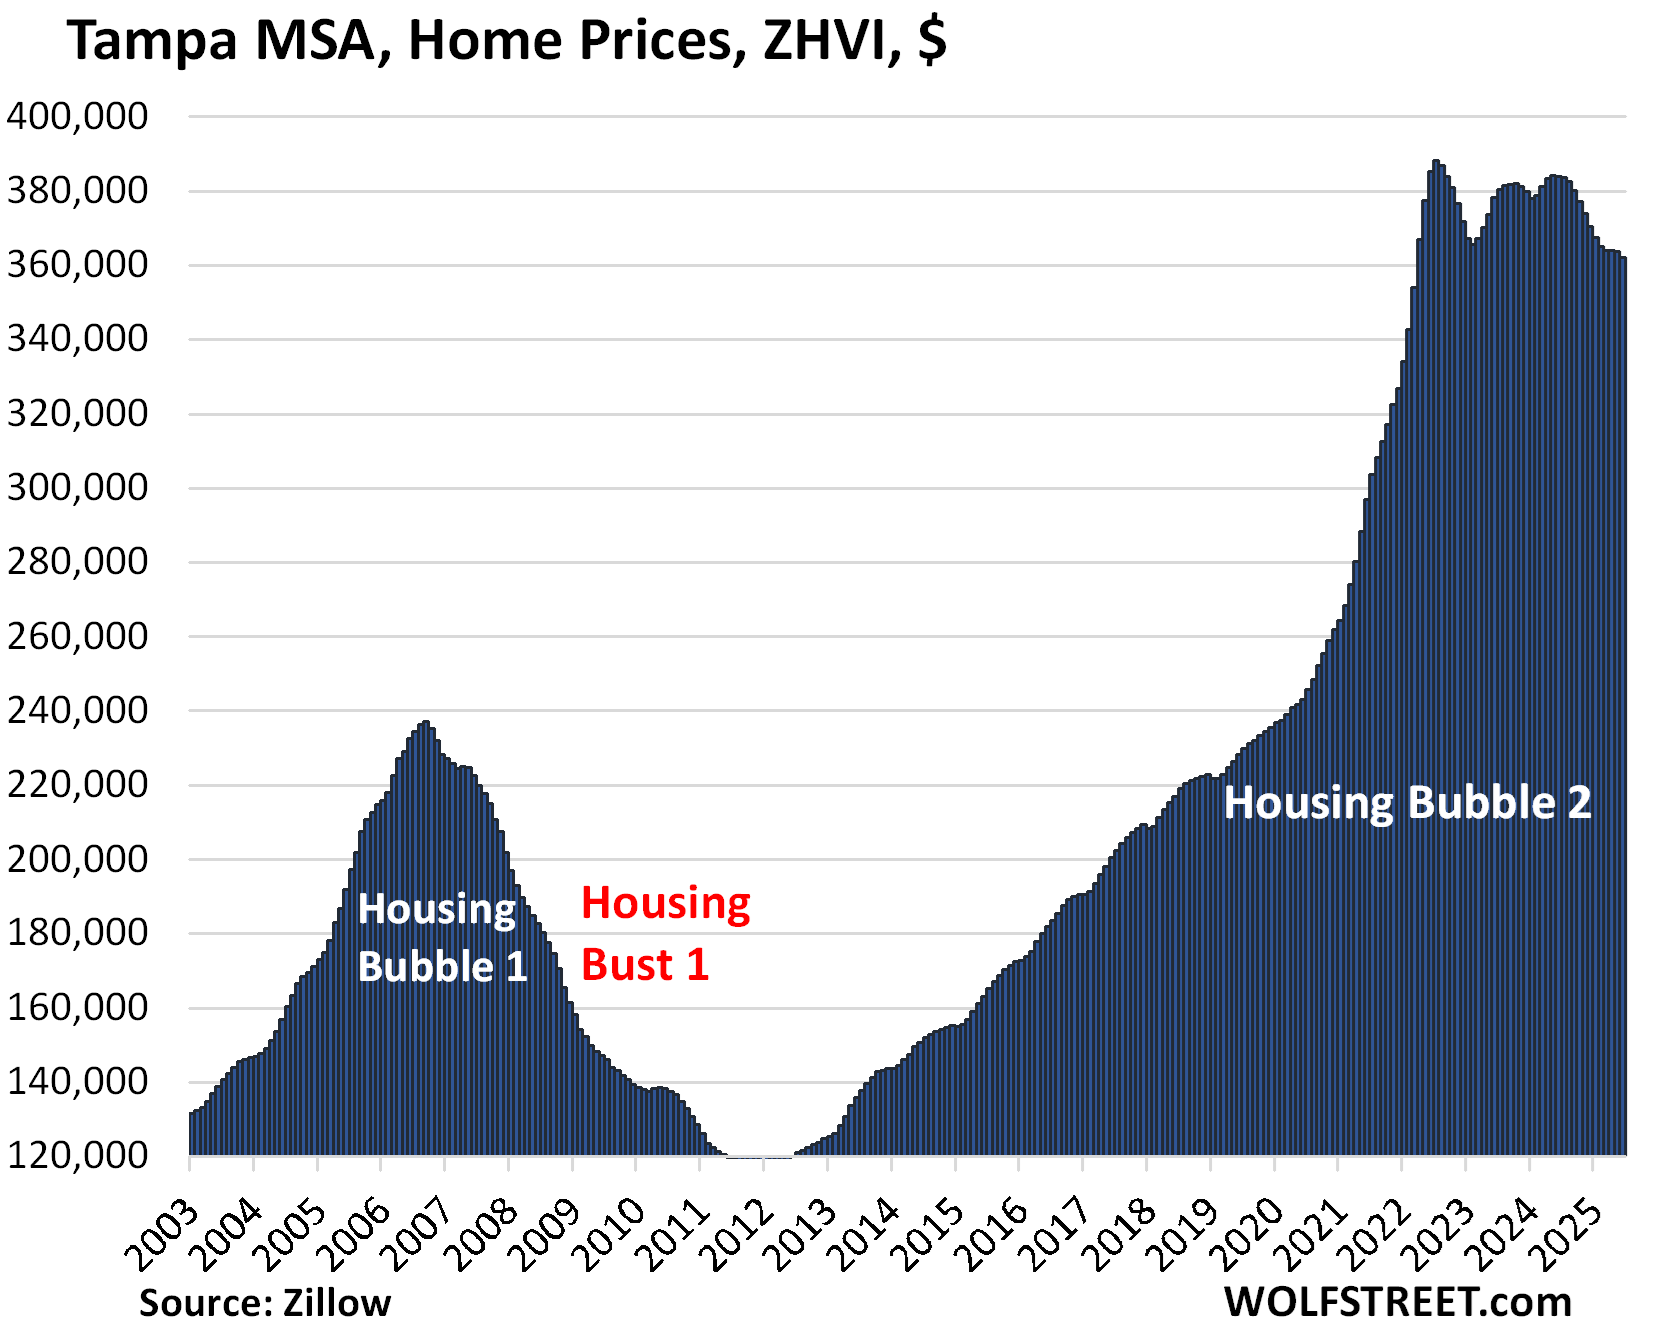
- Tampa: -5.5%
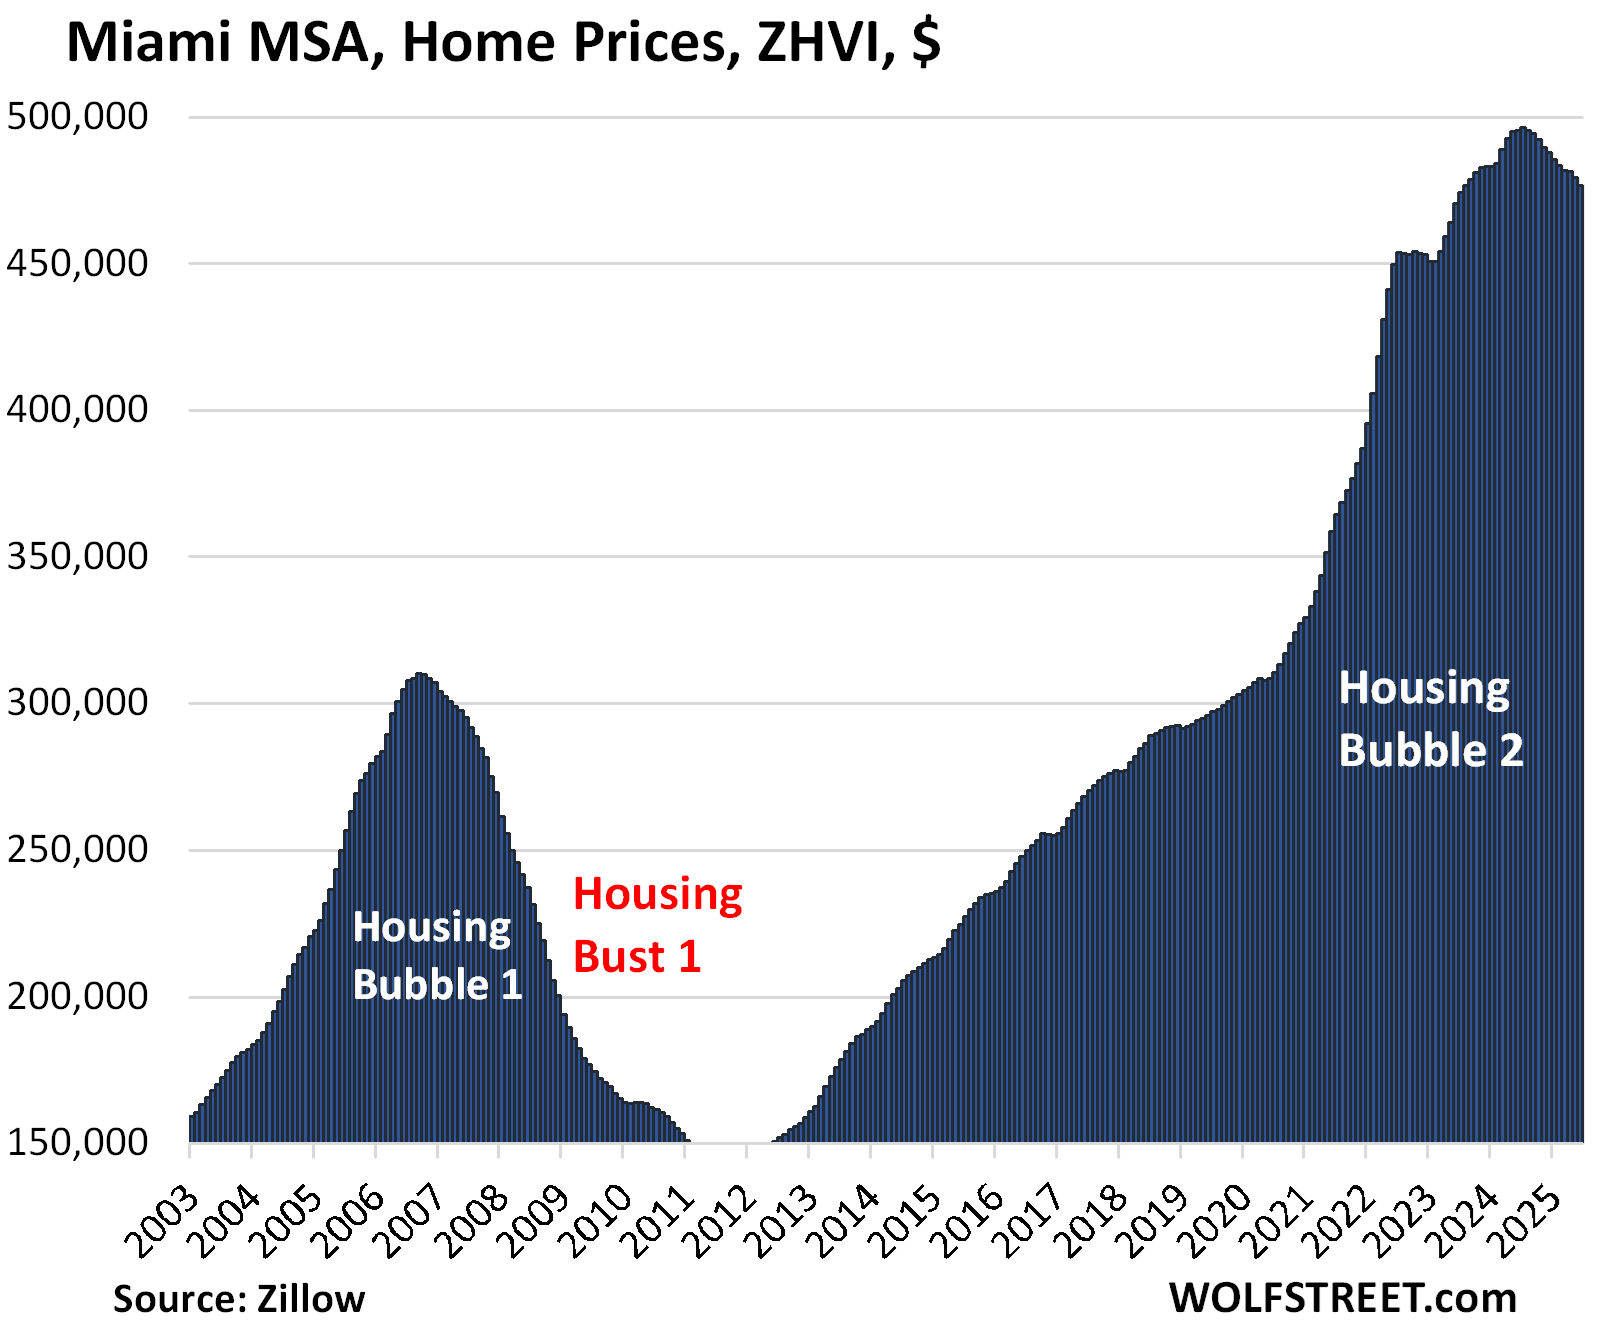
- Miami: -3.8%
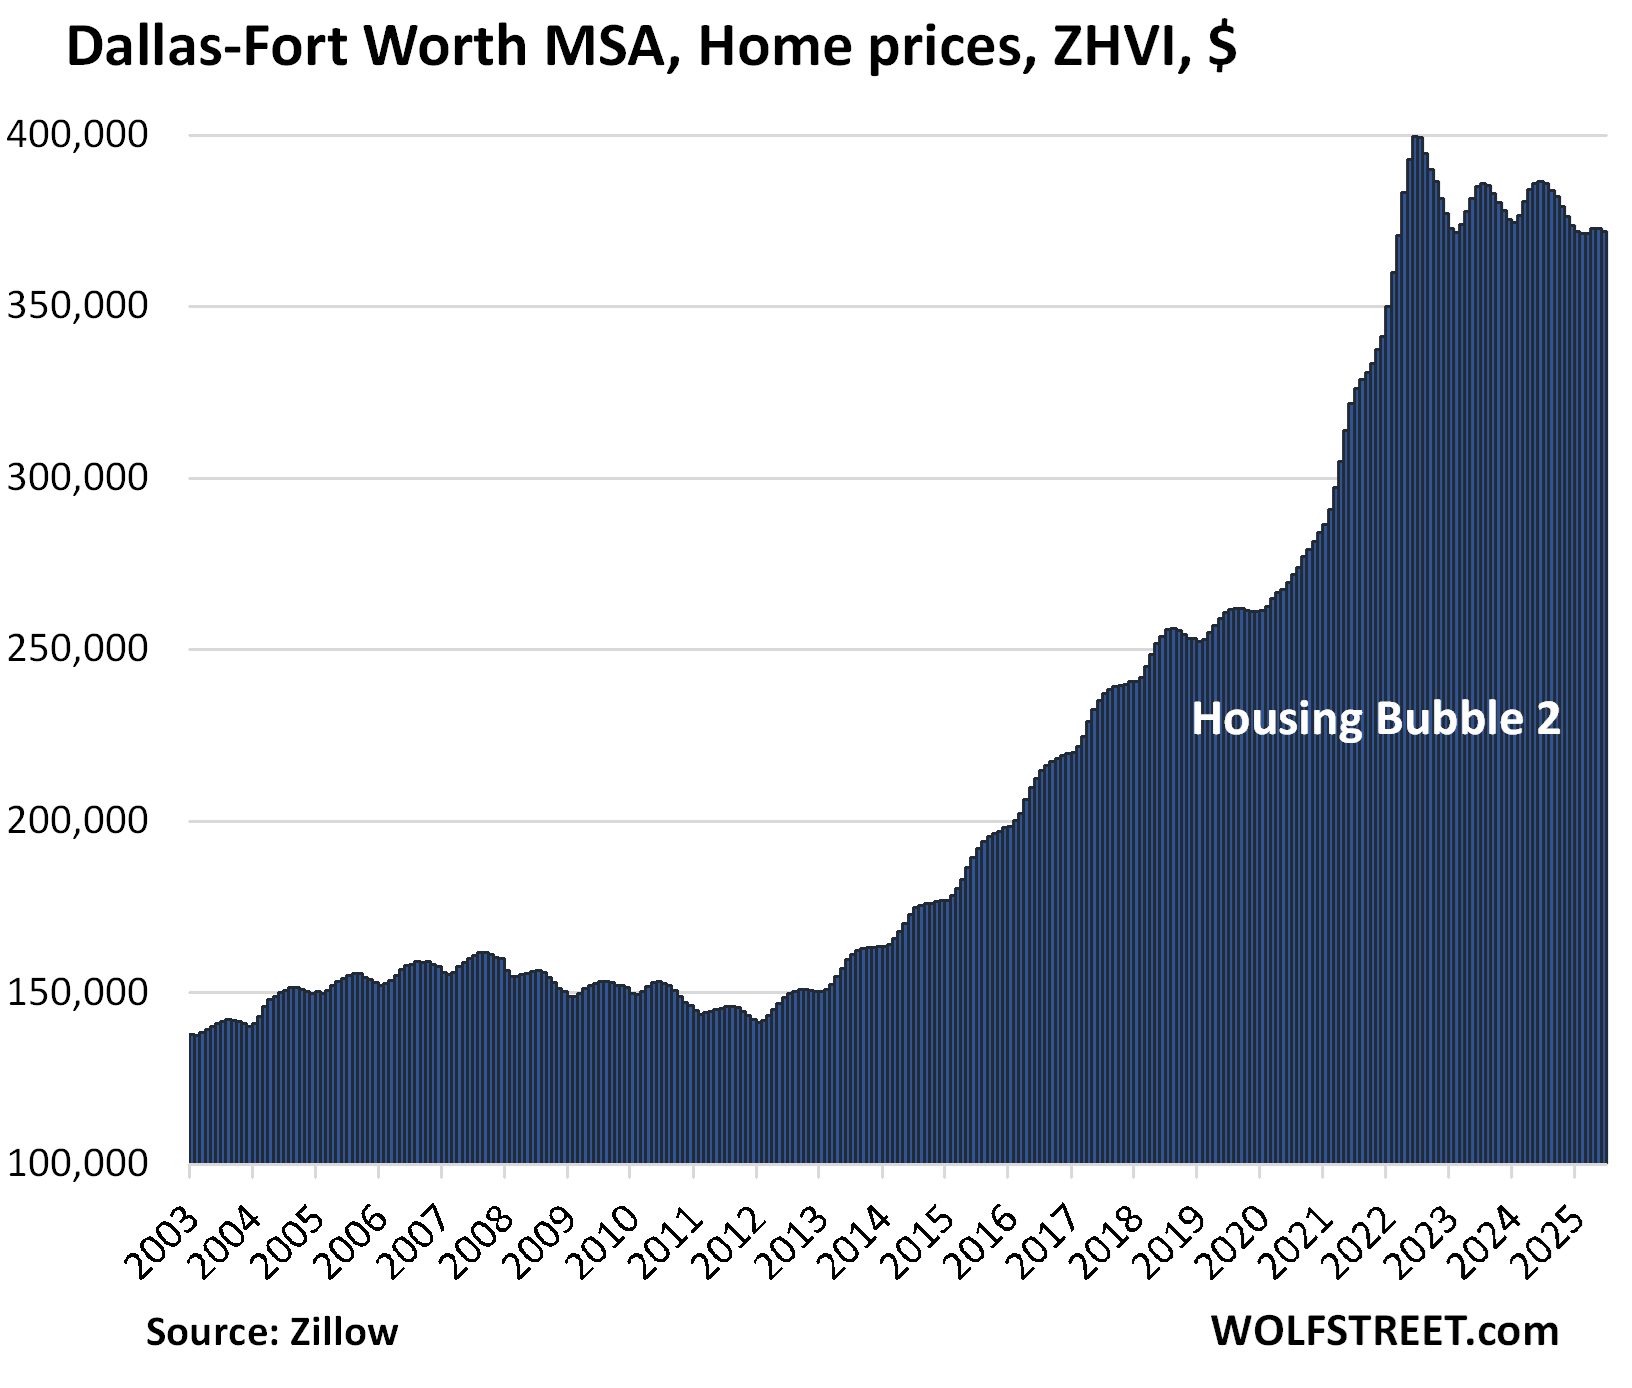
- Dallas: -3.7%
- Orlando: -3.7%
- Phoenix: -3.5%
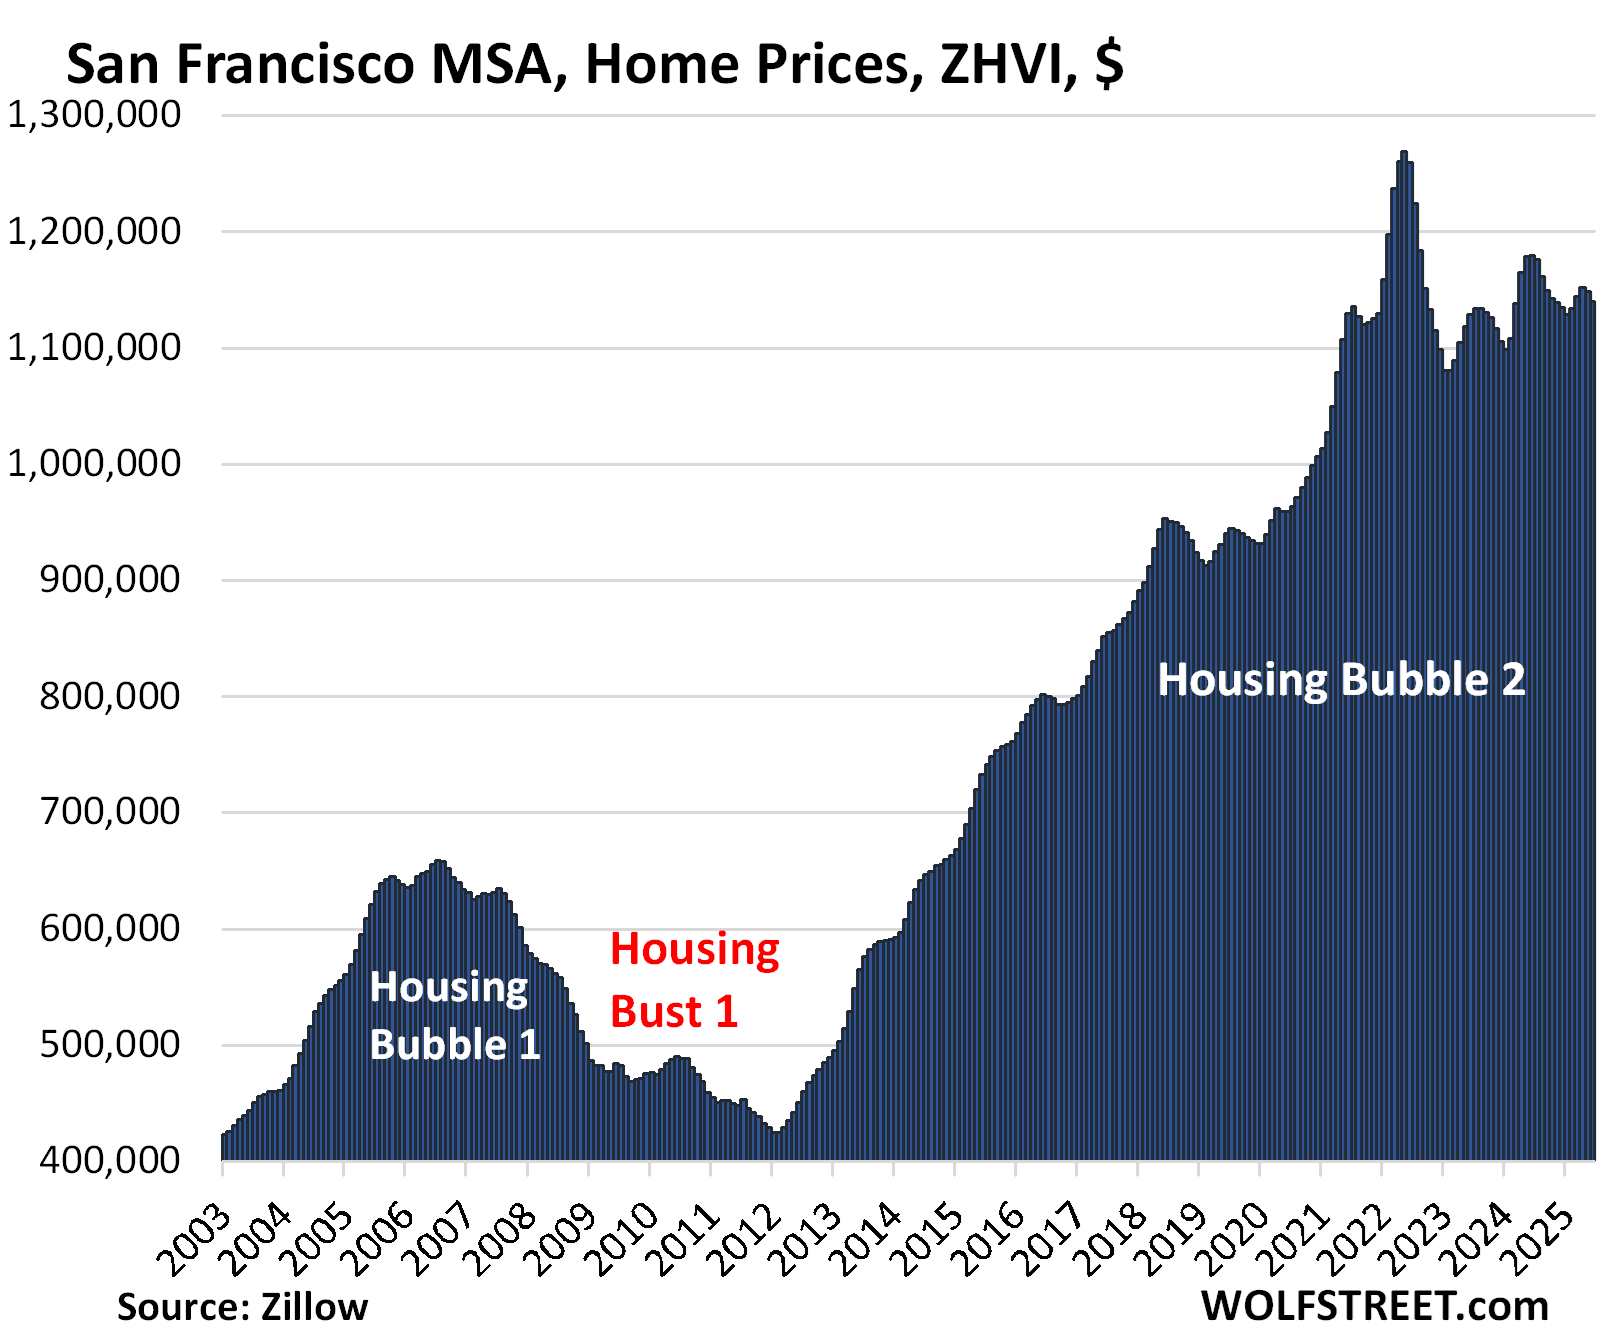
- San Francisco: -3.4%
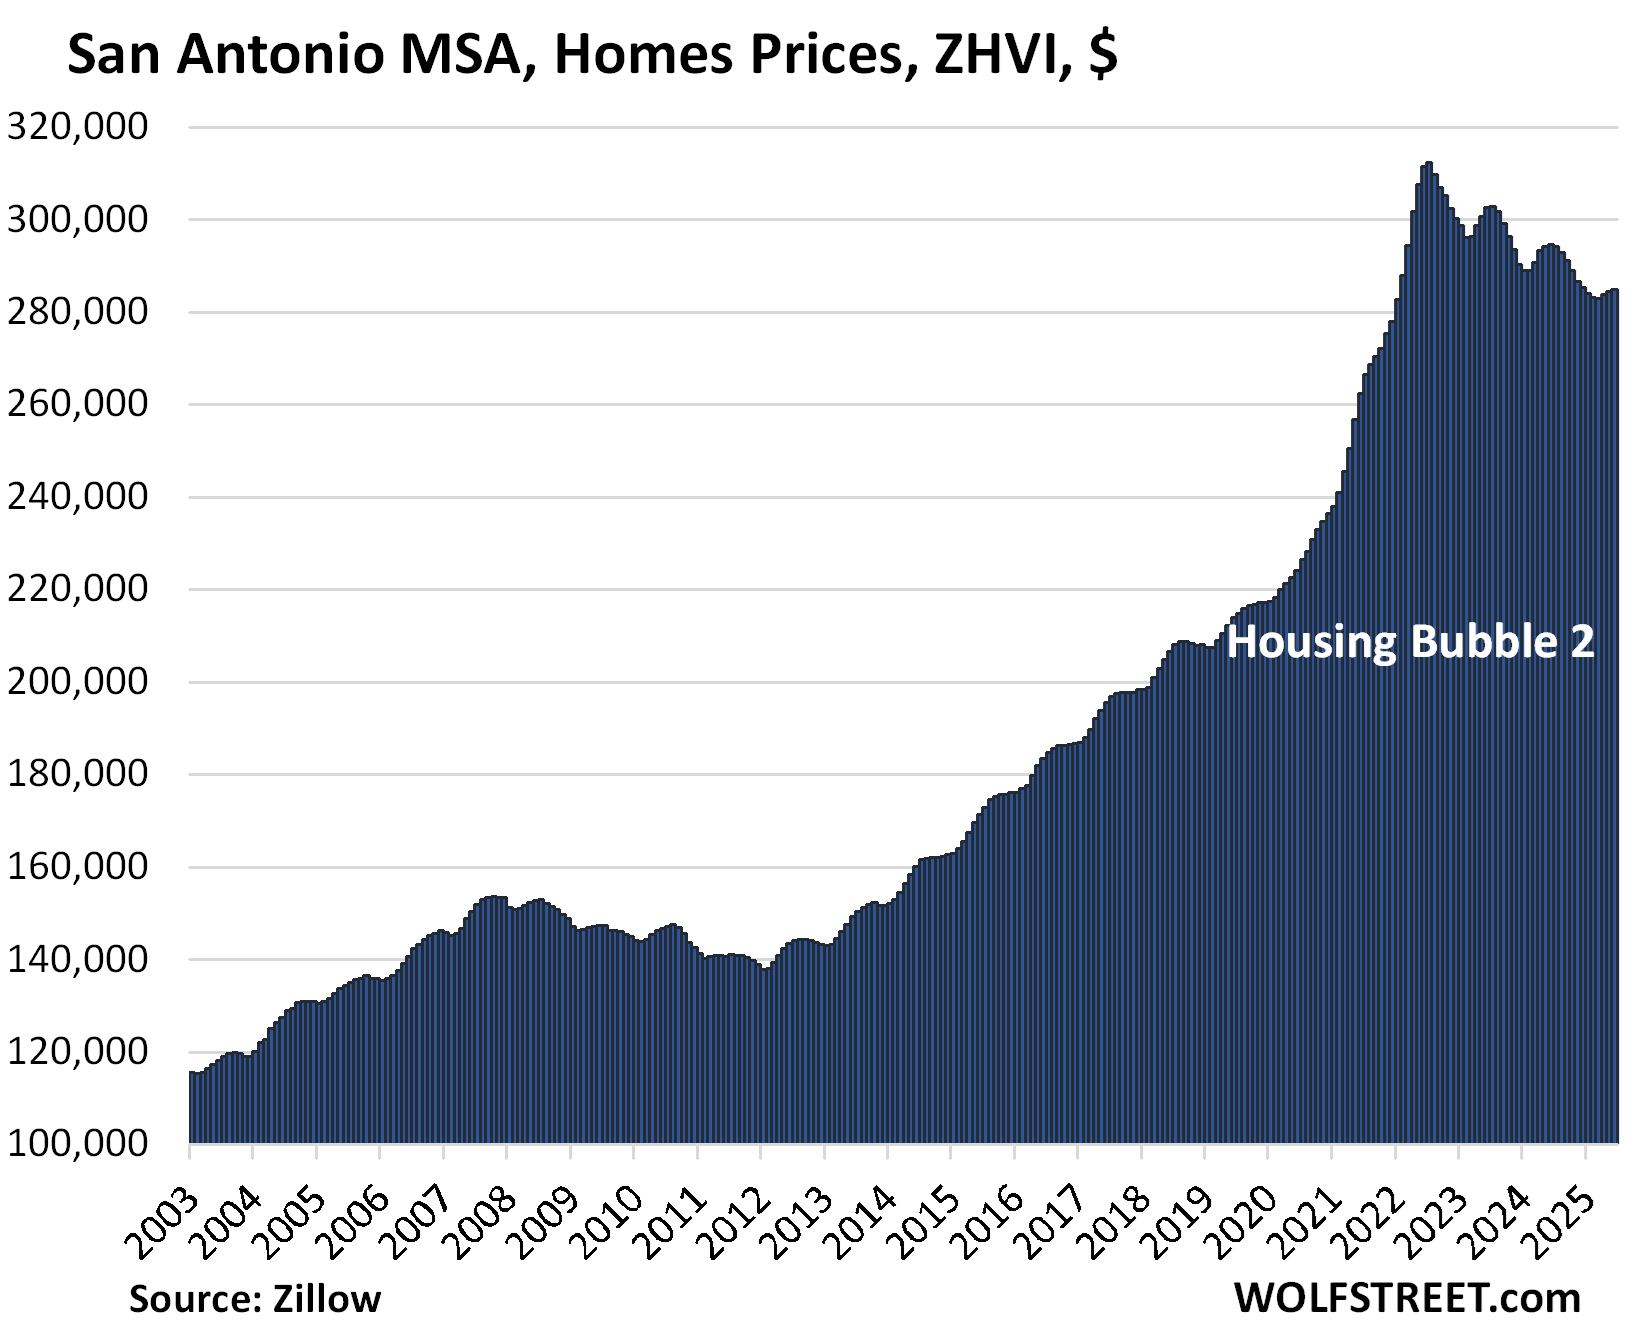
- San Antonio: -3.3%
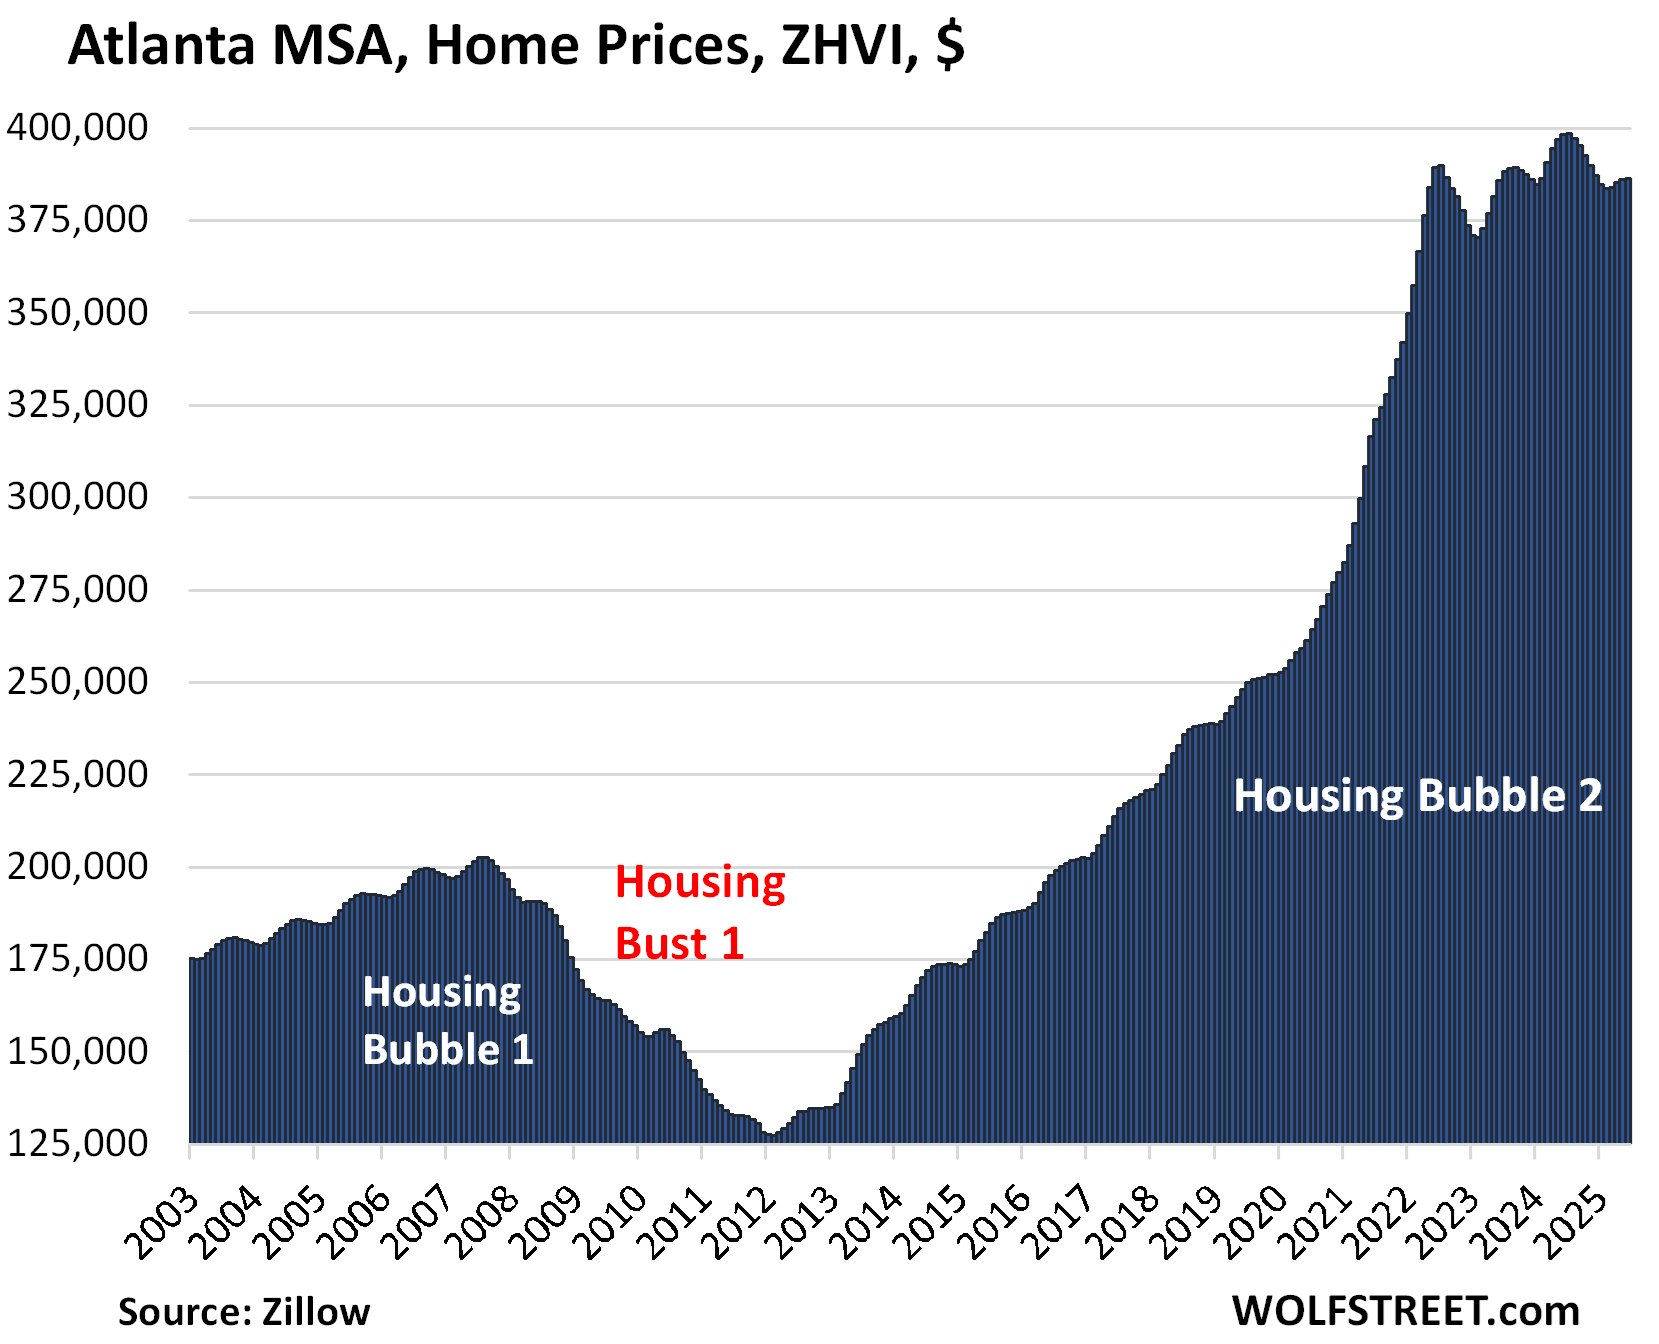
- Atlanta: -2.9%
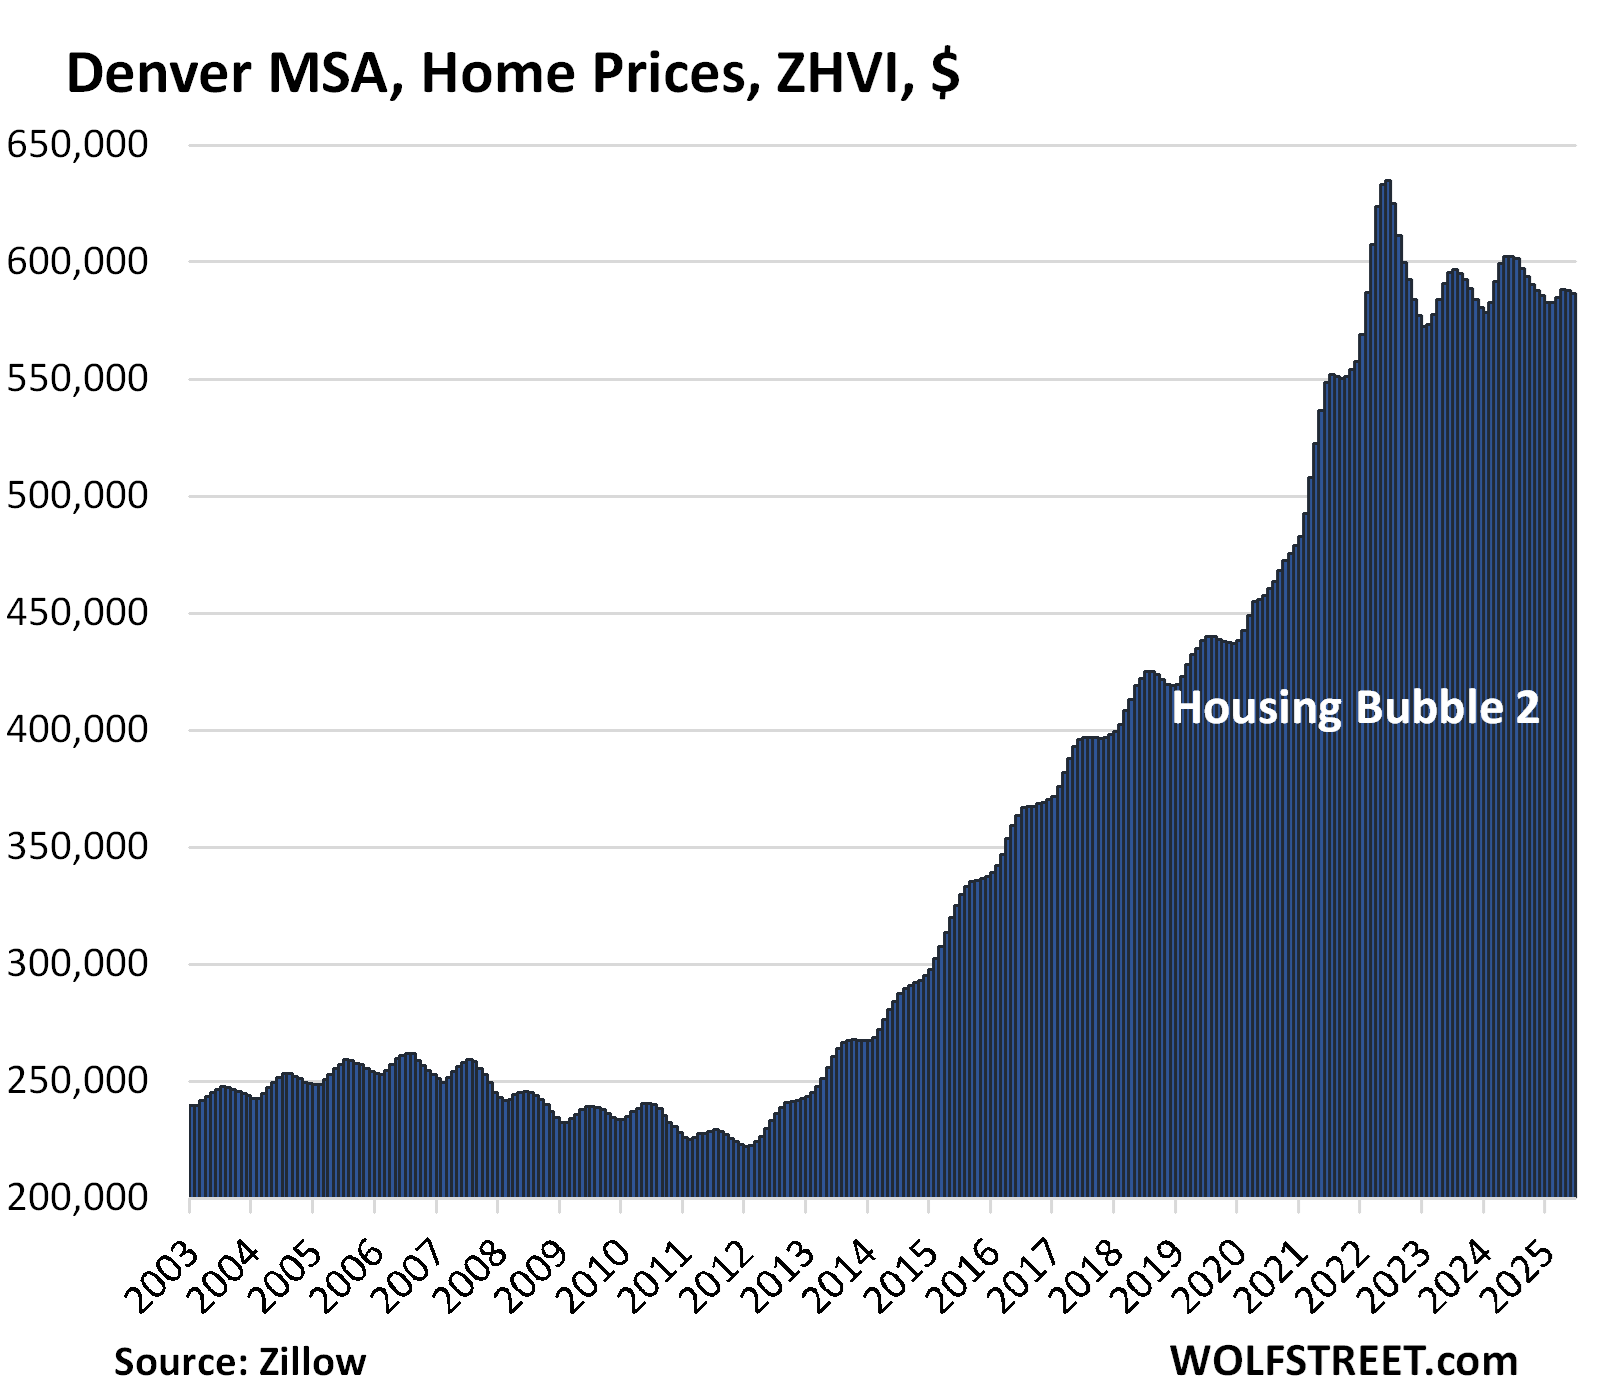
- Denver: -2.7%
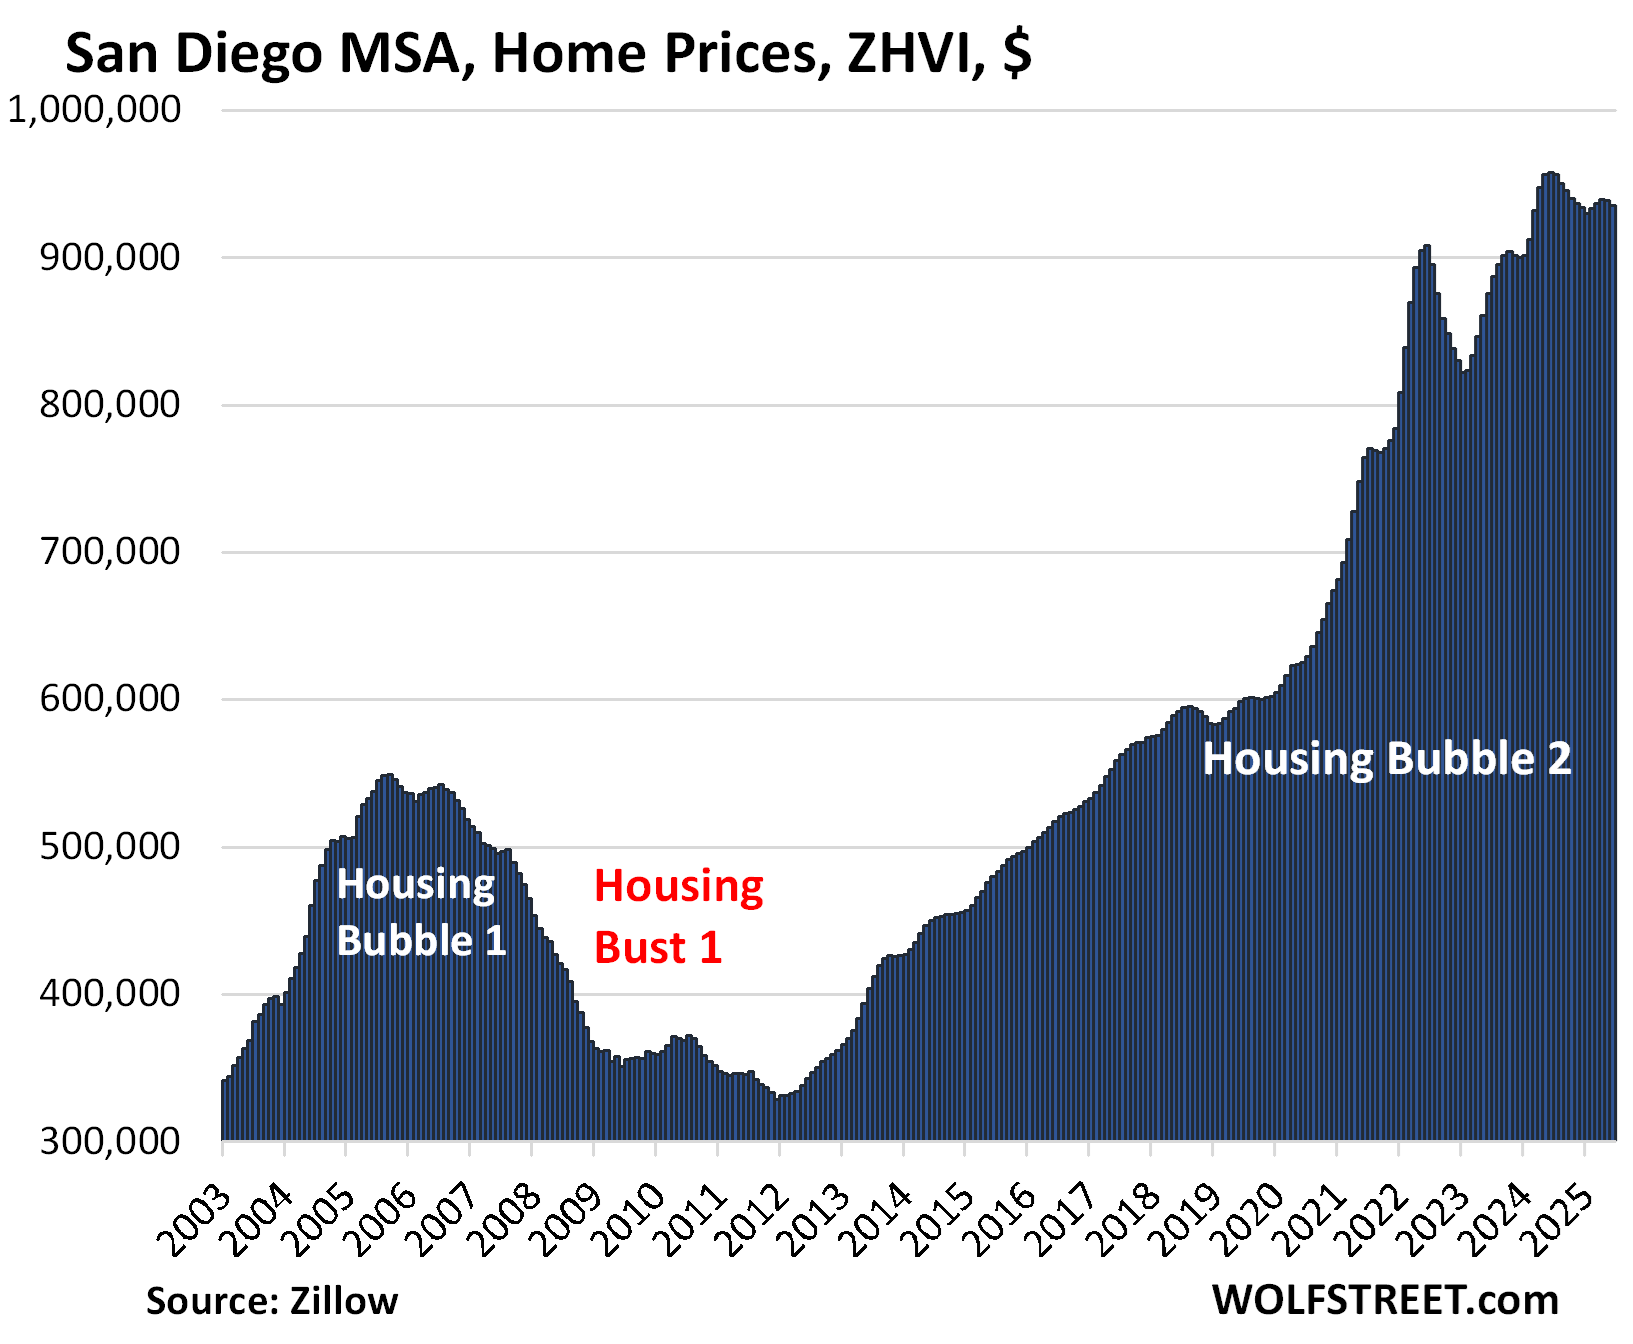
- San Diego: -2.4%
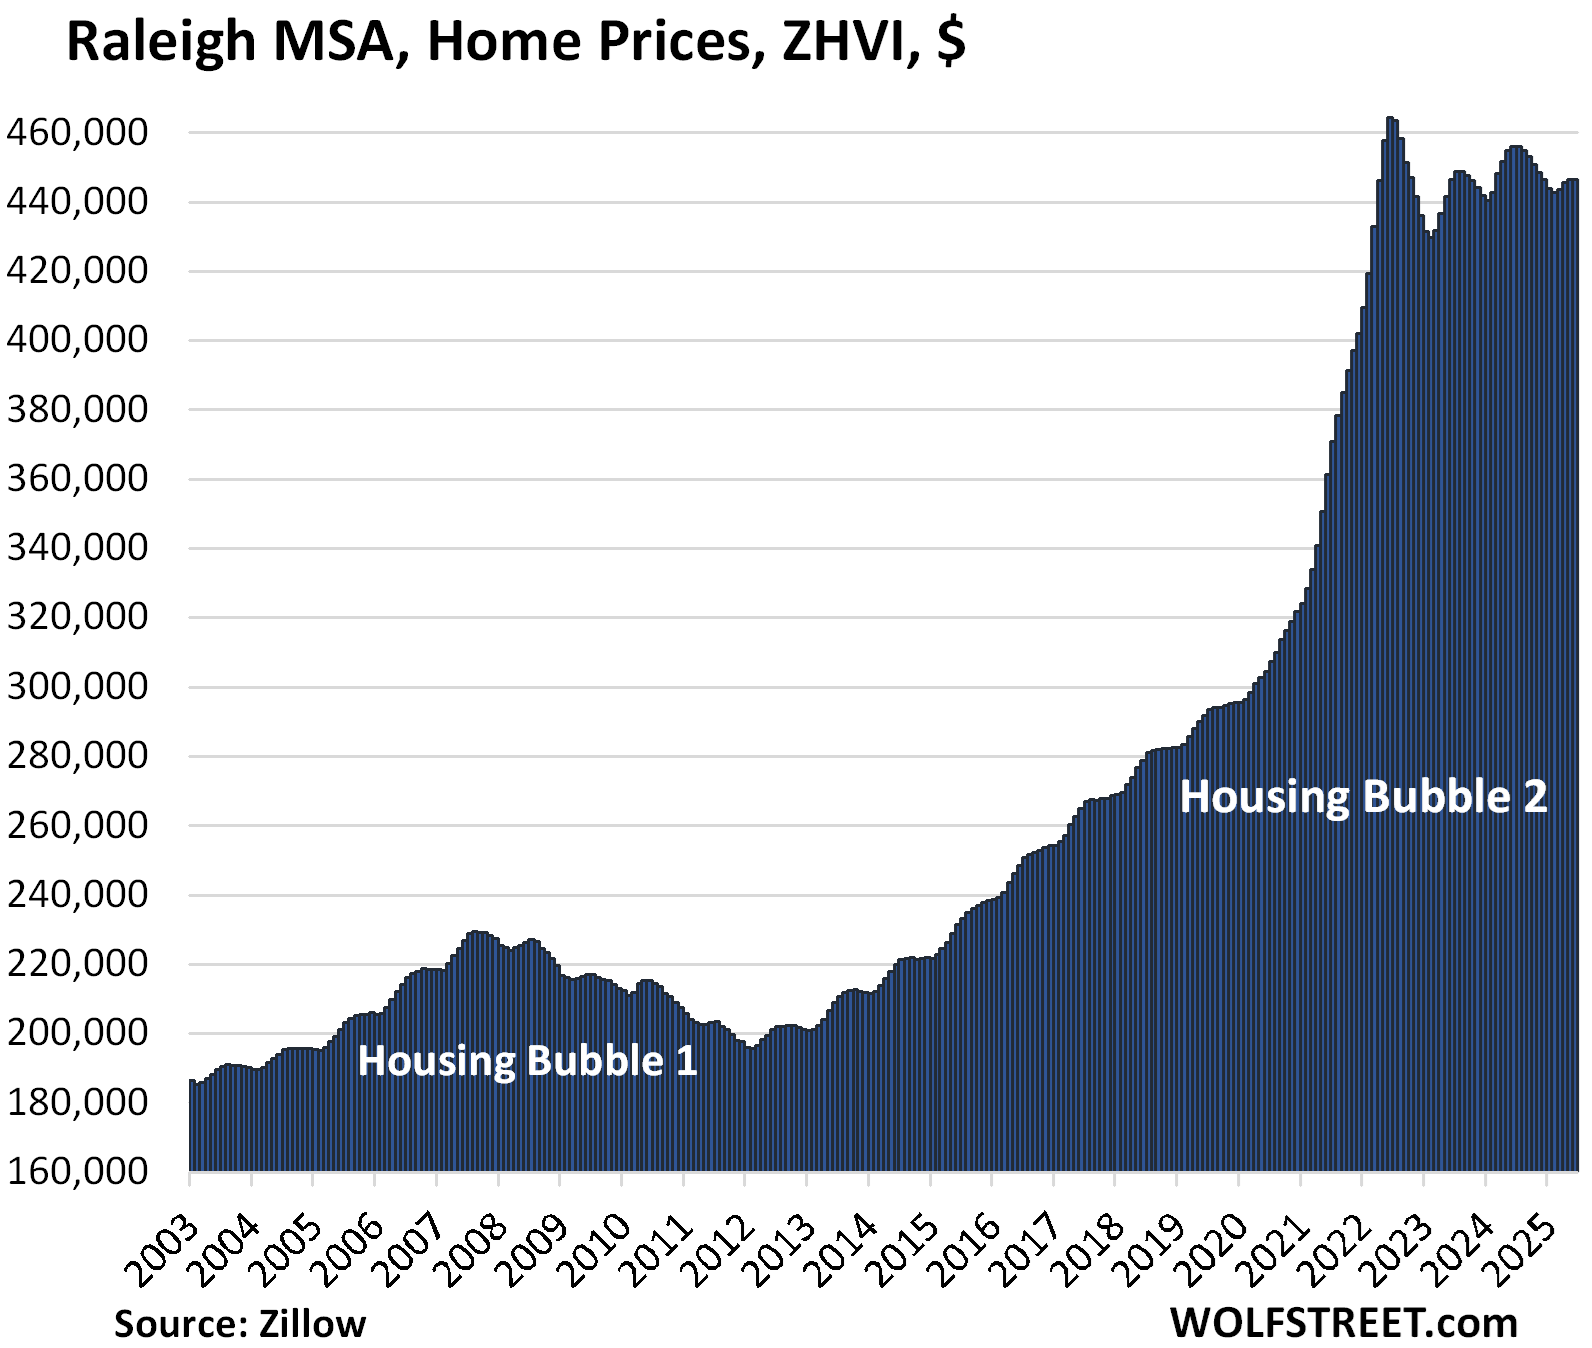
- Raleigh: -2.1%
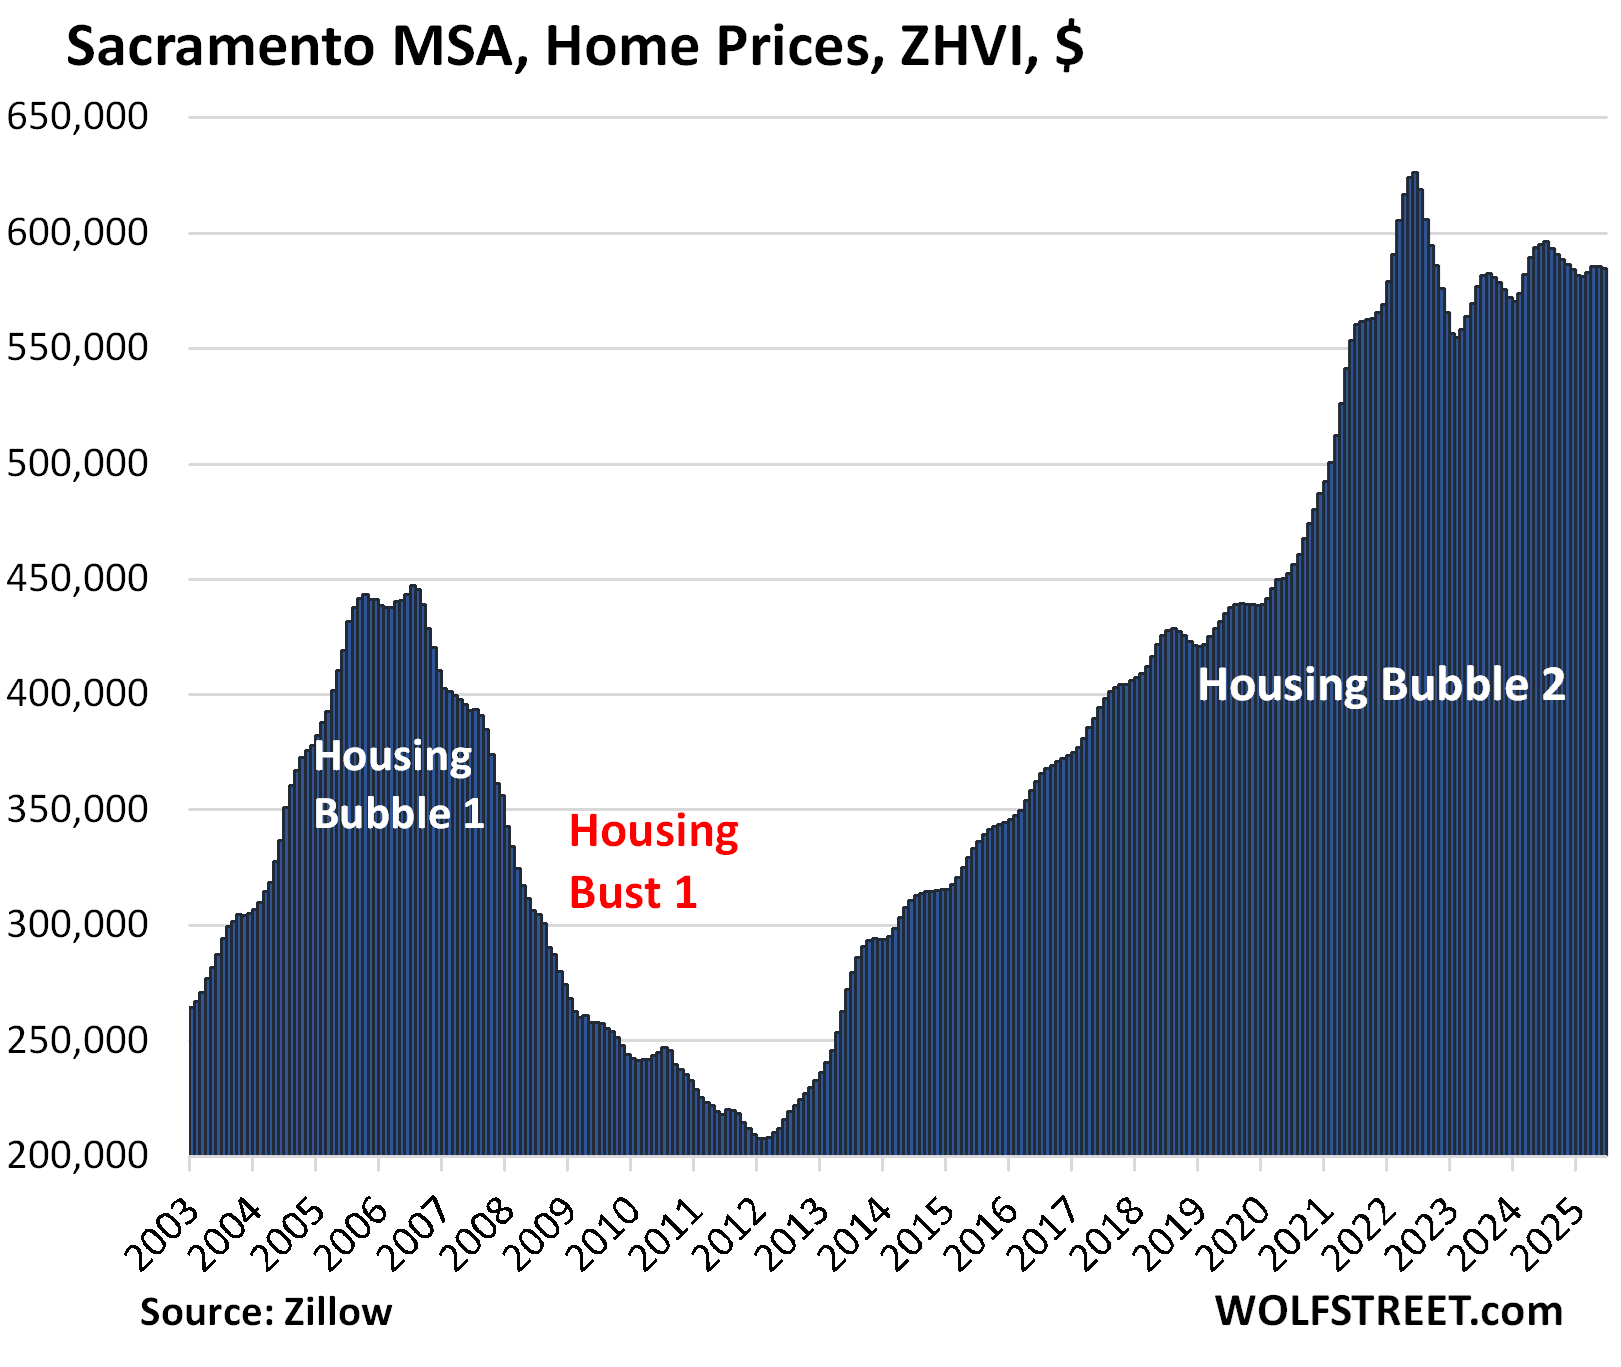
- Sacramento: -1.8%
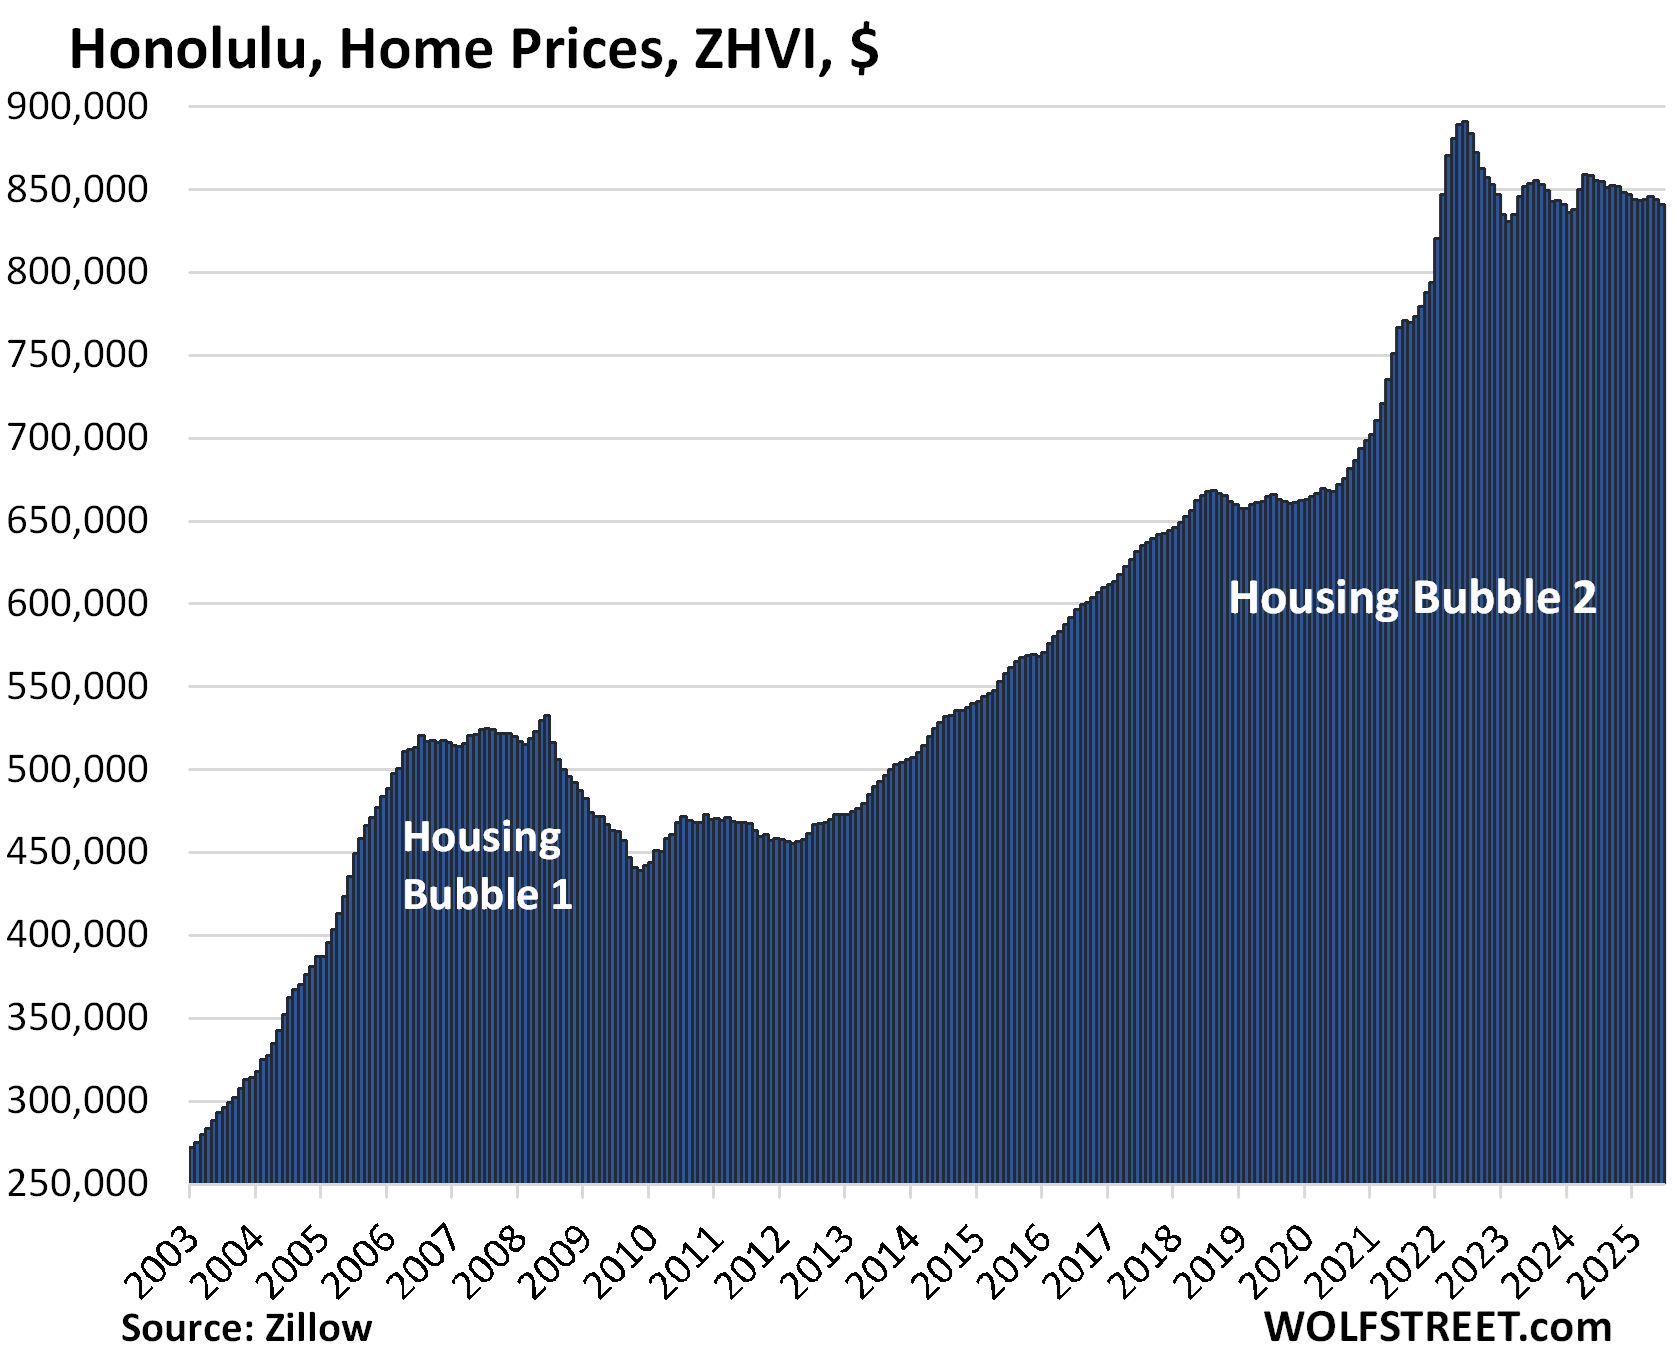
- Honolulu: -1.7%
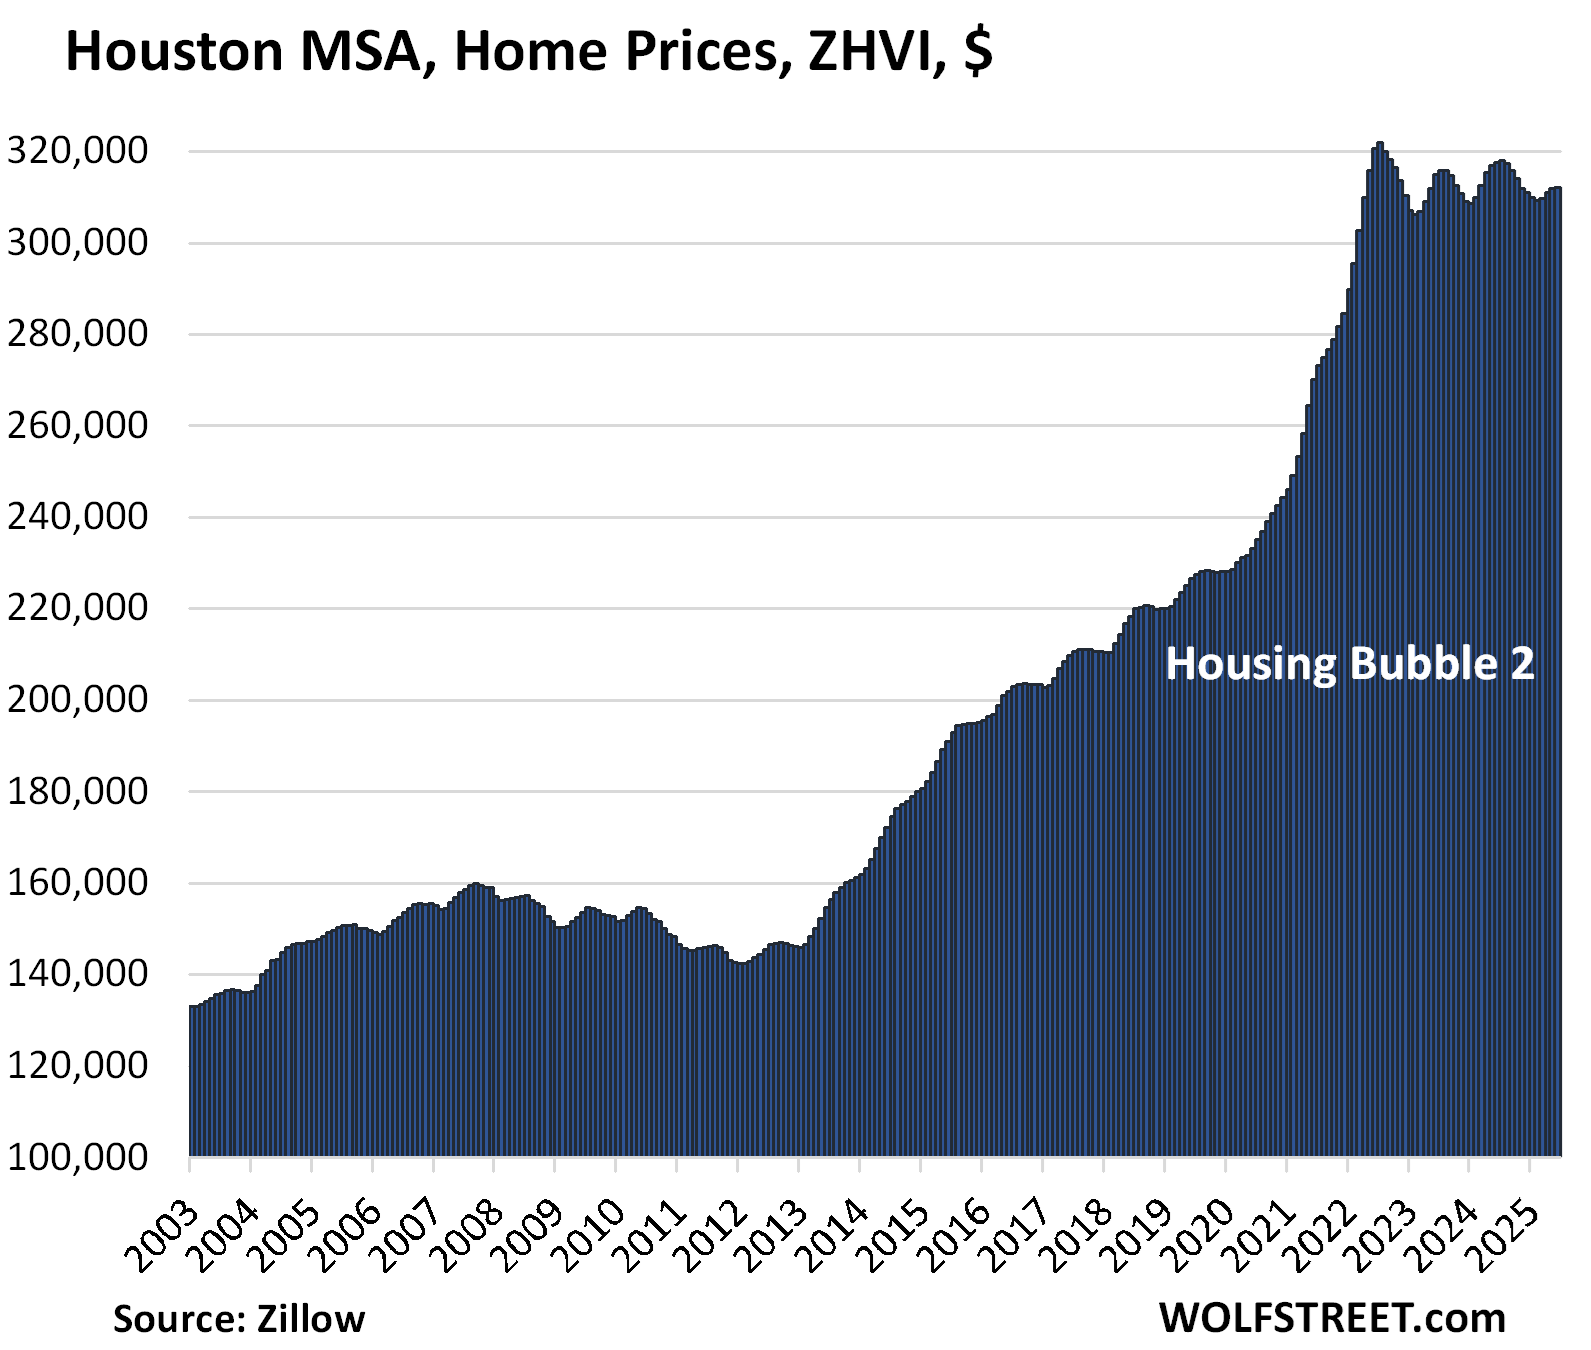
- Houston: -1.7%
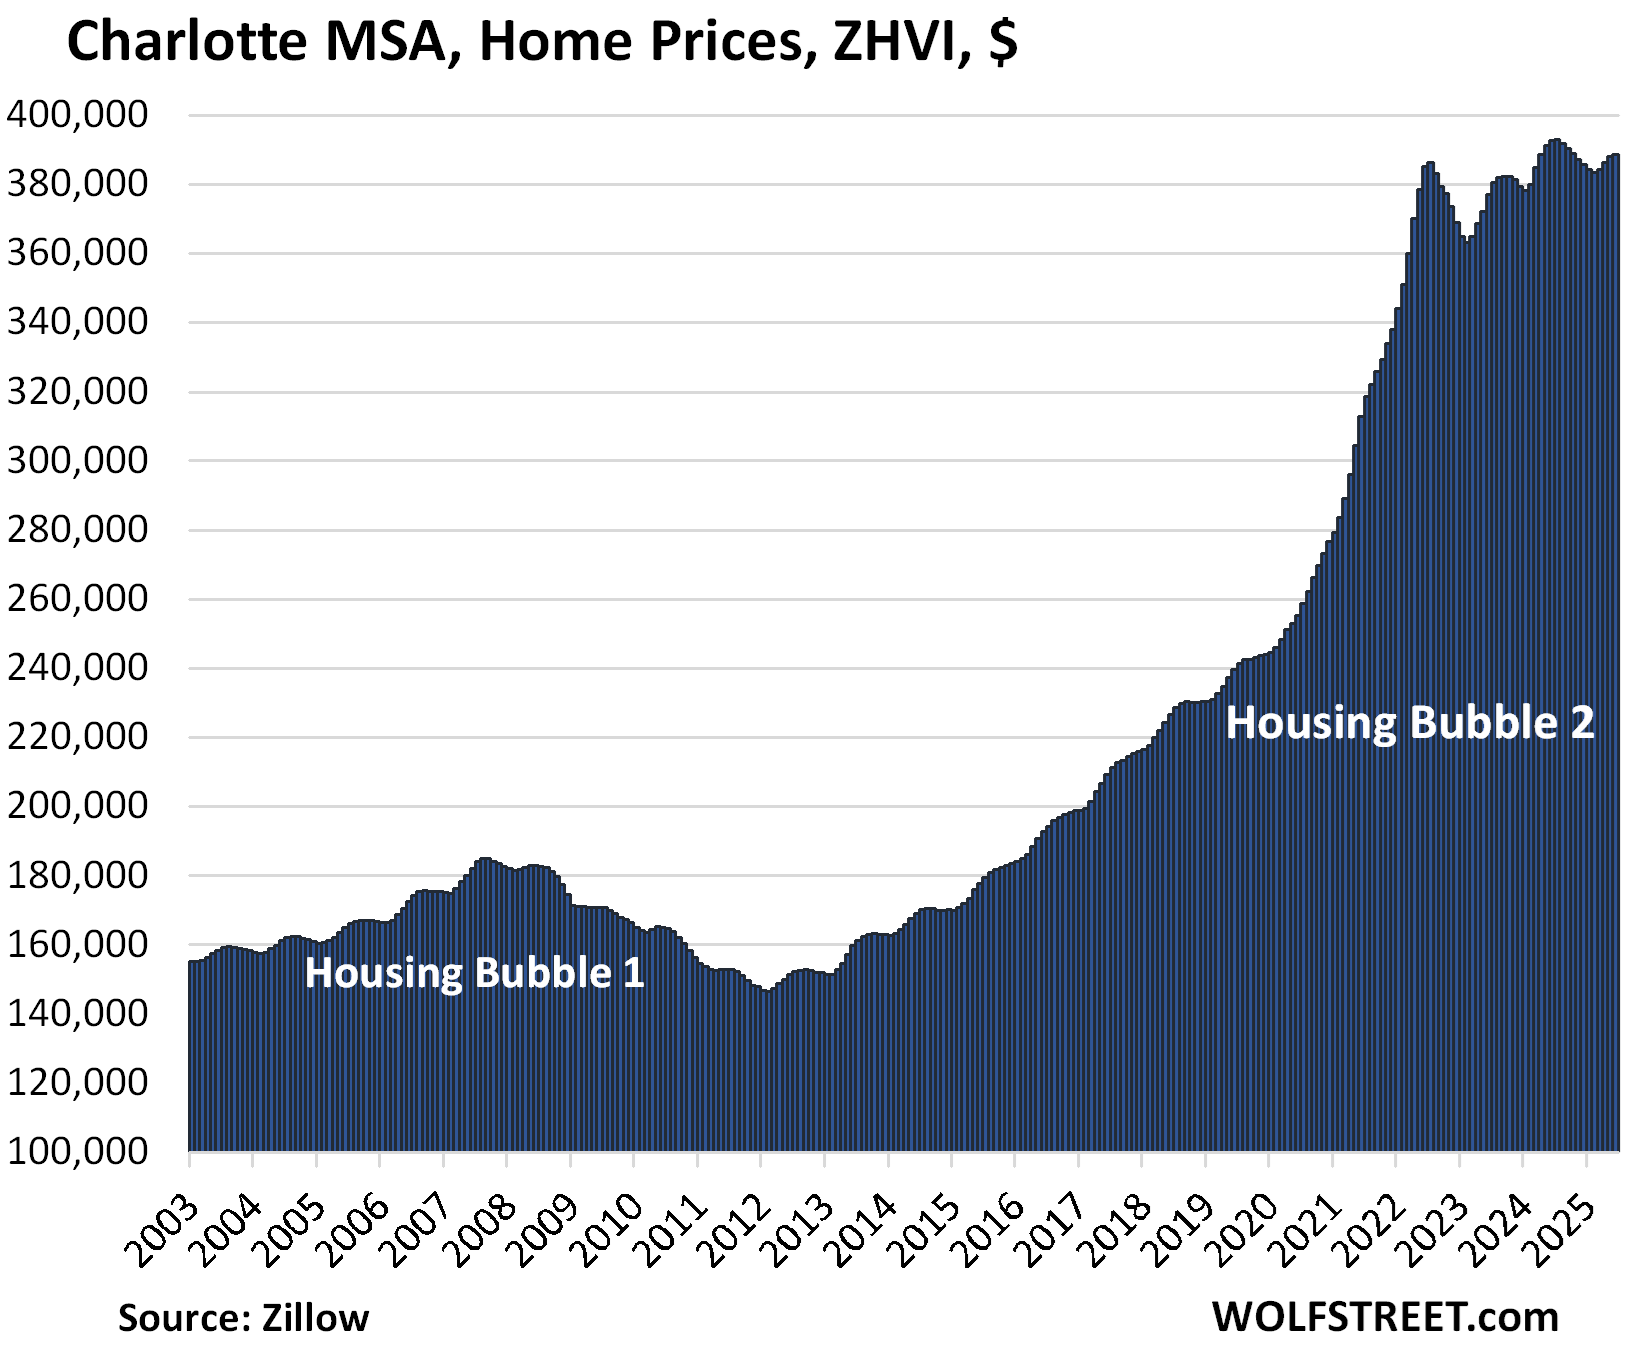
- Charlotte: -1.0%
- San Jose: -0.9%
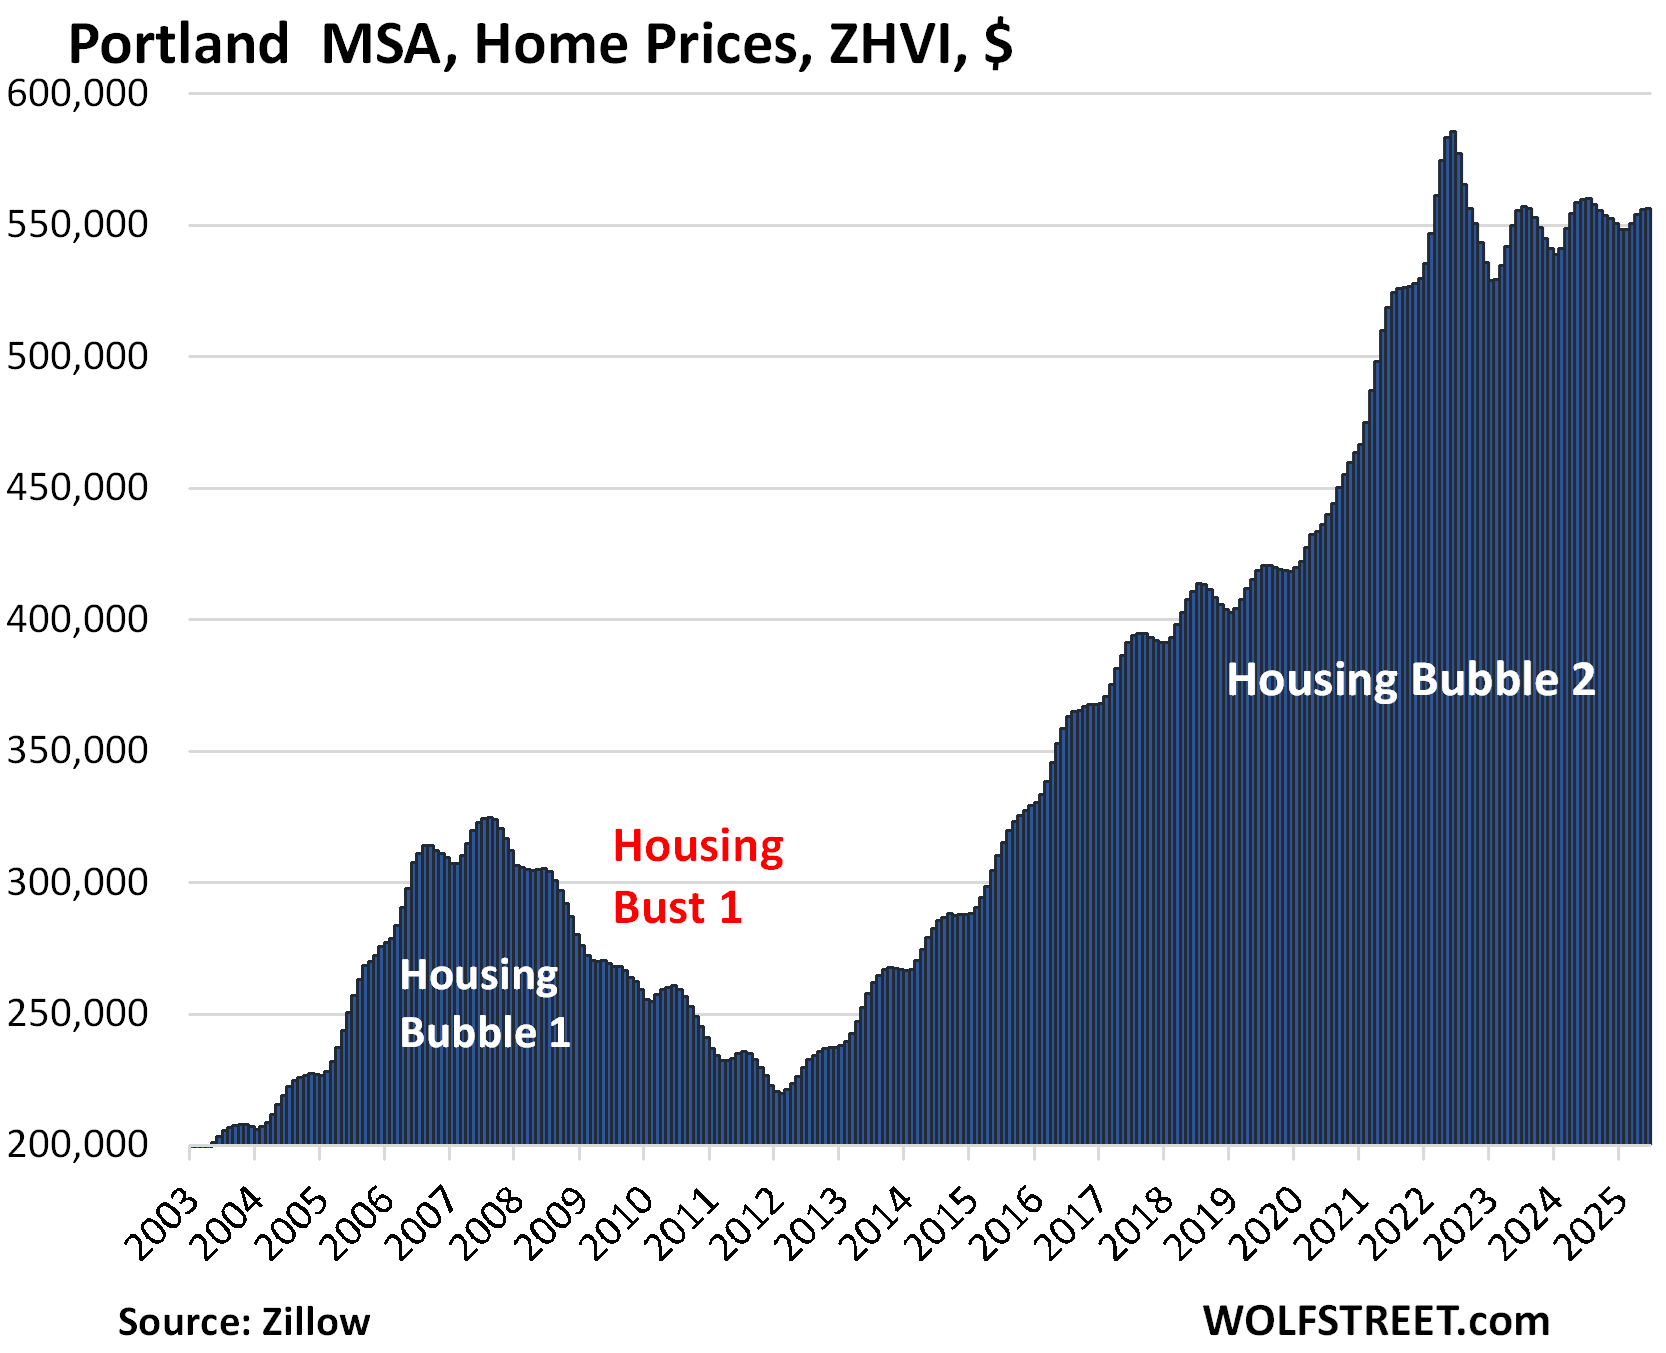
- Portland: -0.7%
- Los Angeles: -0.4%
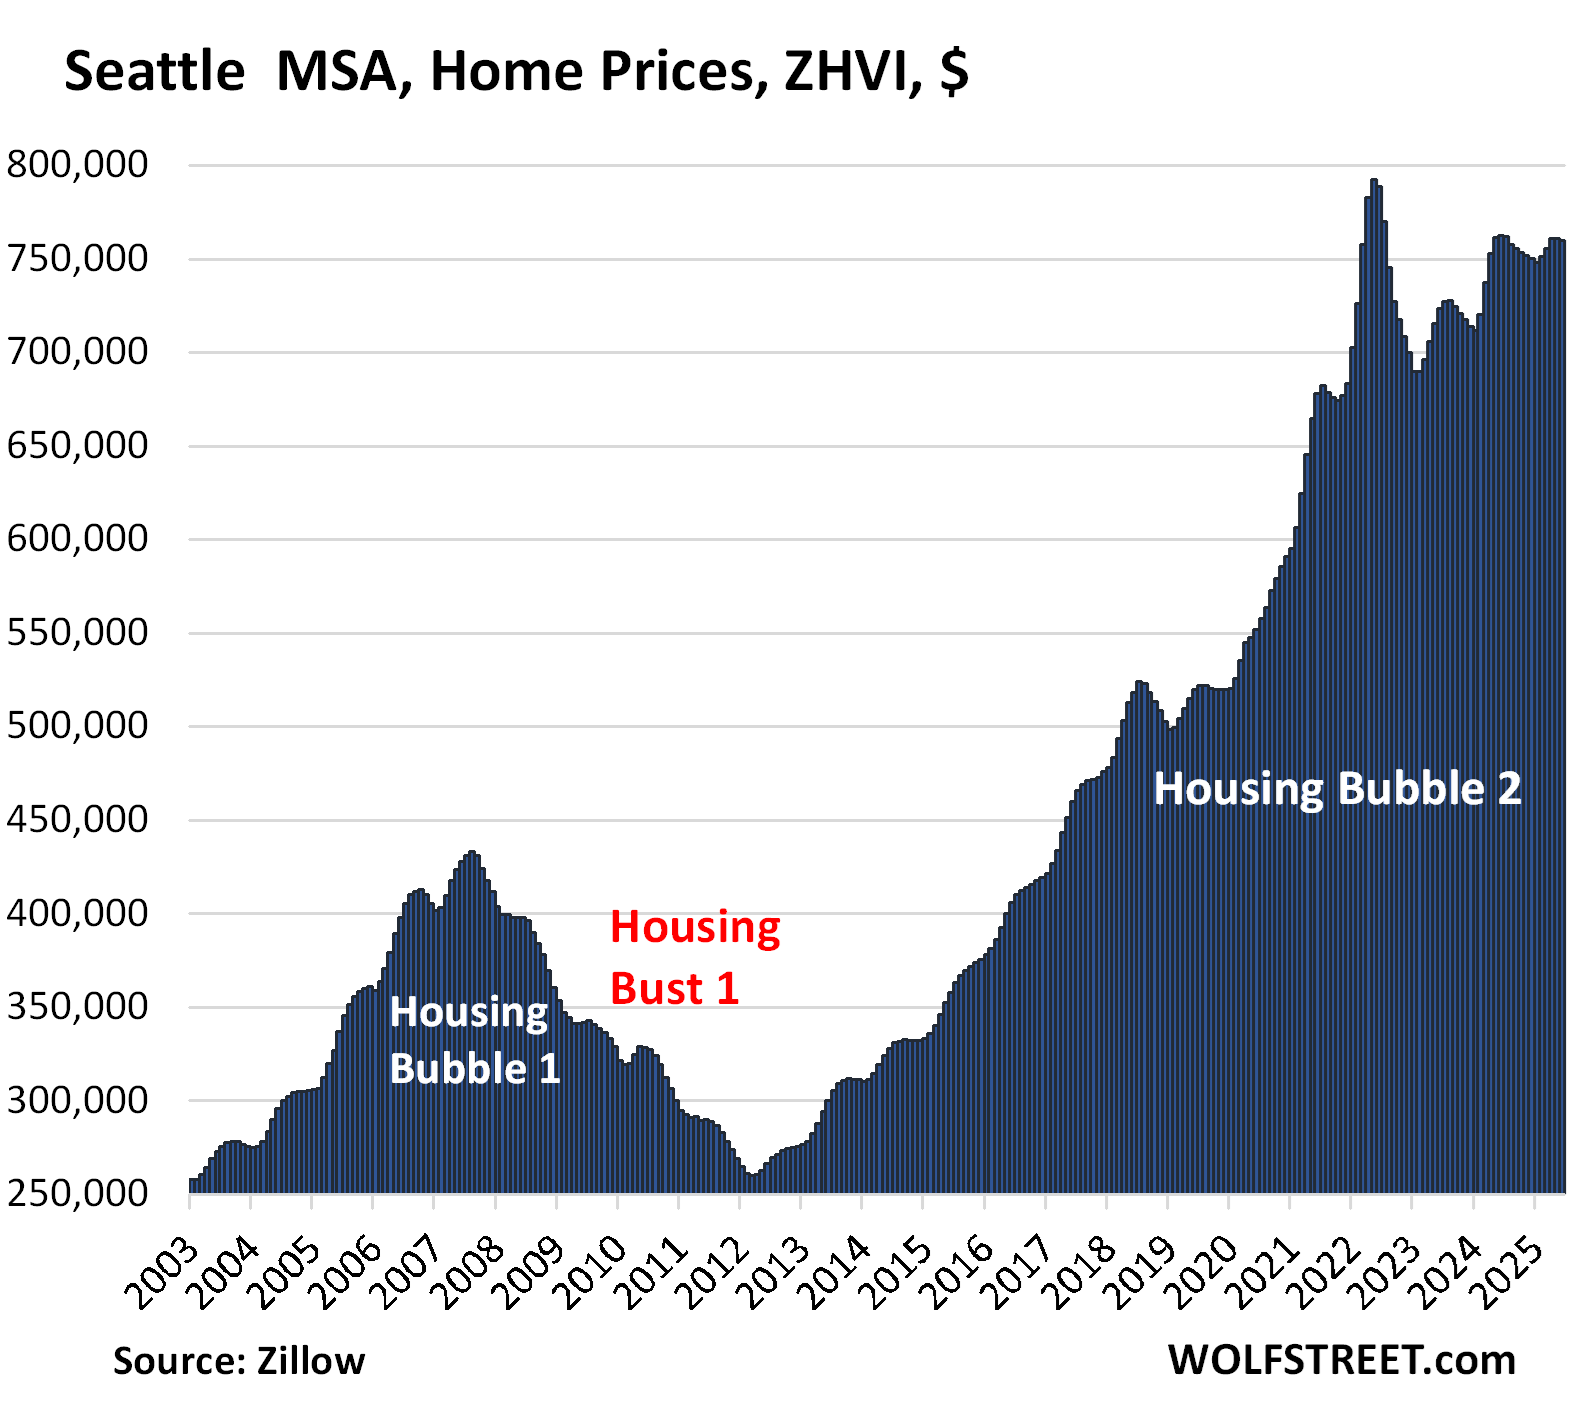
- Seattle: -0.4%
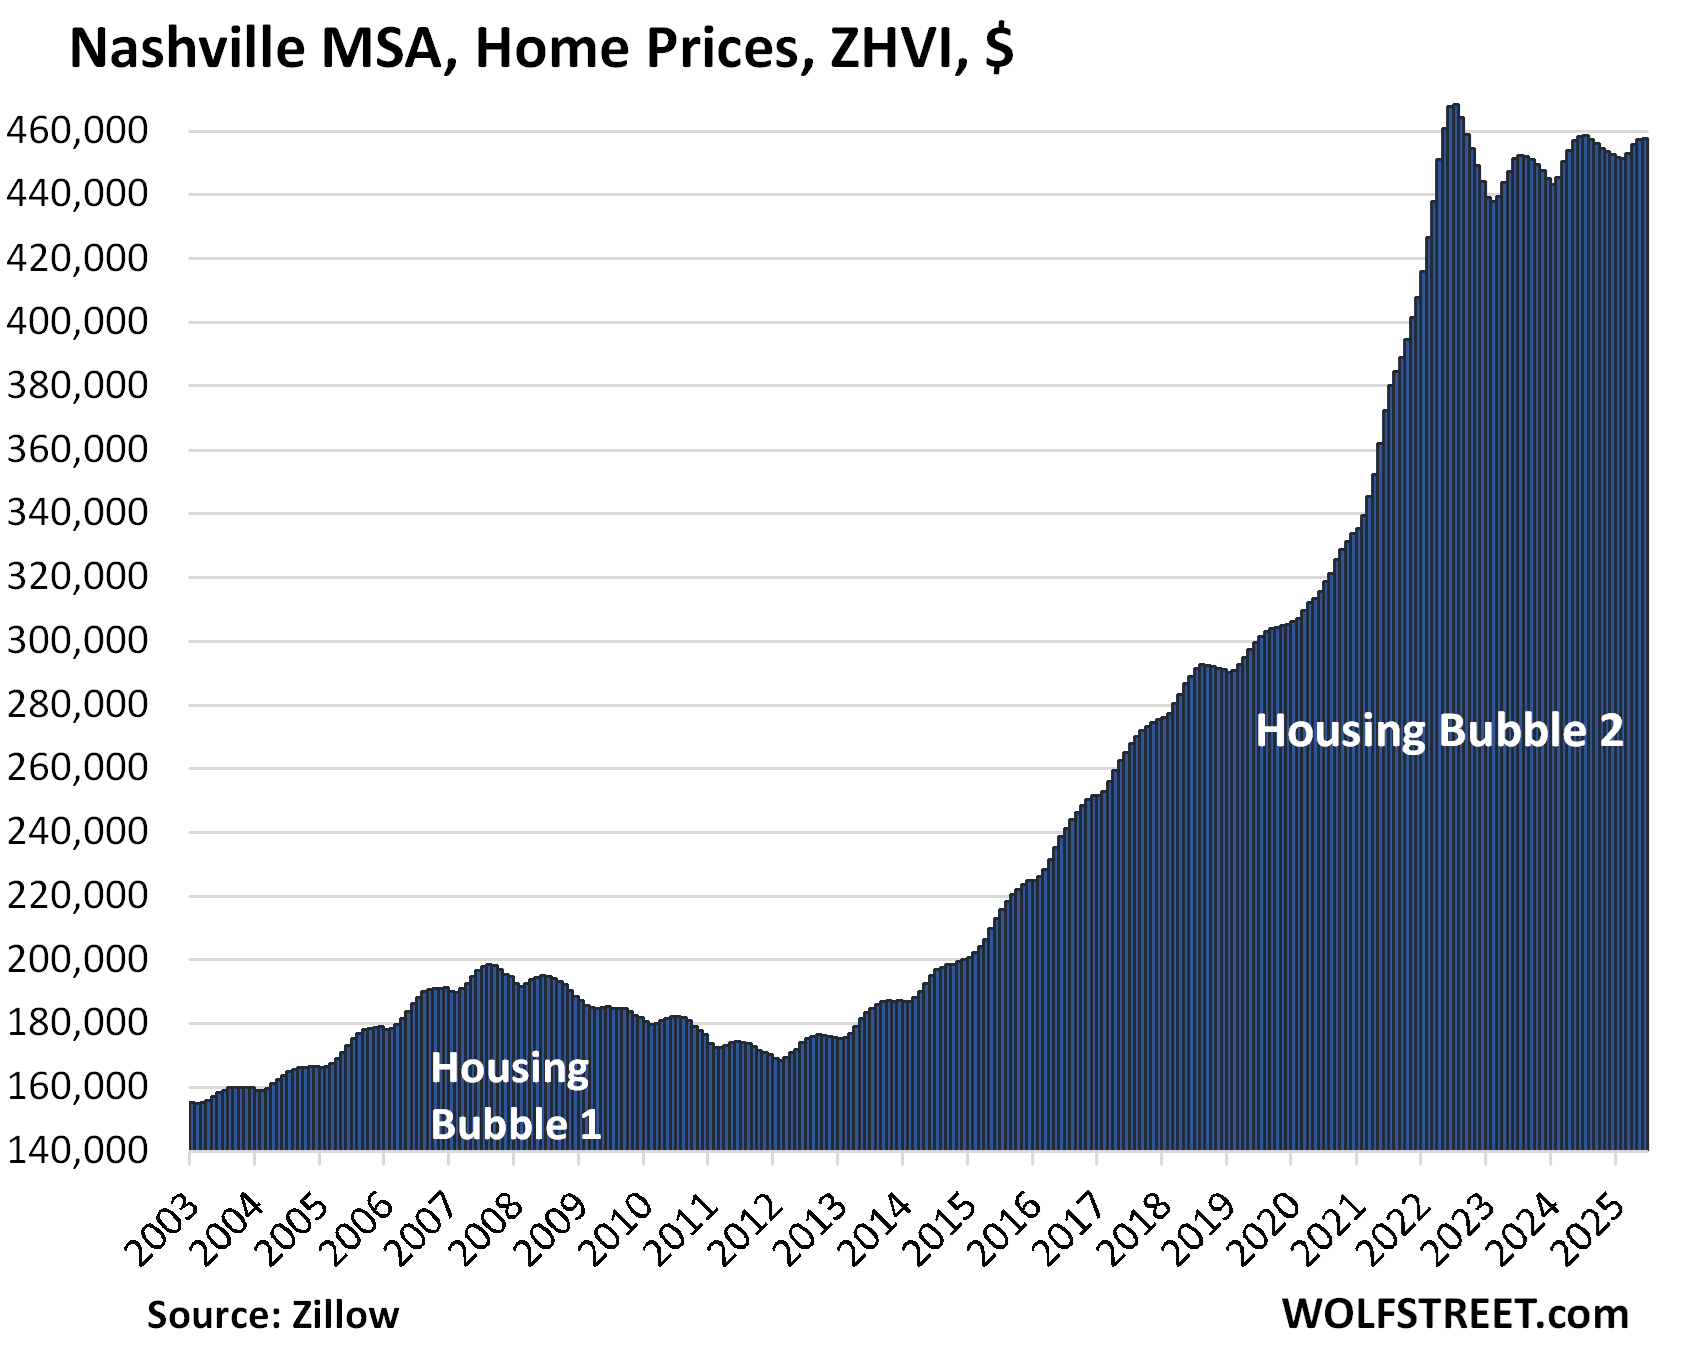
- Nashville: -0.1%
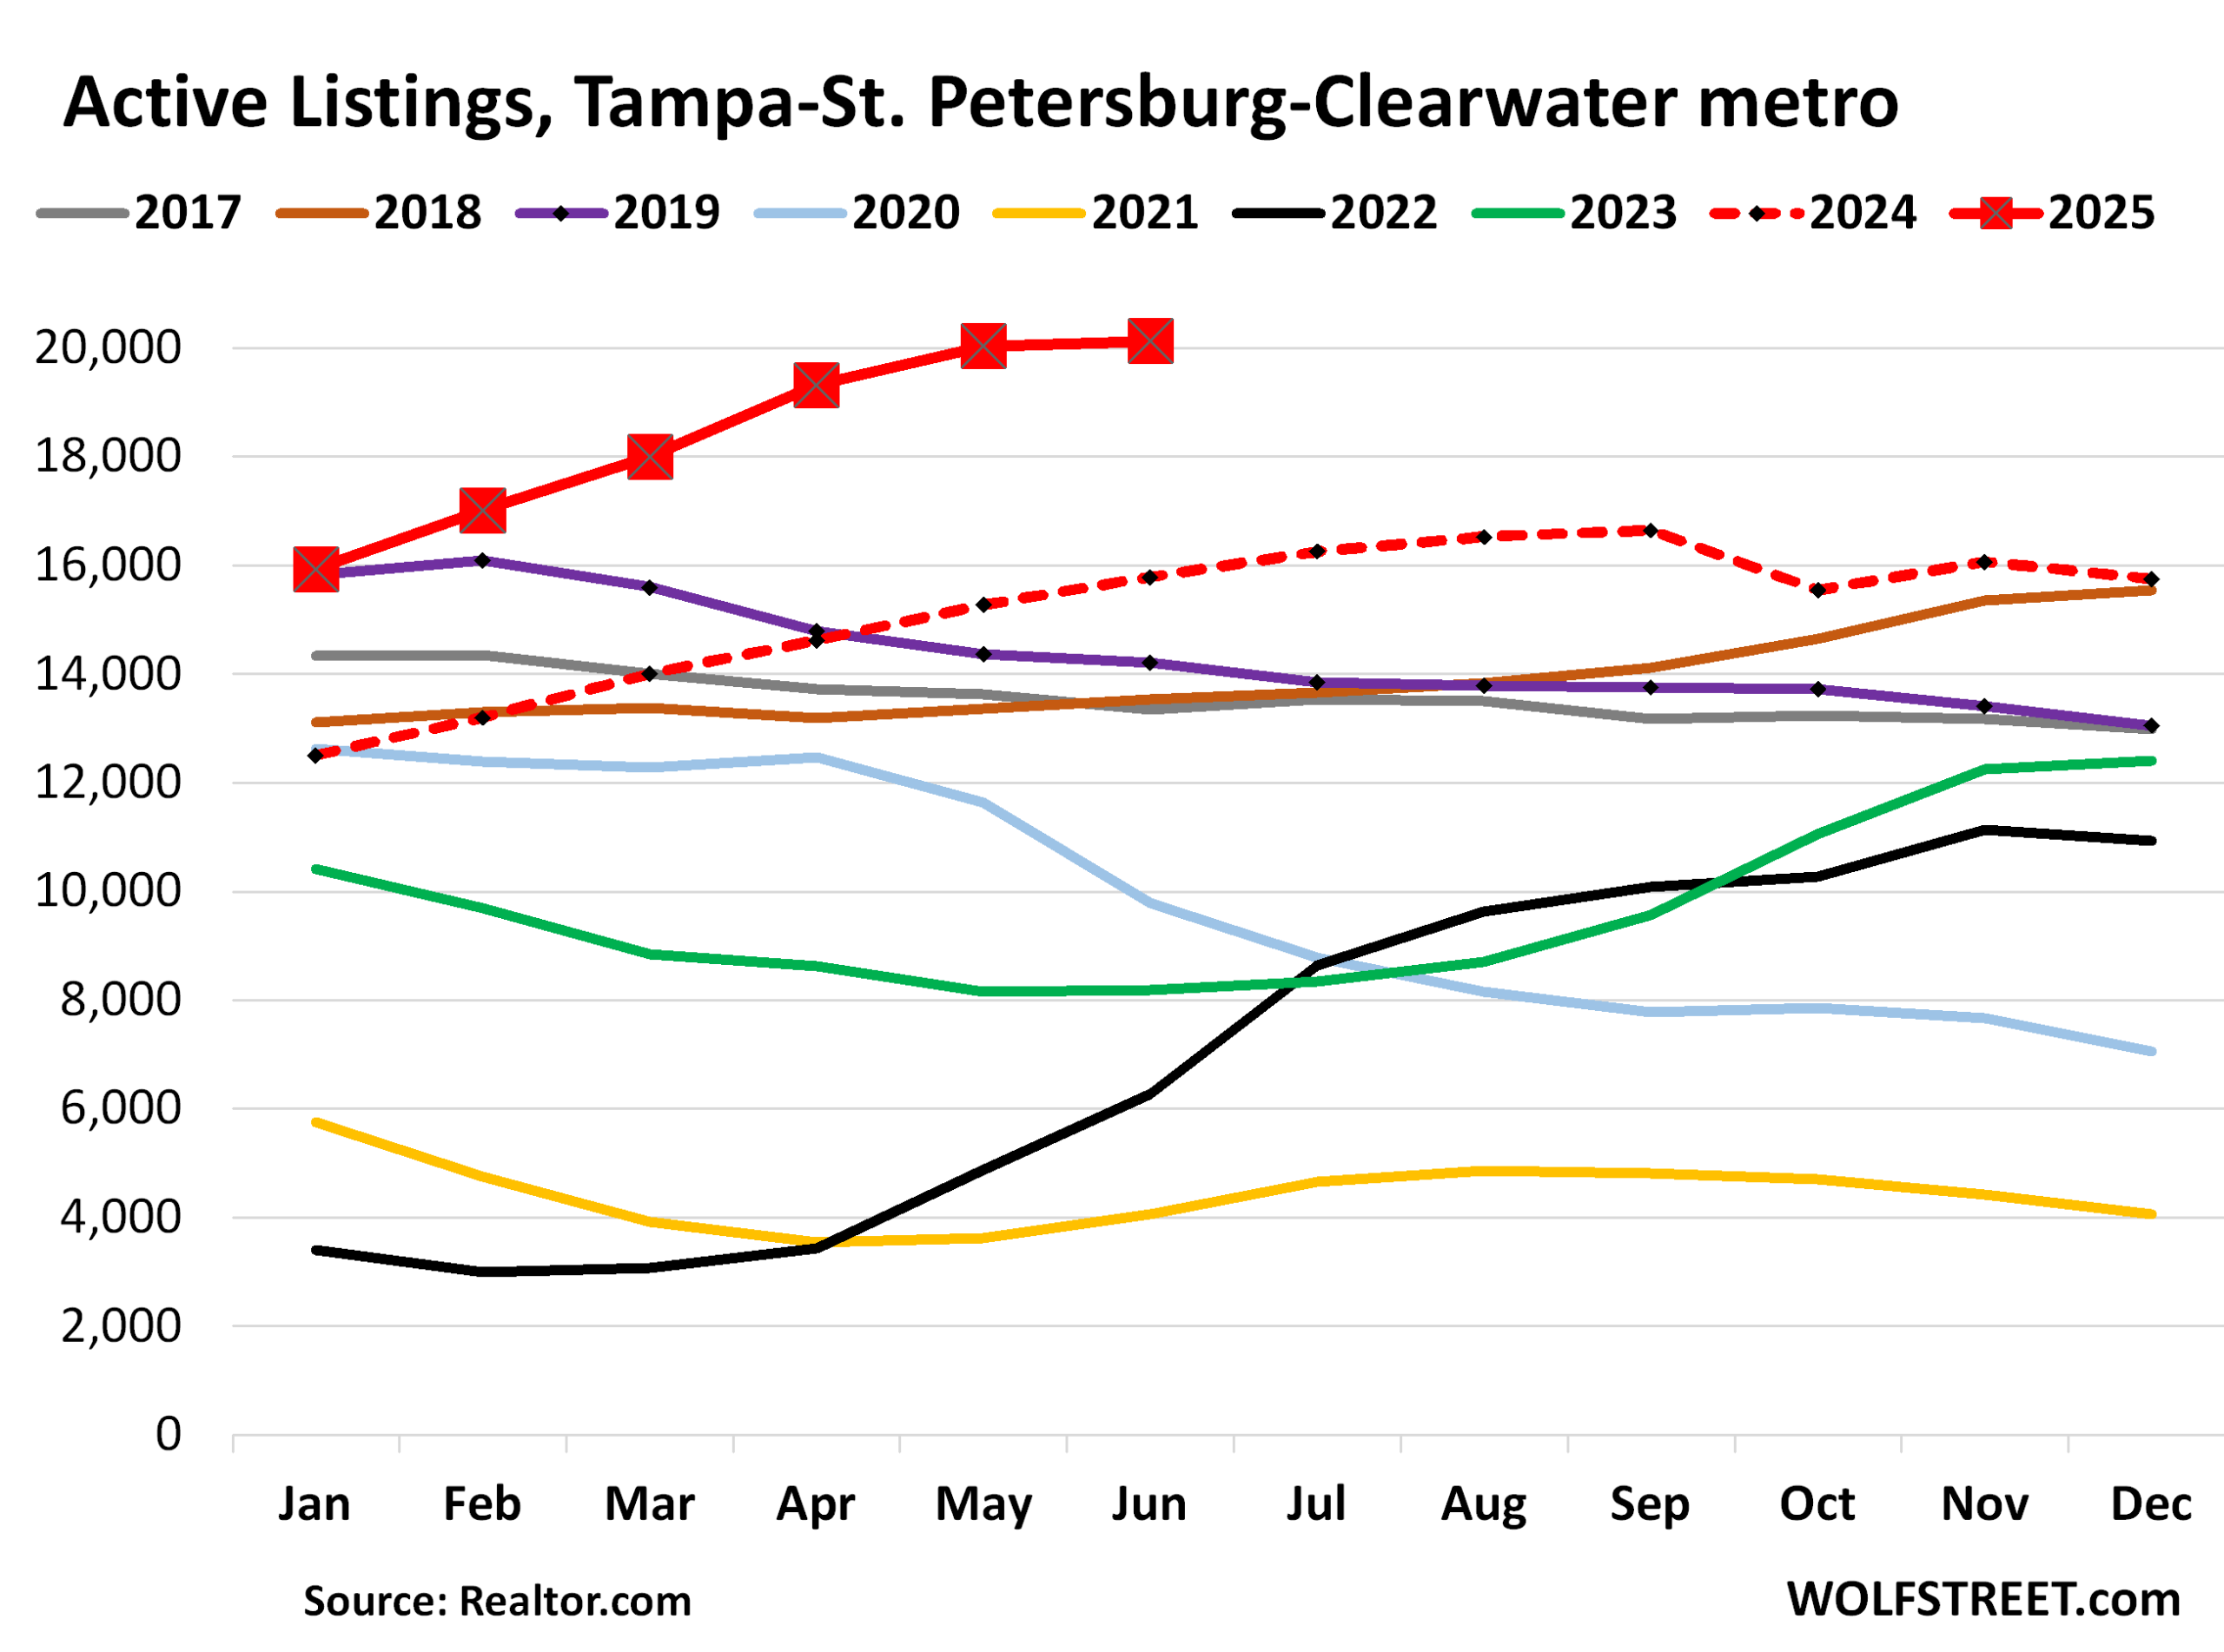
This price action occurred as demand has plunged while supply has surged [Condo Sales Drop to Lowest in the Data, Supply Highest since Housing Bust. Single-Family Home Sales Below 1995, Supply Highest since 2016].
Methodology: All data here is from the “raw” not seasonally adjusted mid-tier Zillow Home Value Index (ZHVI), released today. The ZHVI is based on millions of data points in Zillow’s “Database of All Homes,” including from public records (tax data), MLS, brokerages, local Realtor Associations, real-estate agents, and households across the US. It includes pricing data for off-market deals and for-sale-by-owner deals. Zillow’s Database of All Homes also has sales-pairs data.
To qualify for this list, the MSA must be one of the largest by population and must have had a ZHVI of at least $300,000 at some point. Some metros that are large enough don’t qualify for this list because their ZHVI has never reached $300,000, despite the blistering surge of home prices in recent years, such as the metros of New Orleans, Memphis, Oklahoma City, Tulsa, Cincinnati, and Pittsburgh.
The 19 metros whose prices are down from their 2022 highs.
Led by these metros with percentage declines from their highs in 2022:
- Austin: -23.3%
- Phoenix: -10.2%
- San Francisco: -10.2%
- San Antonio: -8.8%
- Denver: -7.6%
- Dallas: -6.9%
- Tampa: -6.7%
- Sacramento: -6.6%
- Honolulu: -5.7%
- Portland: -5.0%
- Seattle: -4.2%
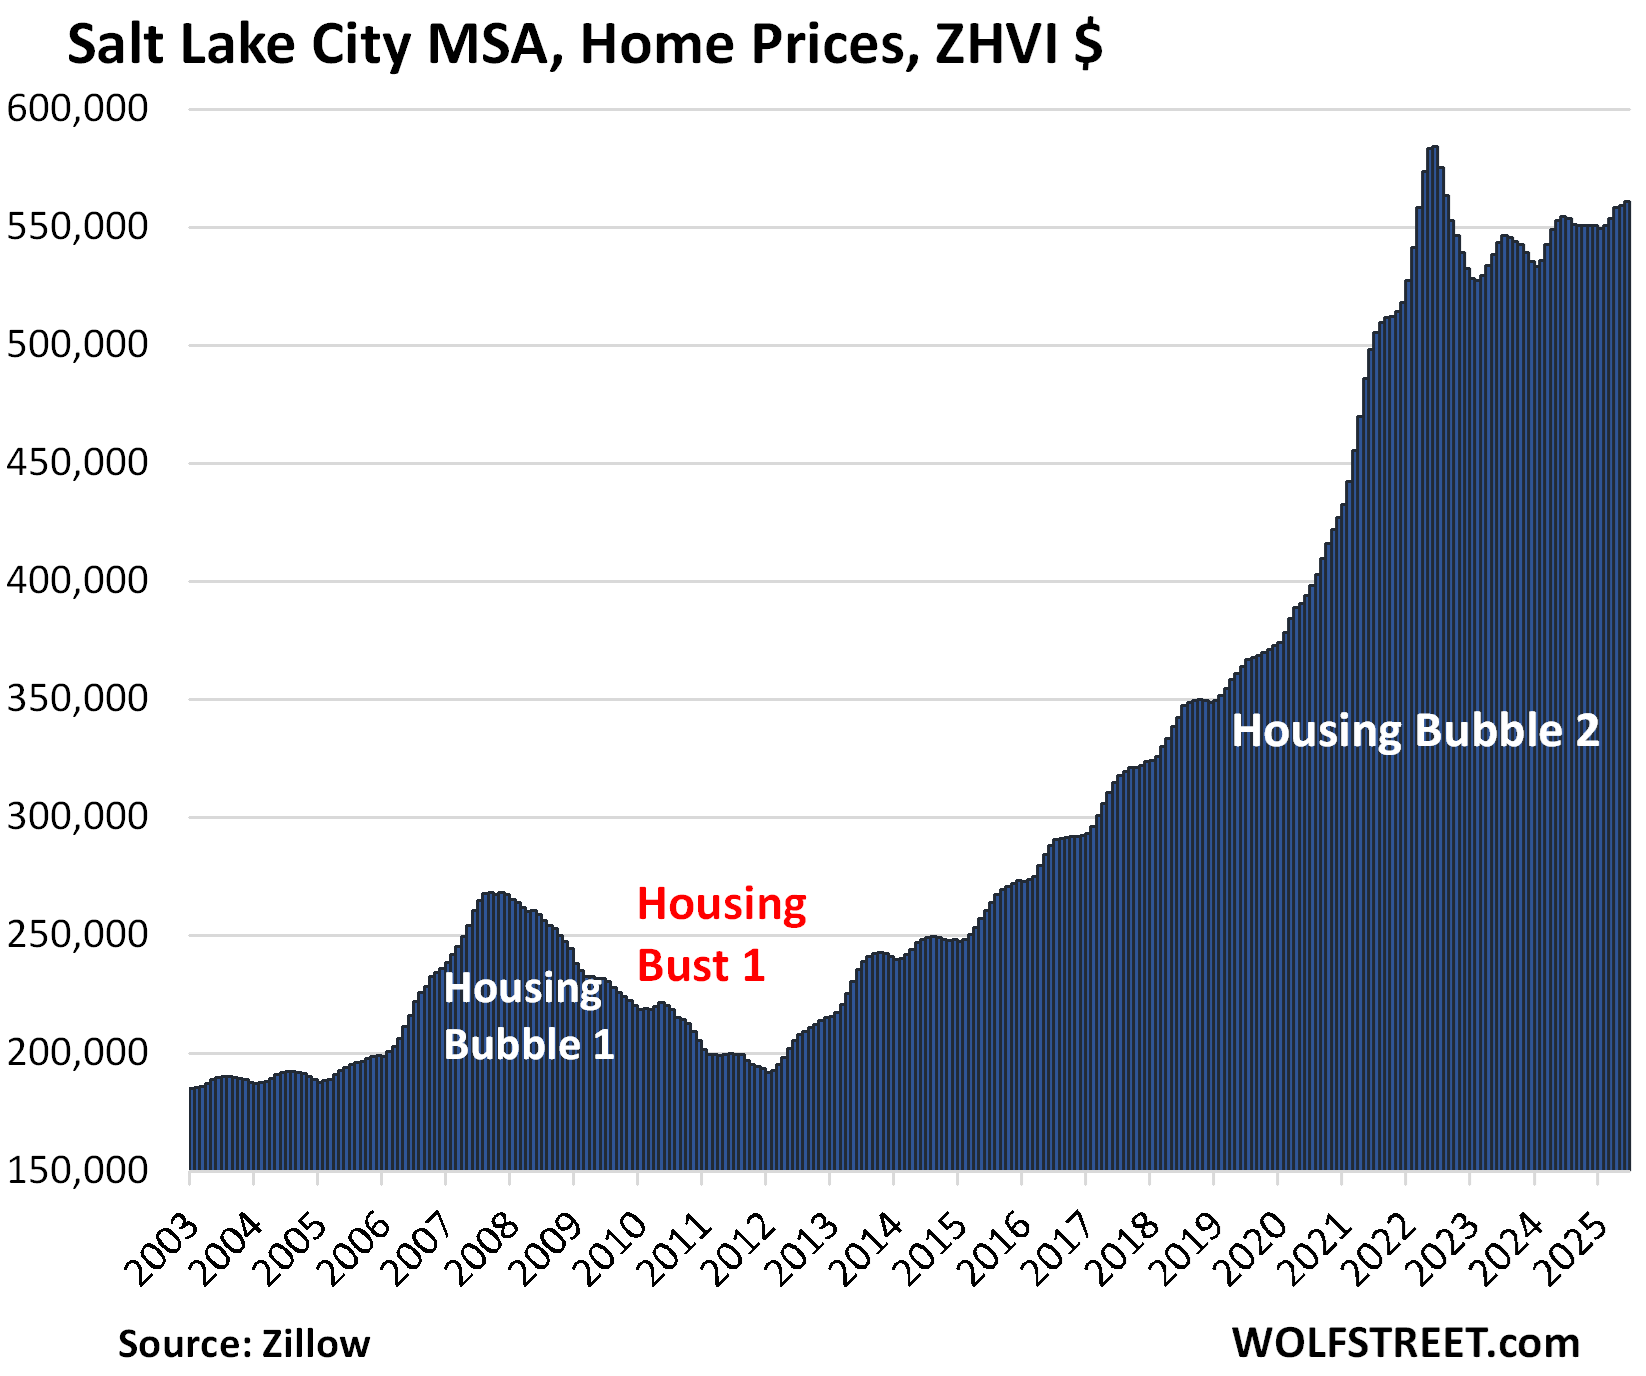
- Salt Lake City: -4.0%
- Raleigh: -3.8%
In the little tables, MoM = month over month; YoY = year-over-year. Also note the percentage increase since 2000 in the right column.
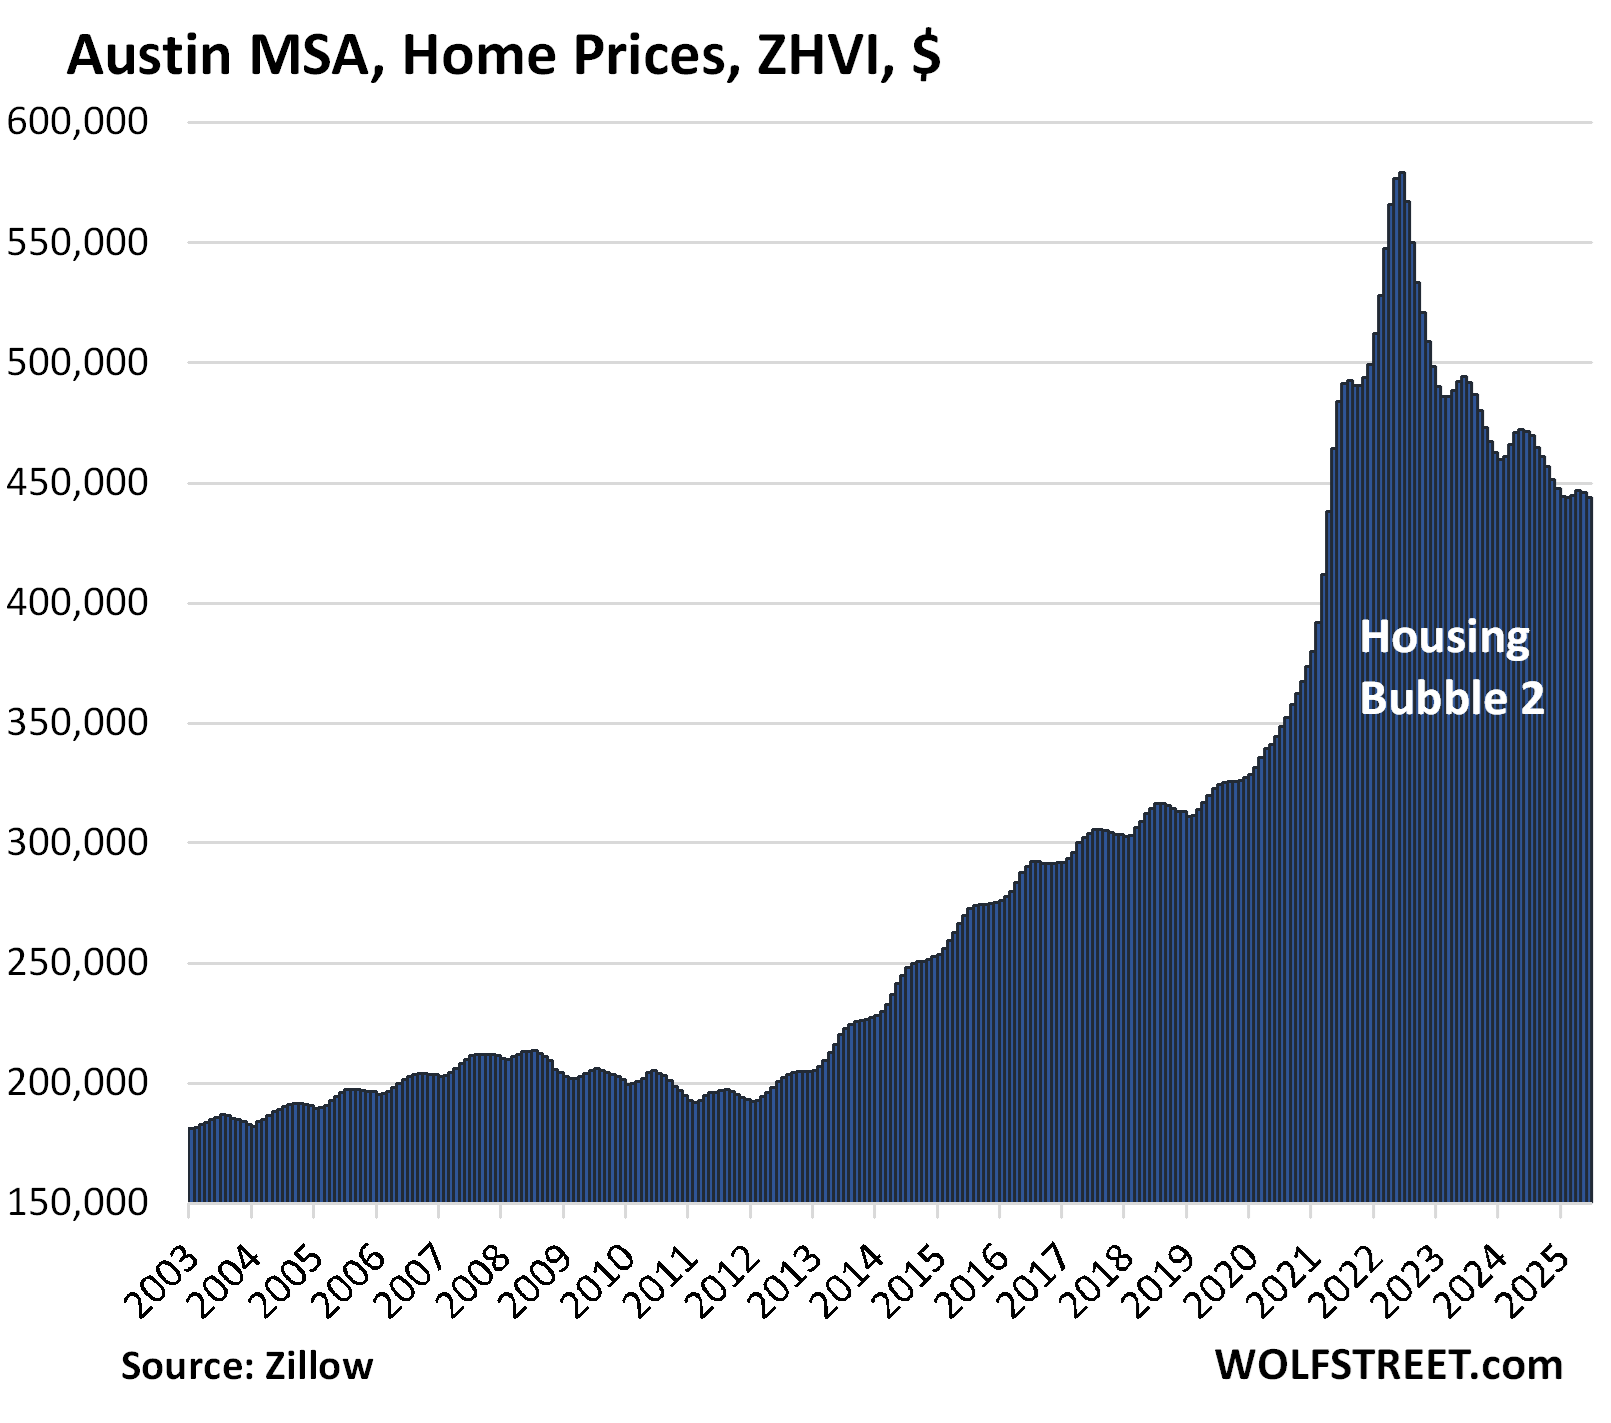
| Austin MSA, Home Prices | |||
| From Jun 2022 peak | MoM | YoY | Since 2000 |
| -23.3% | -0.5% | -5.8% | 153% |
Prices are back where they’d been in April 2021. Charts like these document absurd housing markets:
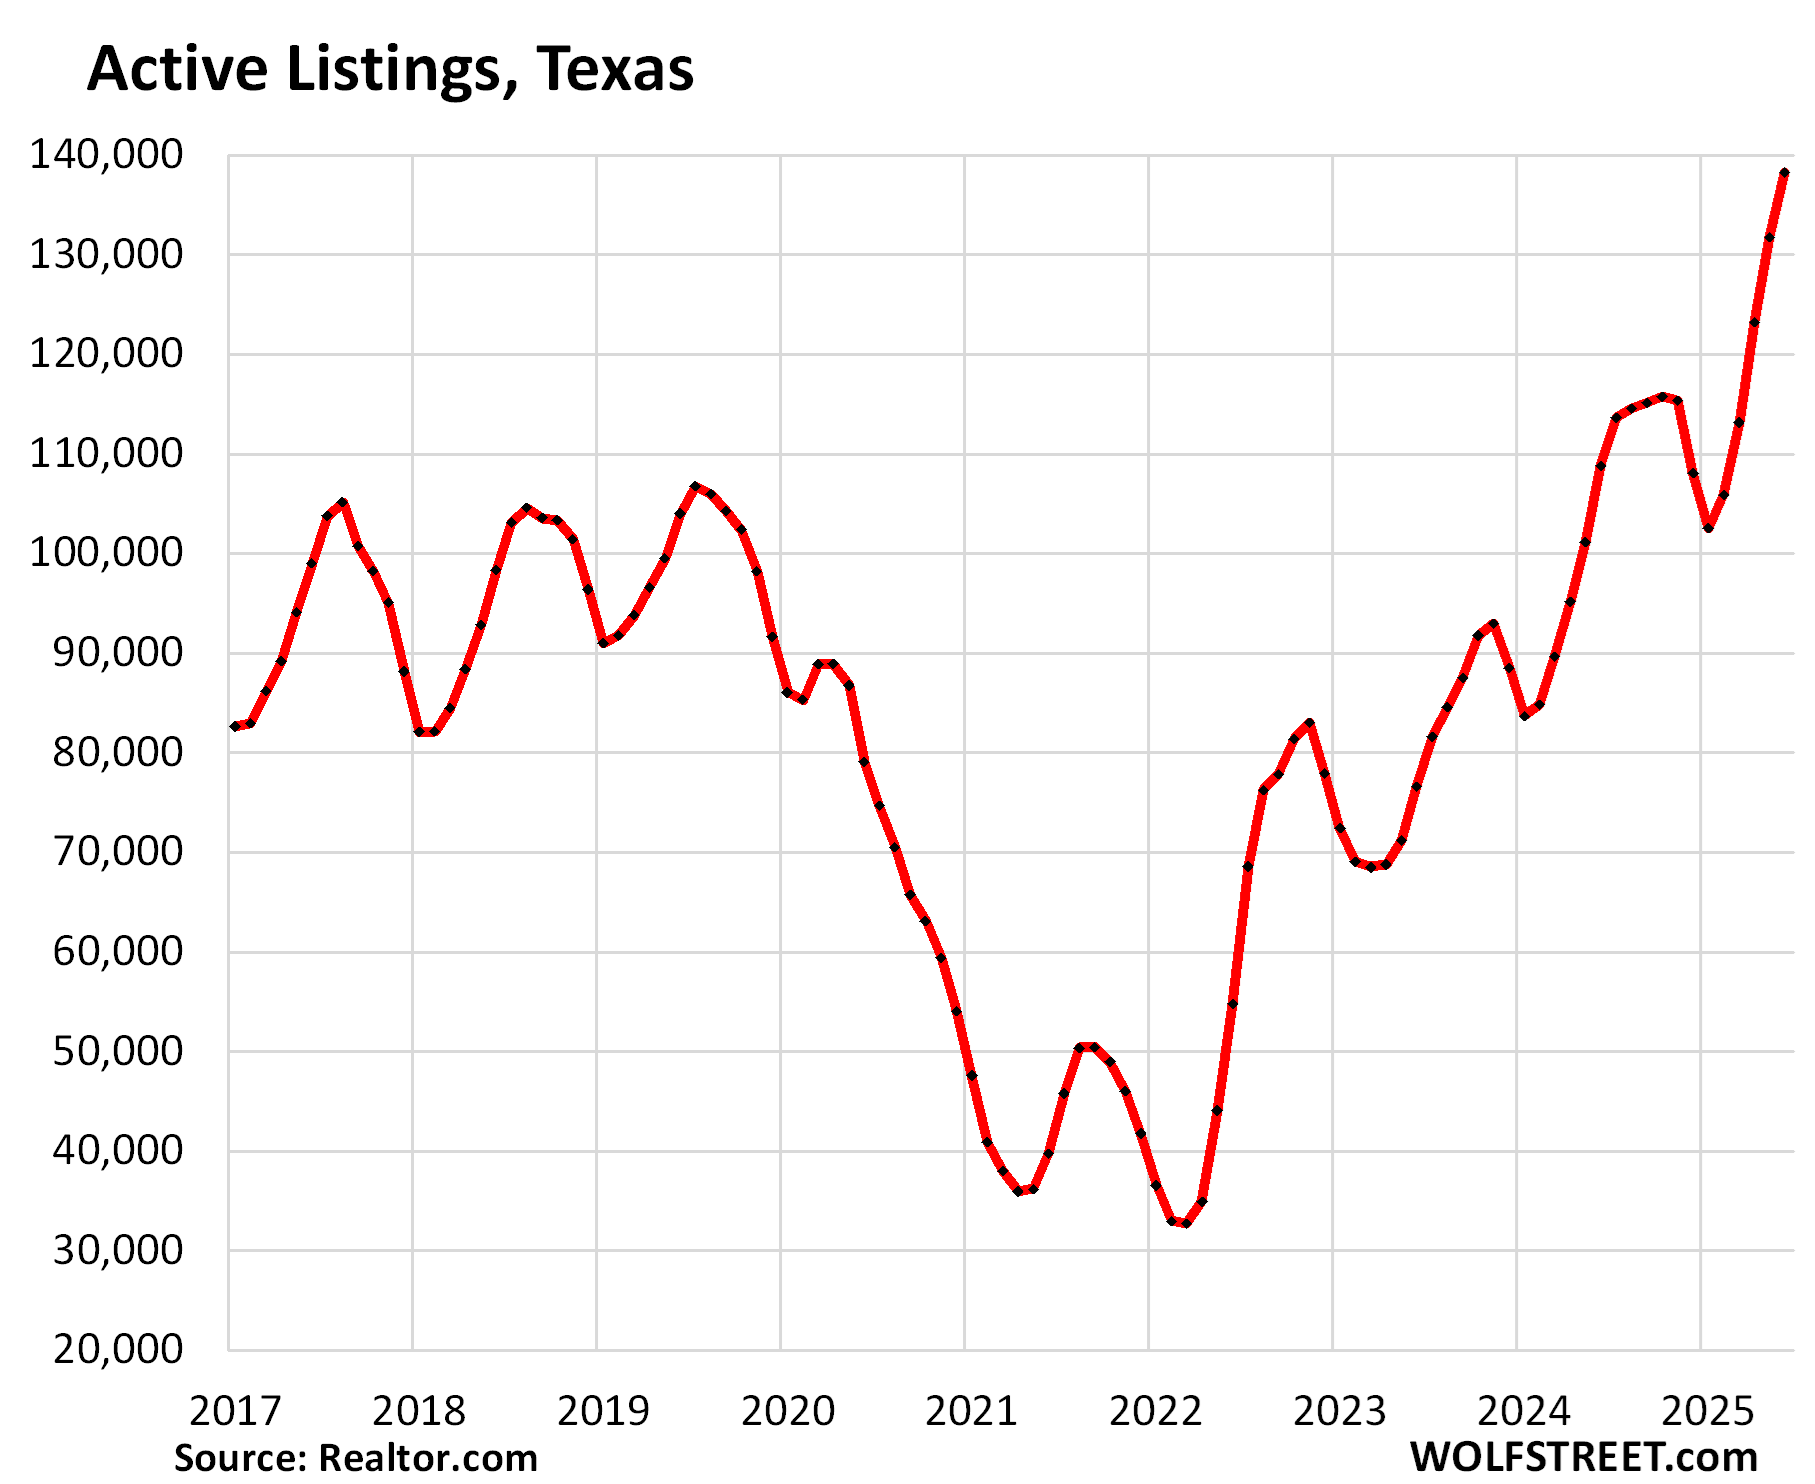
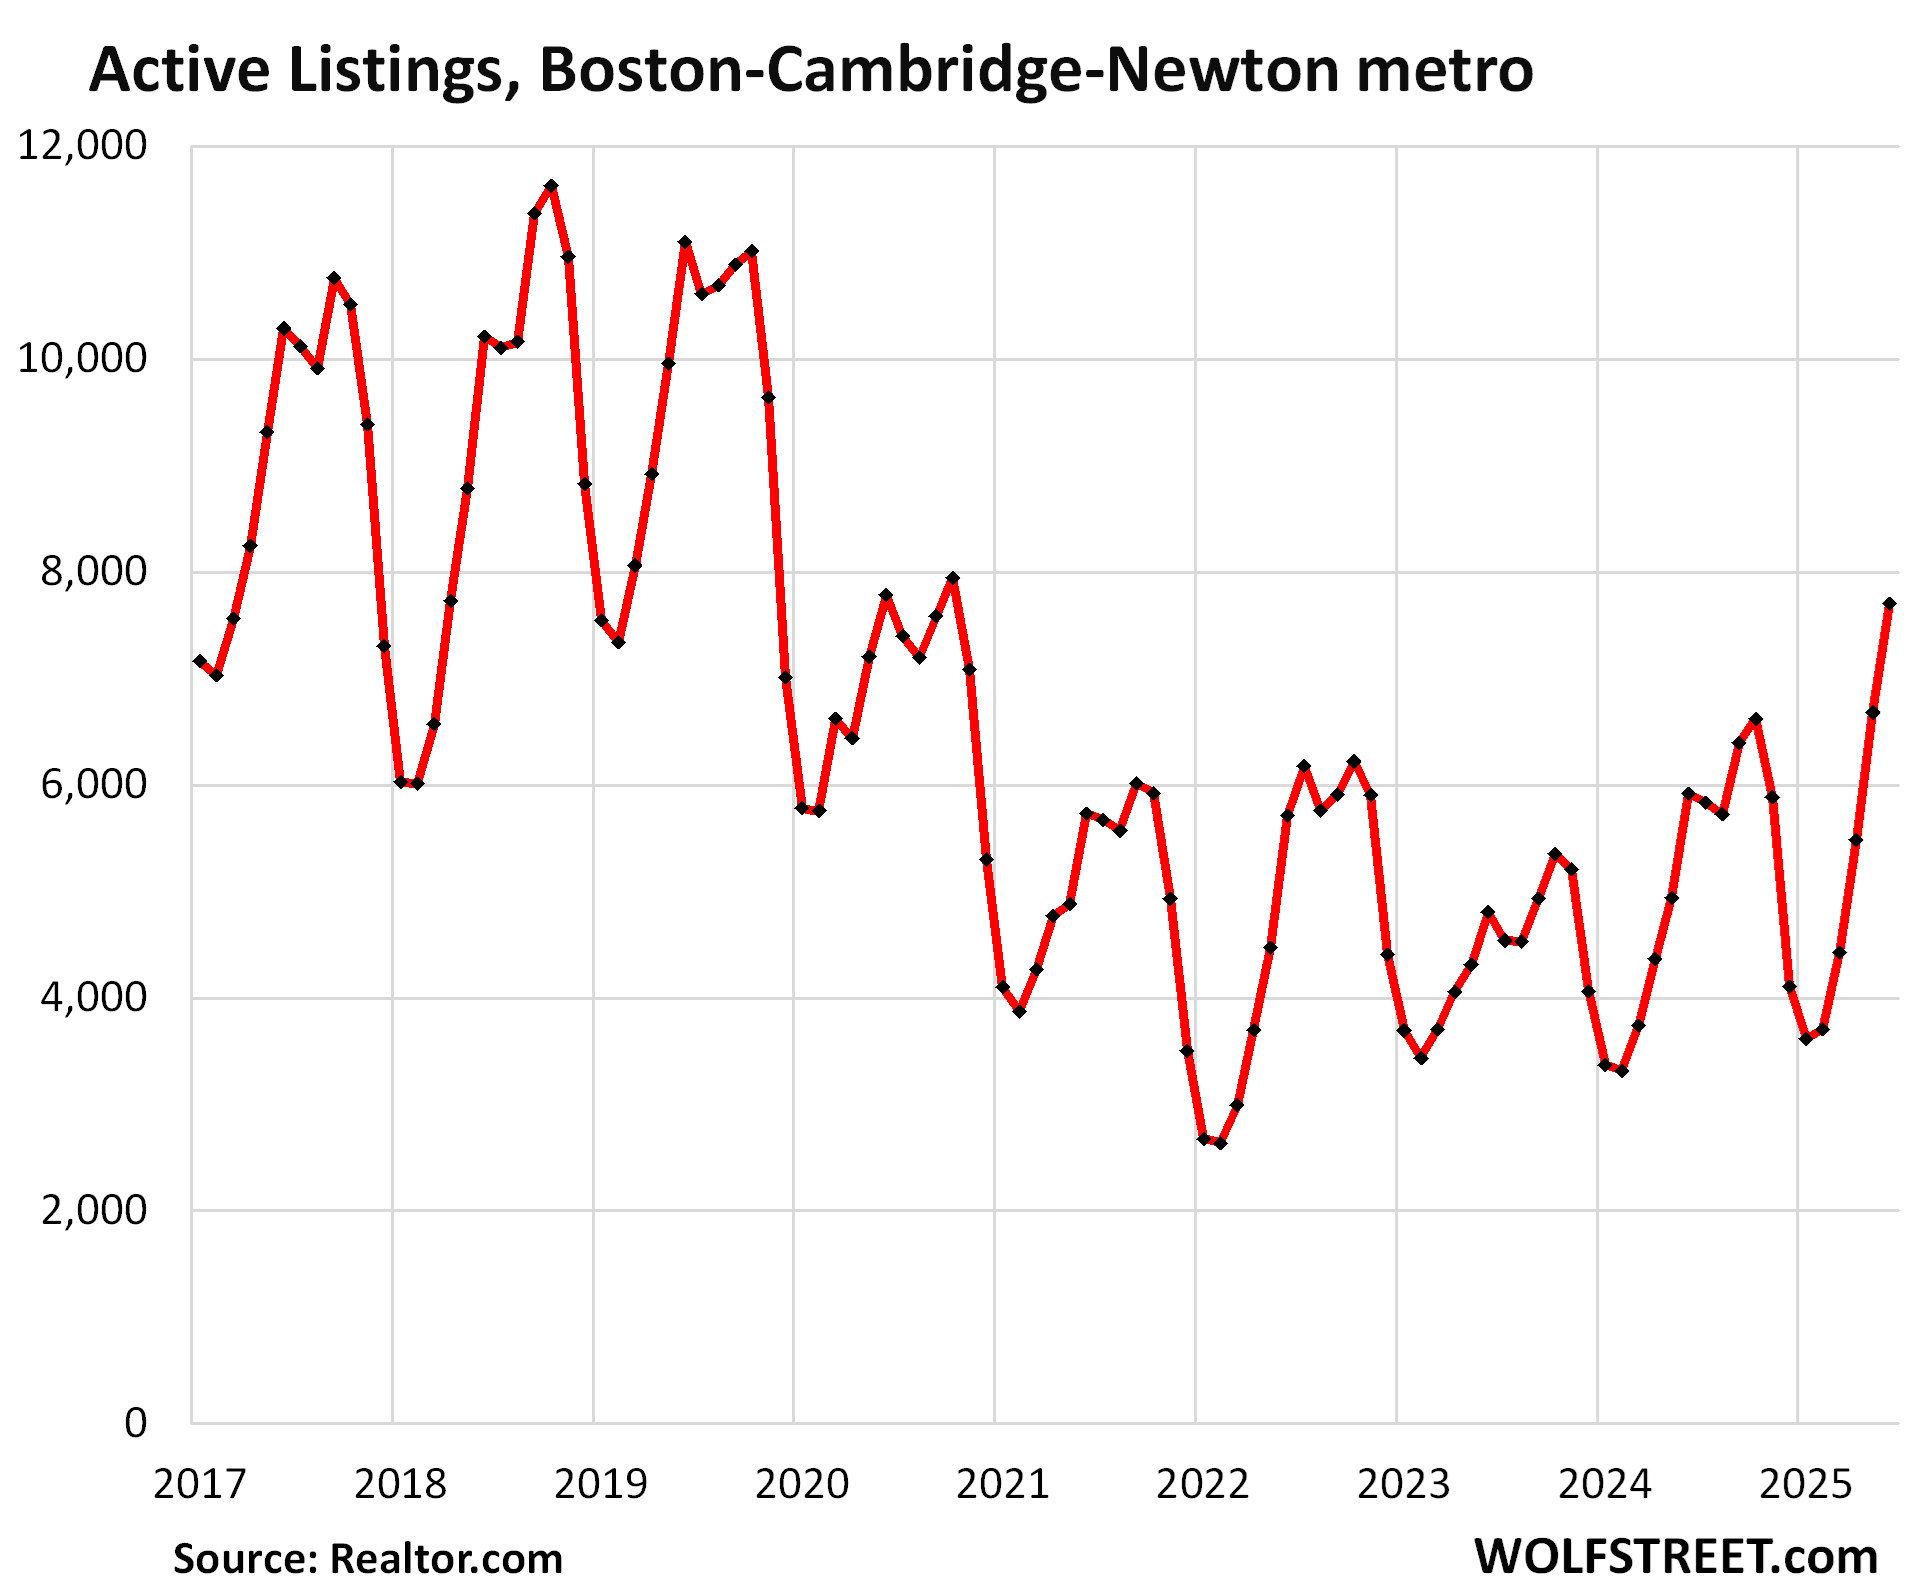
Here is what home inventories in Texas look like:
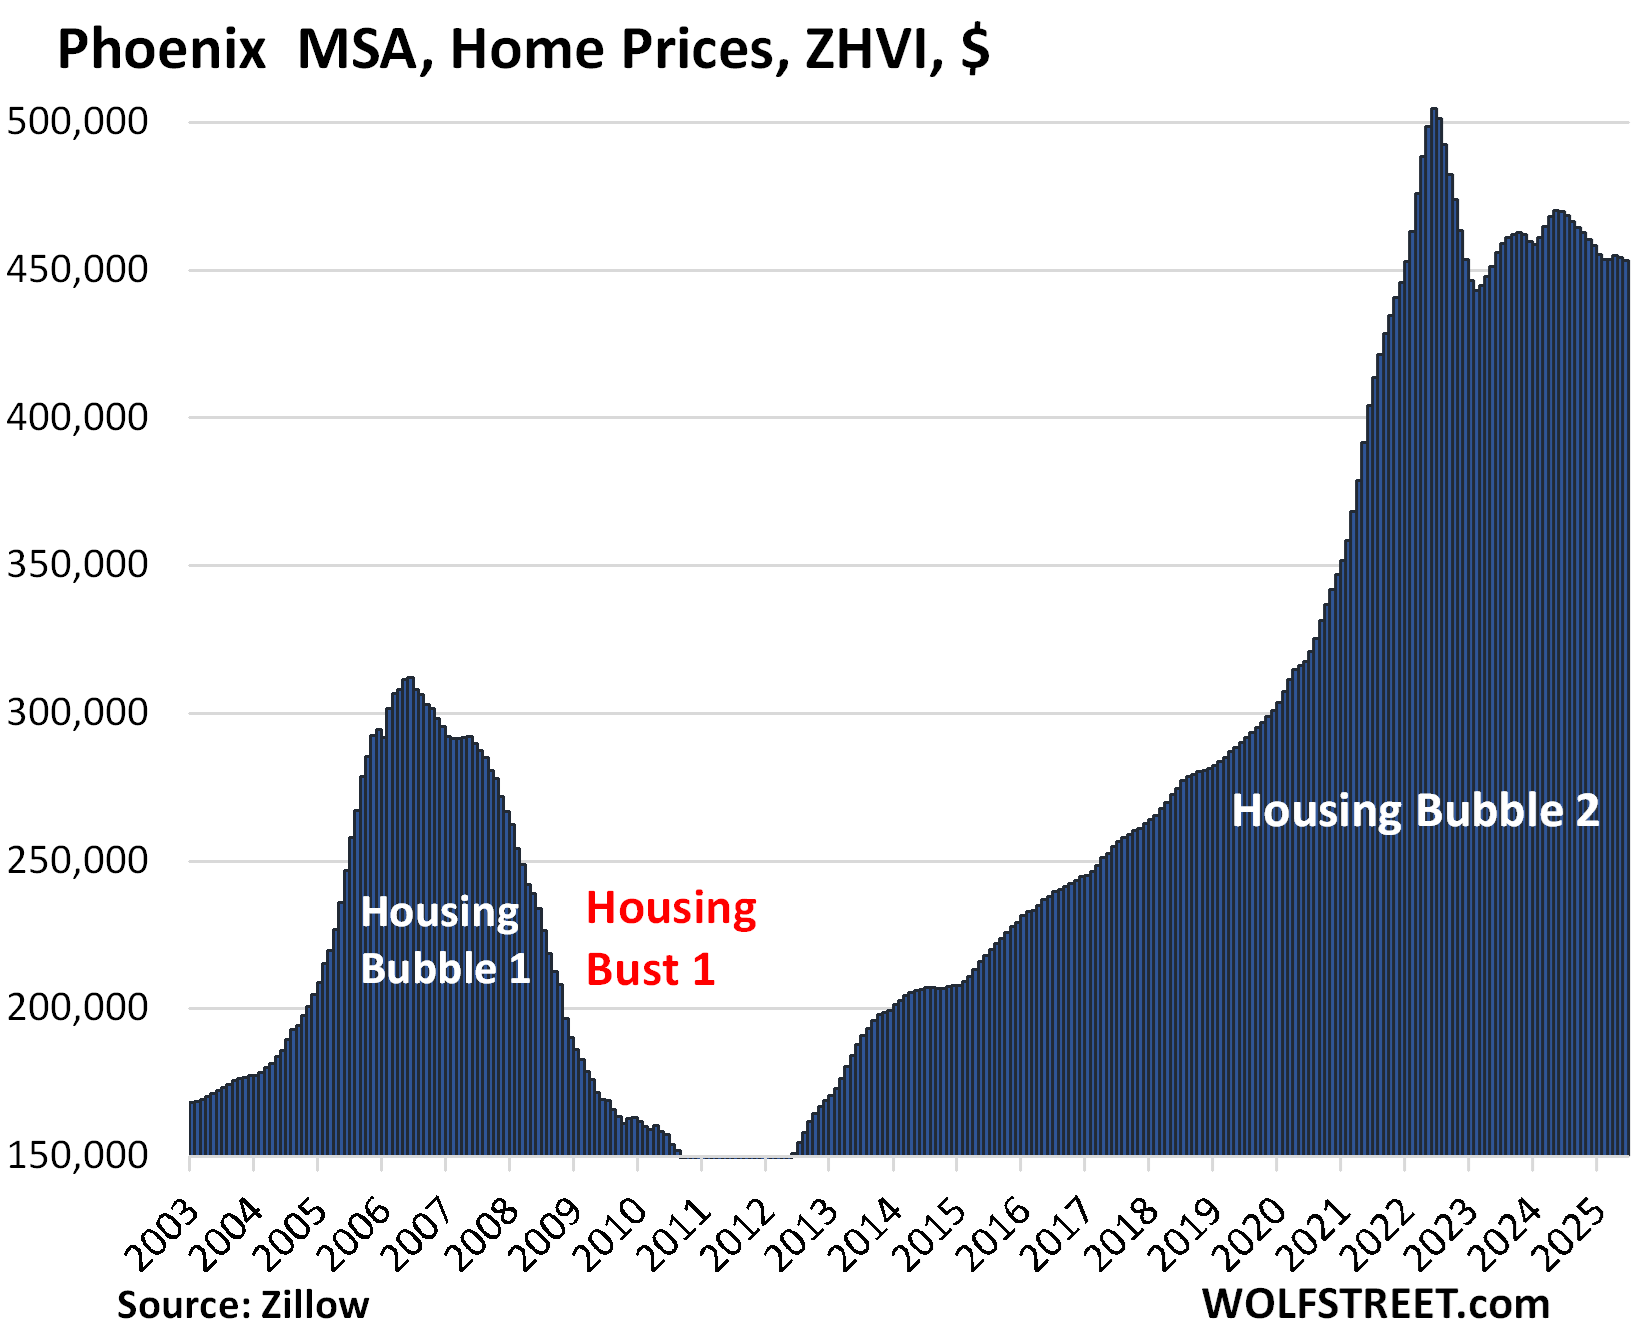
| Phoenix MSA, Home Prices | |||
| From Jun 2022 peak | MoM | YoY | Since 2000 |
| -10.2% | -0.2% | -3.5% | 216% |
| San Francisco MSA, Home Prices | |||
| From May 2022 peak | MoM | YoY | Since 2000 |
| -10.2% | -0.8% | -3.4% | 292% |
The MSA includes San Francisco, much of the East Bay (such as Oakland), much of the North Bay, and goes south on the Peninsula into Silicon Valley through San Mateo County. It does not include the San Jose metro, which covers the southern portion of the Bay Area (see below).
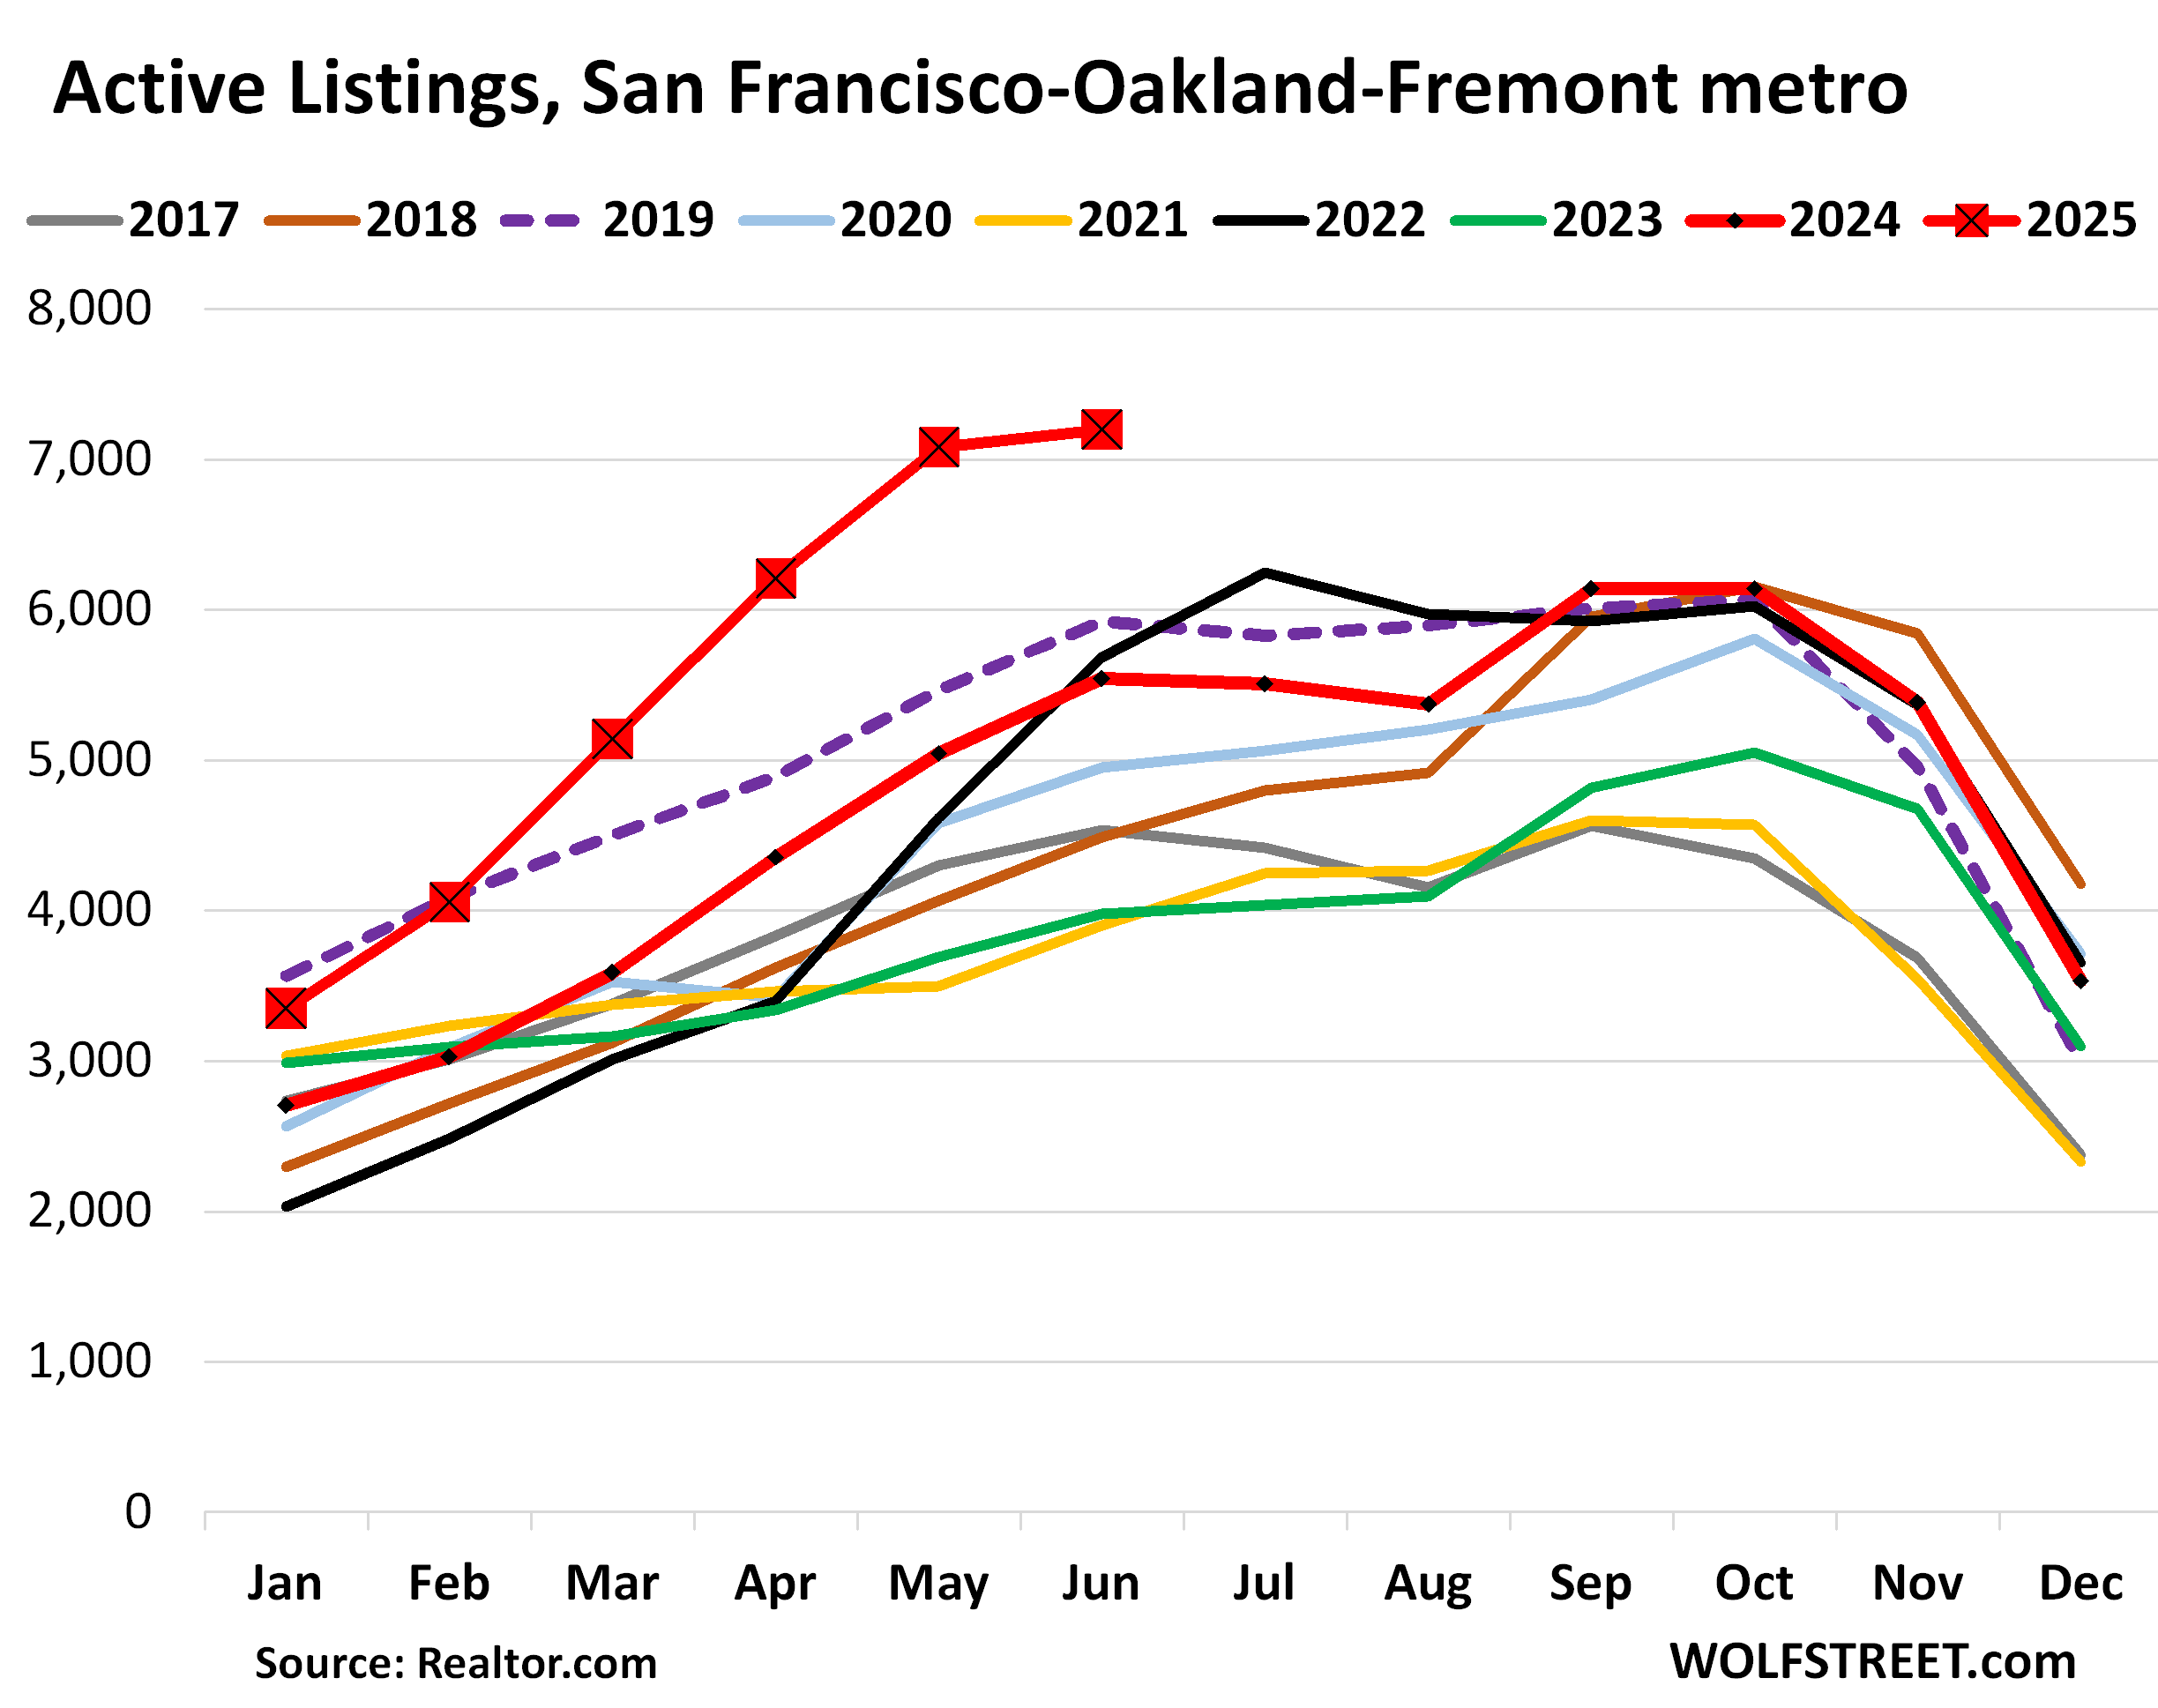
And the inventories in the San Francisco metro:
| San Antonio MSA, Home Prices | |||
| From Jul 2022 peak | MoM | YoY | Since 2000 |
| -8.8% | 0.1% | -3.3% | 147% |
| Denver MSA, Home Prices | |||
| From Jun 2022 peak | MoM | YoY | Since 2000 |
| -7.6% | -0.2% | -2.7% | 211% |
| Dallas-Fort Worth MSA, Home Prices | |||
| From Jun 2022 peak | MoM | YoY | Since 2000 |
| -6.9% | -0.2% | -3.7% | 190% |
| Tampa MSA, Home Prices | |||
| From Jul 2022 peak | MoM | YoY | Since 2000 |
| -6.7% | -0.4% | -5.7% | 260% |
And inventories in Tampa:
| Sacramento MSA, Home Prices | |||
| From July 2022 peak | MoM | YoY | Since 2000 |
| -6.6% | -0.2% | -1.8% | 245% |
| Honolulu, Home Prices | |||
| From Jun 2022 peak | MoM | YoY | Since 2000 |
| -5.7% | -0.4% | -1.7% | 277% |
| Portland MSA, Home Prices | |||
| From May 2022 peak | MoM | YoY | Since 2000 |
| -5.0% | 0.1% | -0.7% | 220% |
| Salt Lake City MSA, Home Prices | |||
| From July 2022 peak | MoM | YoY | Since 2000 |
| -4.0% | 0.3% | 1.2% | 220% |
| Seattle MSA, Home Prices | |||
| From May 2022 peak | MoM | YoY | Since 2000 |
| -4.2% | -0.1% | -0.4% | 242% |
| Raleigh MSA, Home Prices | |||
| From July 2022 peak | MoM | YoY | Since 2000 |
| -3.8% | 0.0% | -2.1% | 157% |
| Houston MSA, Home Prices | |||
| From Jul 2022 peak | MoM | YoY | Since 2000 |
| -3.0% | 0.0% | -1.7% | 151% |
| Nashville MSA, Home Prices | |||
| From July 2022 peak | MoM | YoY | Since 2000 |
| -2.3% | 0.1% | -0.1% | 220% |
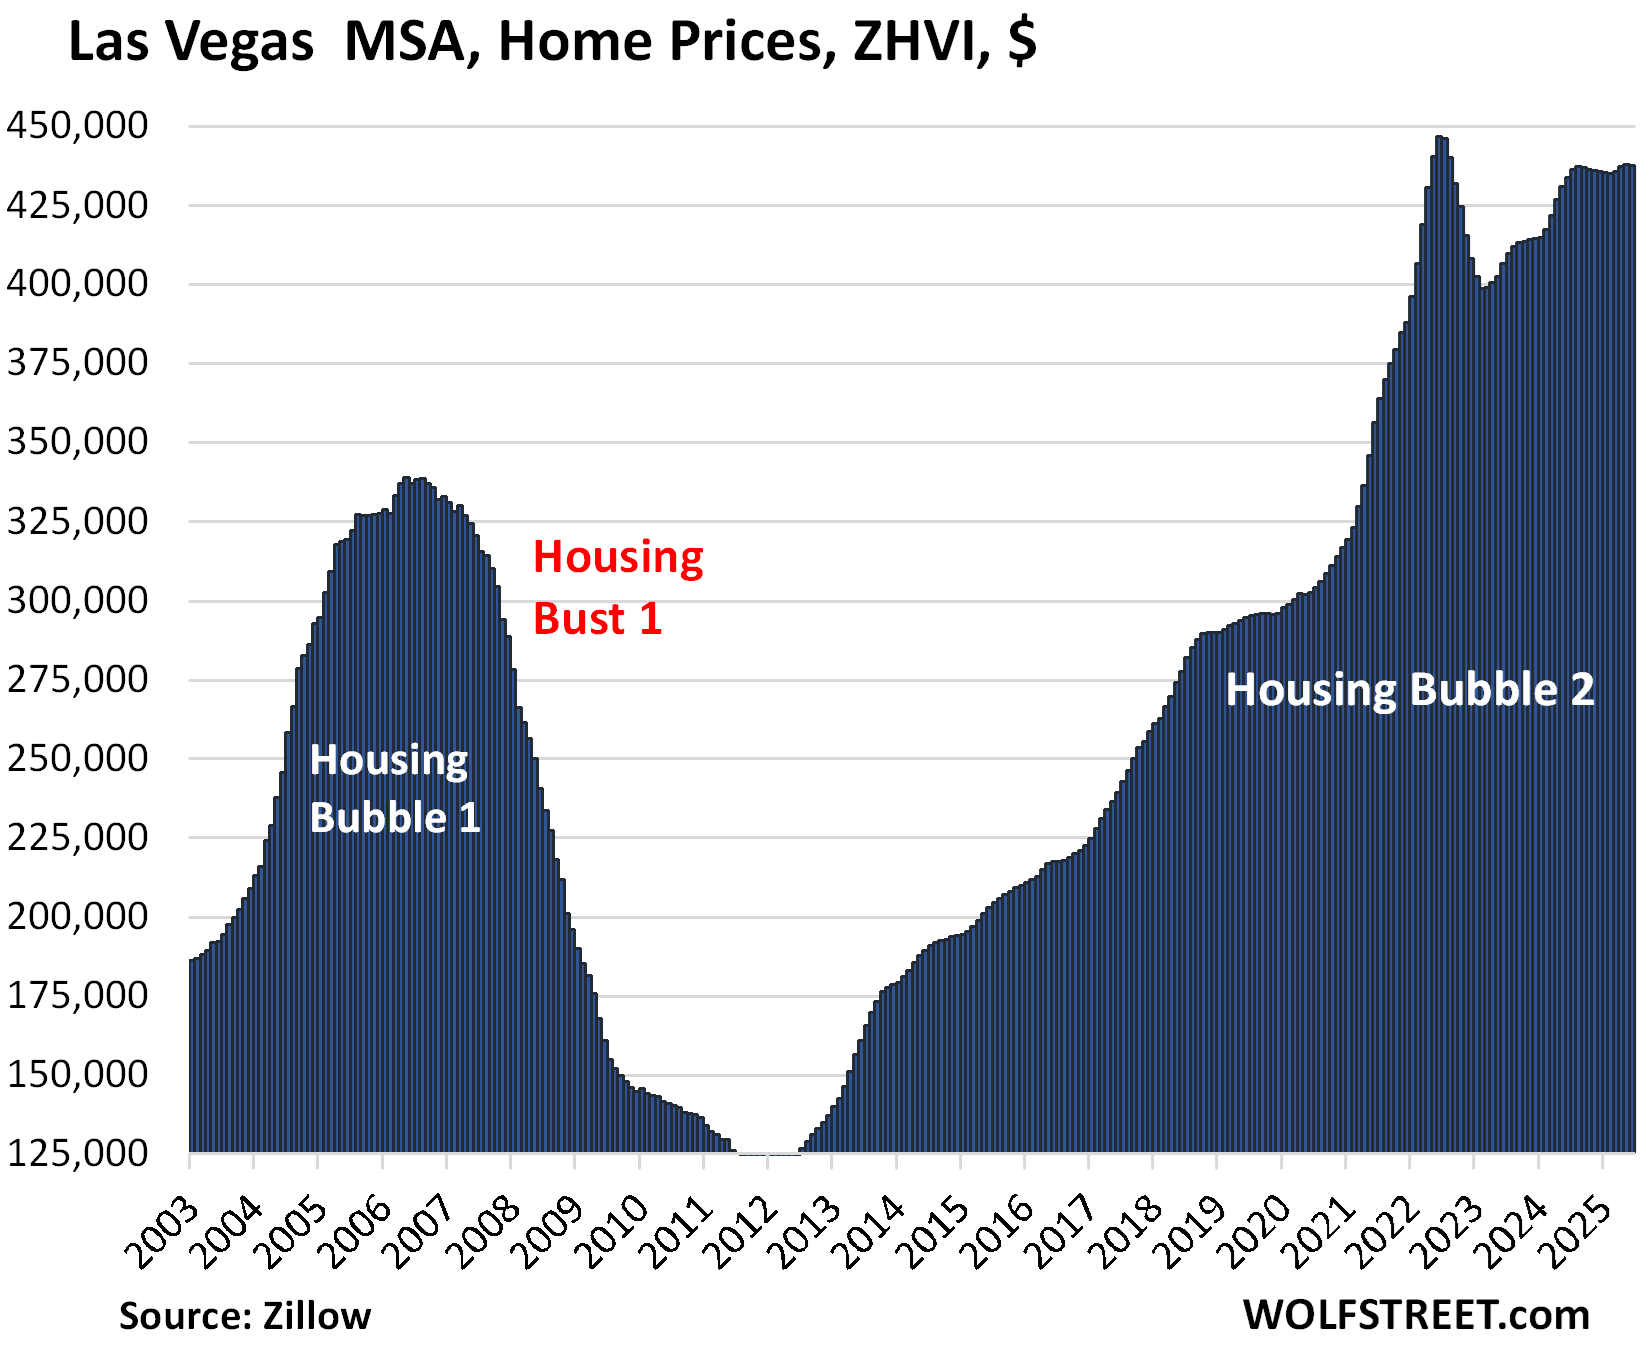
| Las Vegas MSA, Home Prices | |||
| From June 2022 peak | MoM | YoY | Since 2000 |
| -2.1% | -0.1% | 0.9% | 180% |
| Orlando MSA, Home Prices | |||
| From June 2022 | MoM | YoY | Since 2000 |
| -1.5% | -0.4% | -3.7% | 229% |
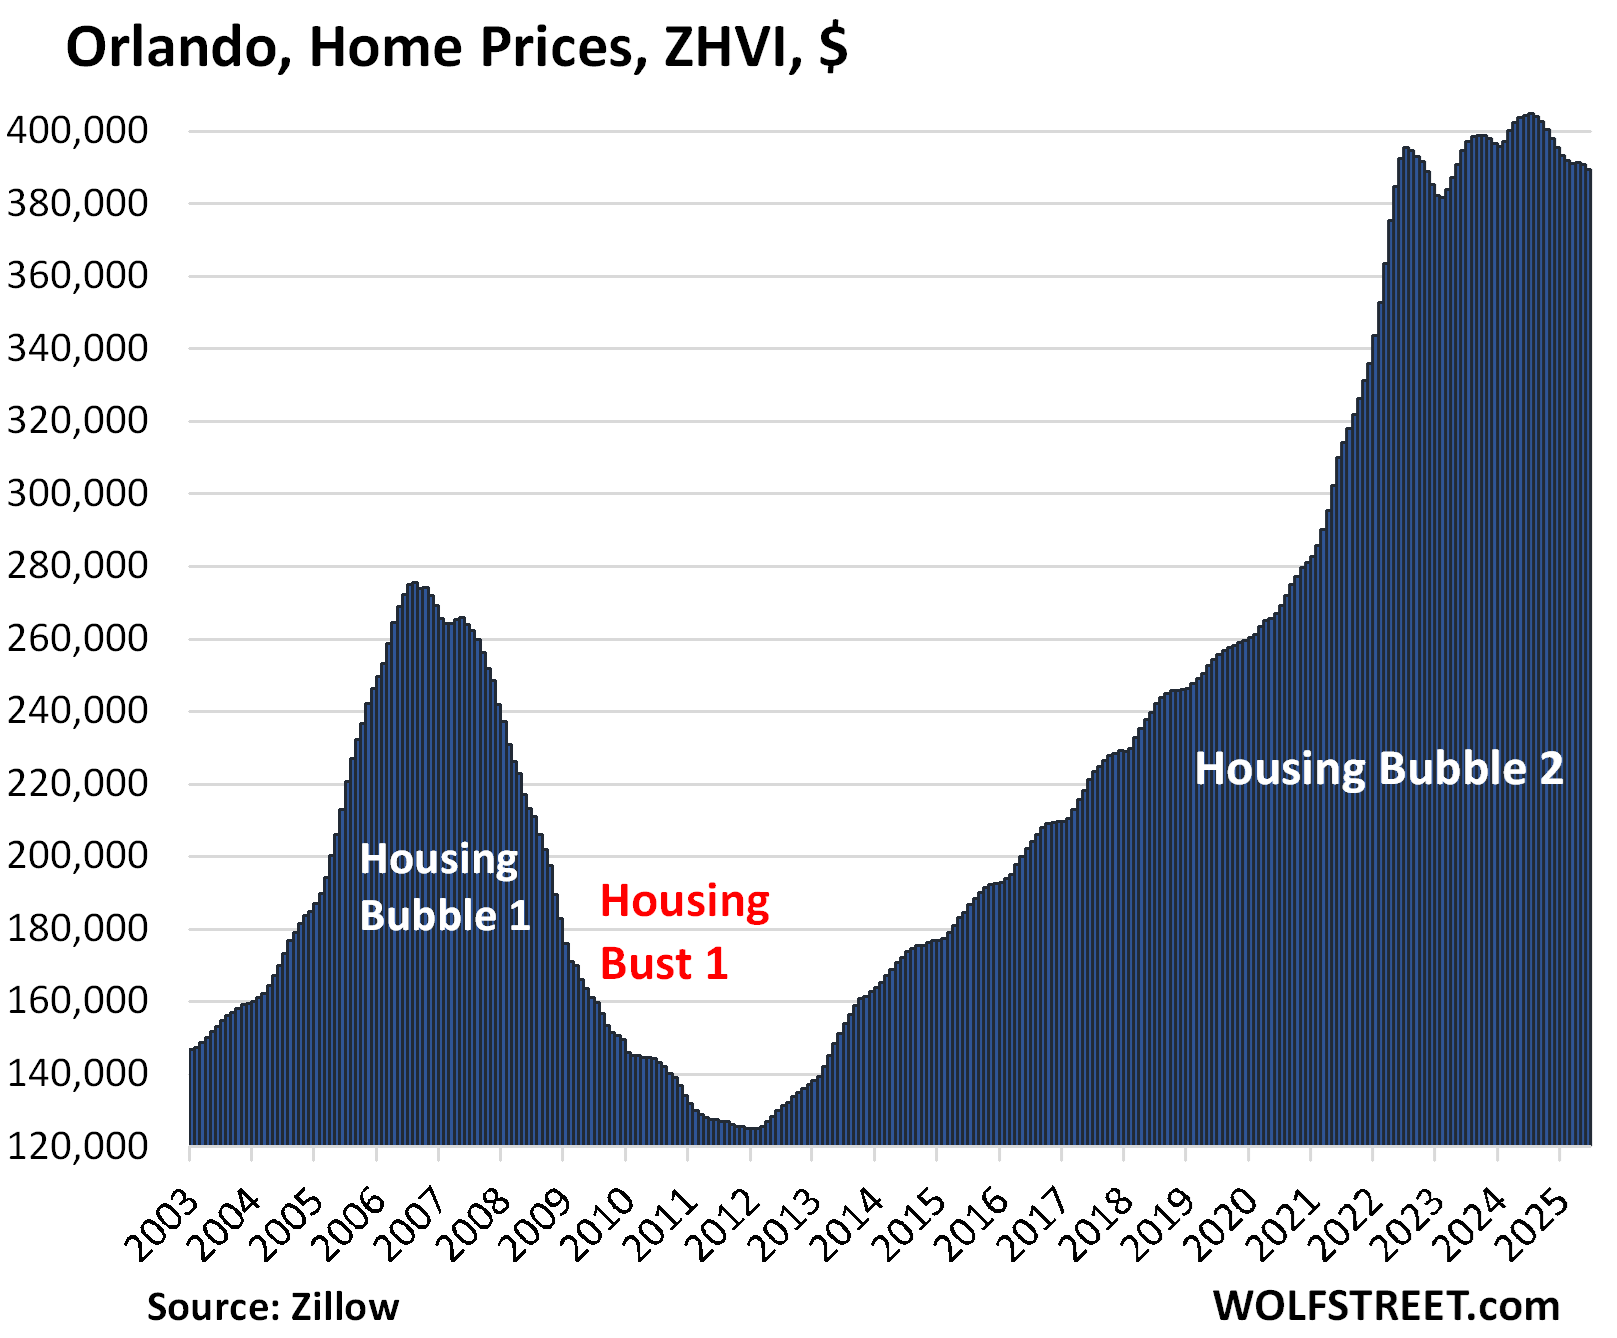
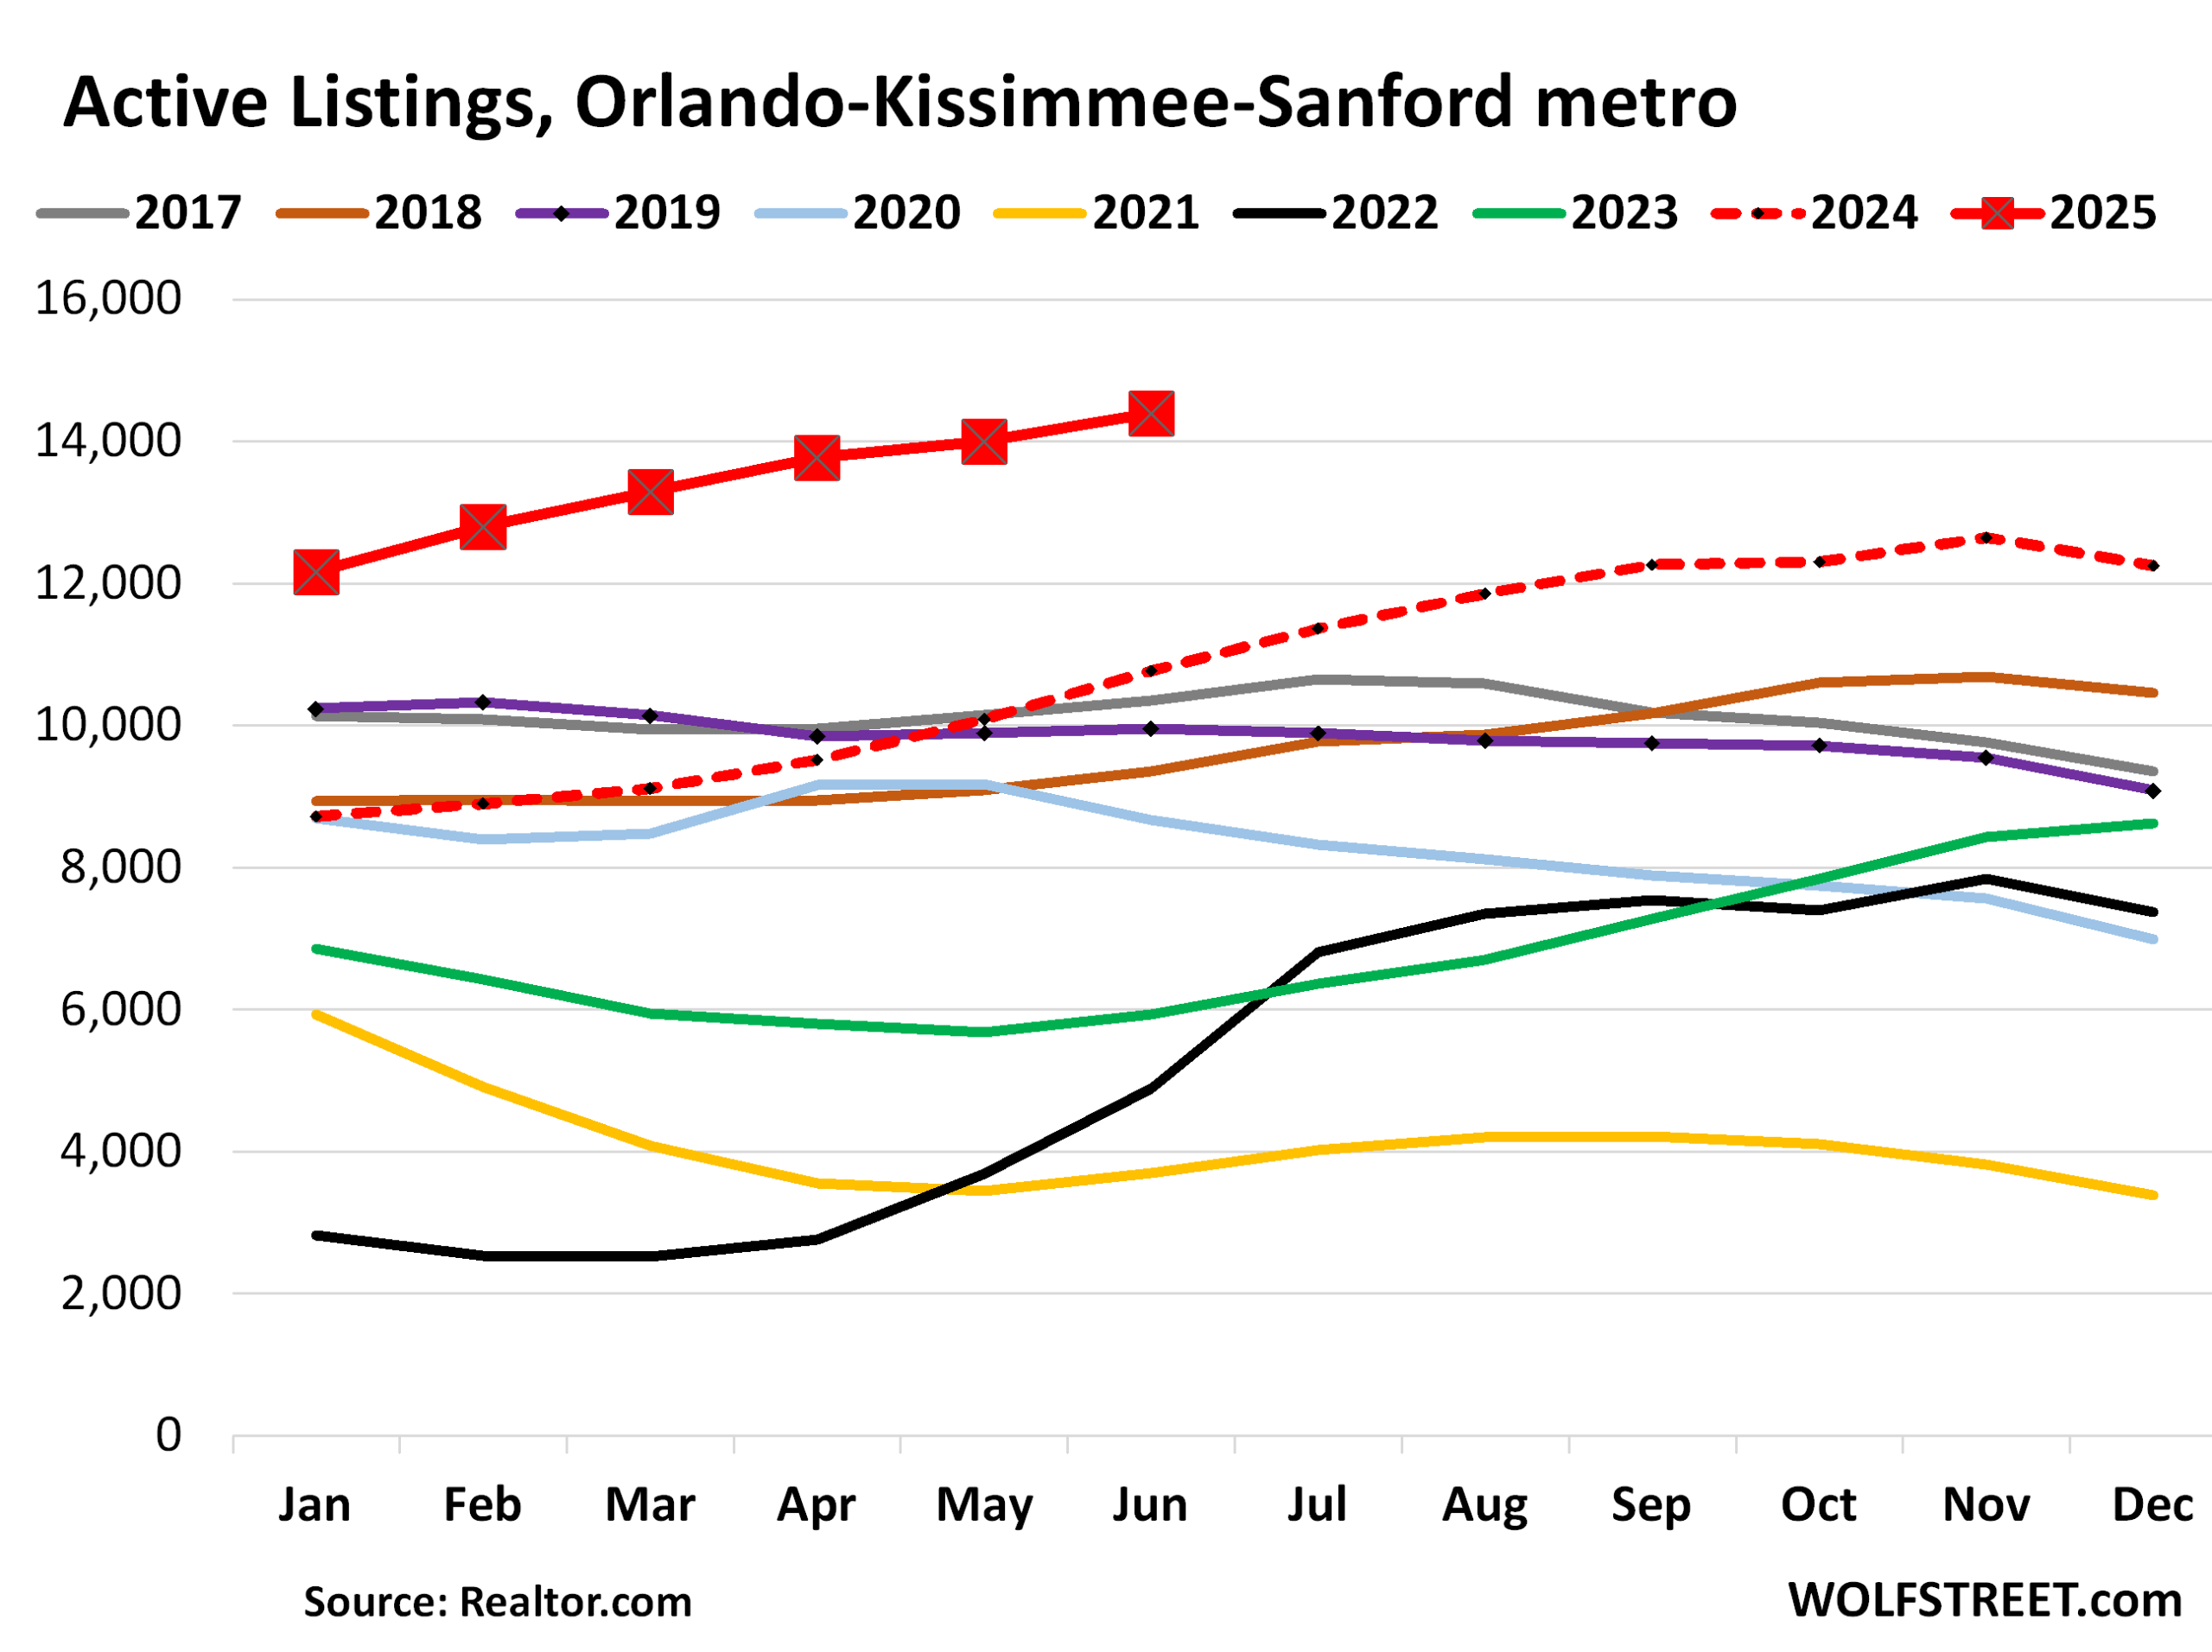
And inventory in the Orlando MSA:
| San Jose MSA, Home Prices | |||
| From May 2022 peak | MoM | YoY | Since 2000 |
| -0.9% | -1.1% | -0.9% | 343.2% |
Prices fell sharply over the past two months, turning the index negative year-over-year, and re-pushing it below the May 2022 high.
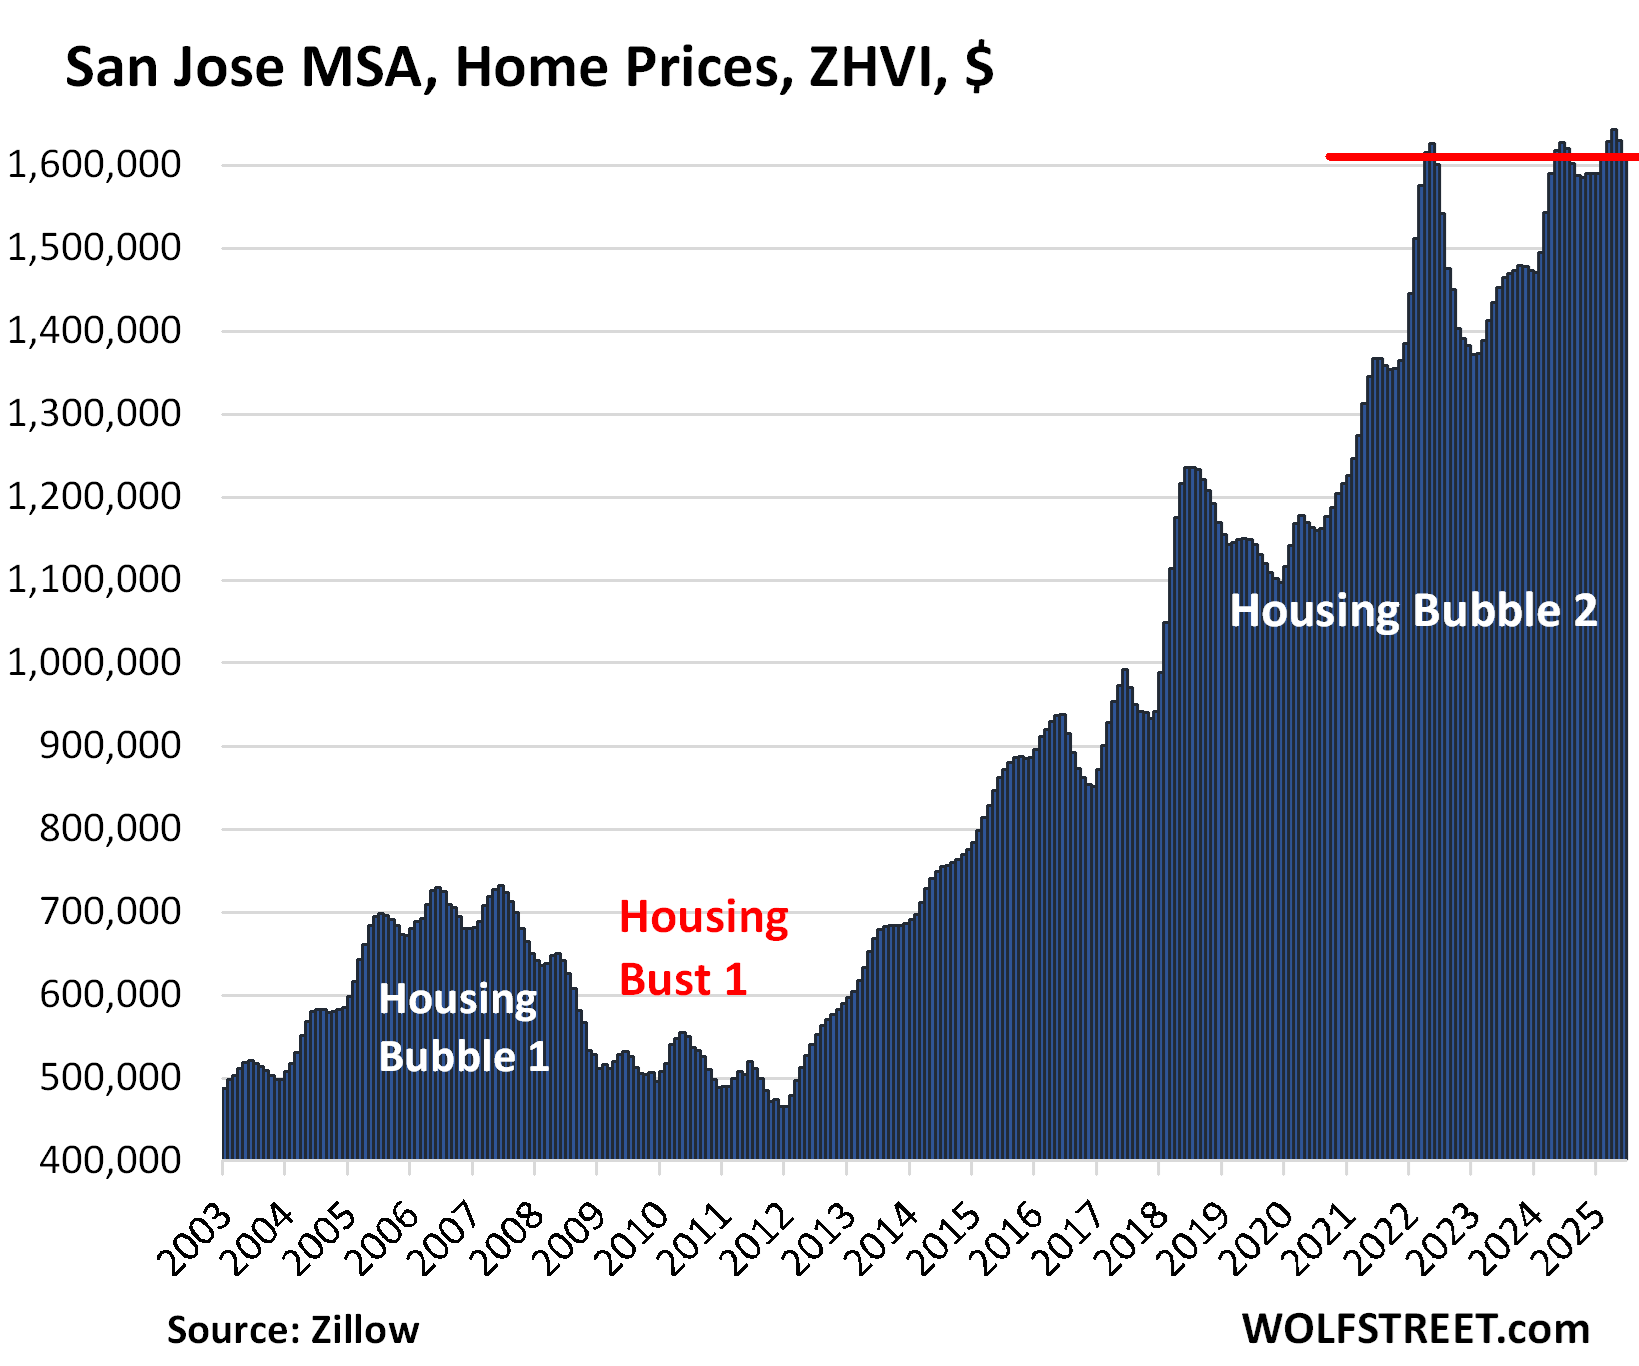
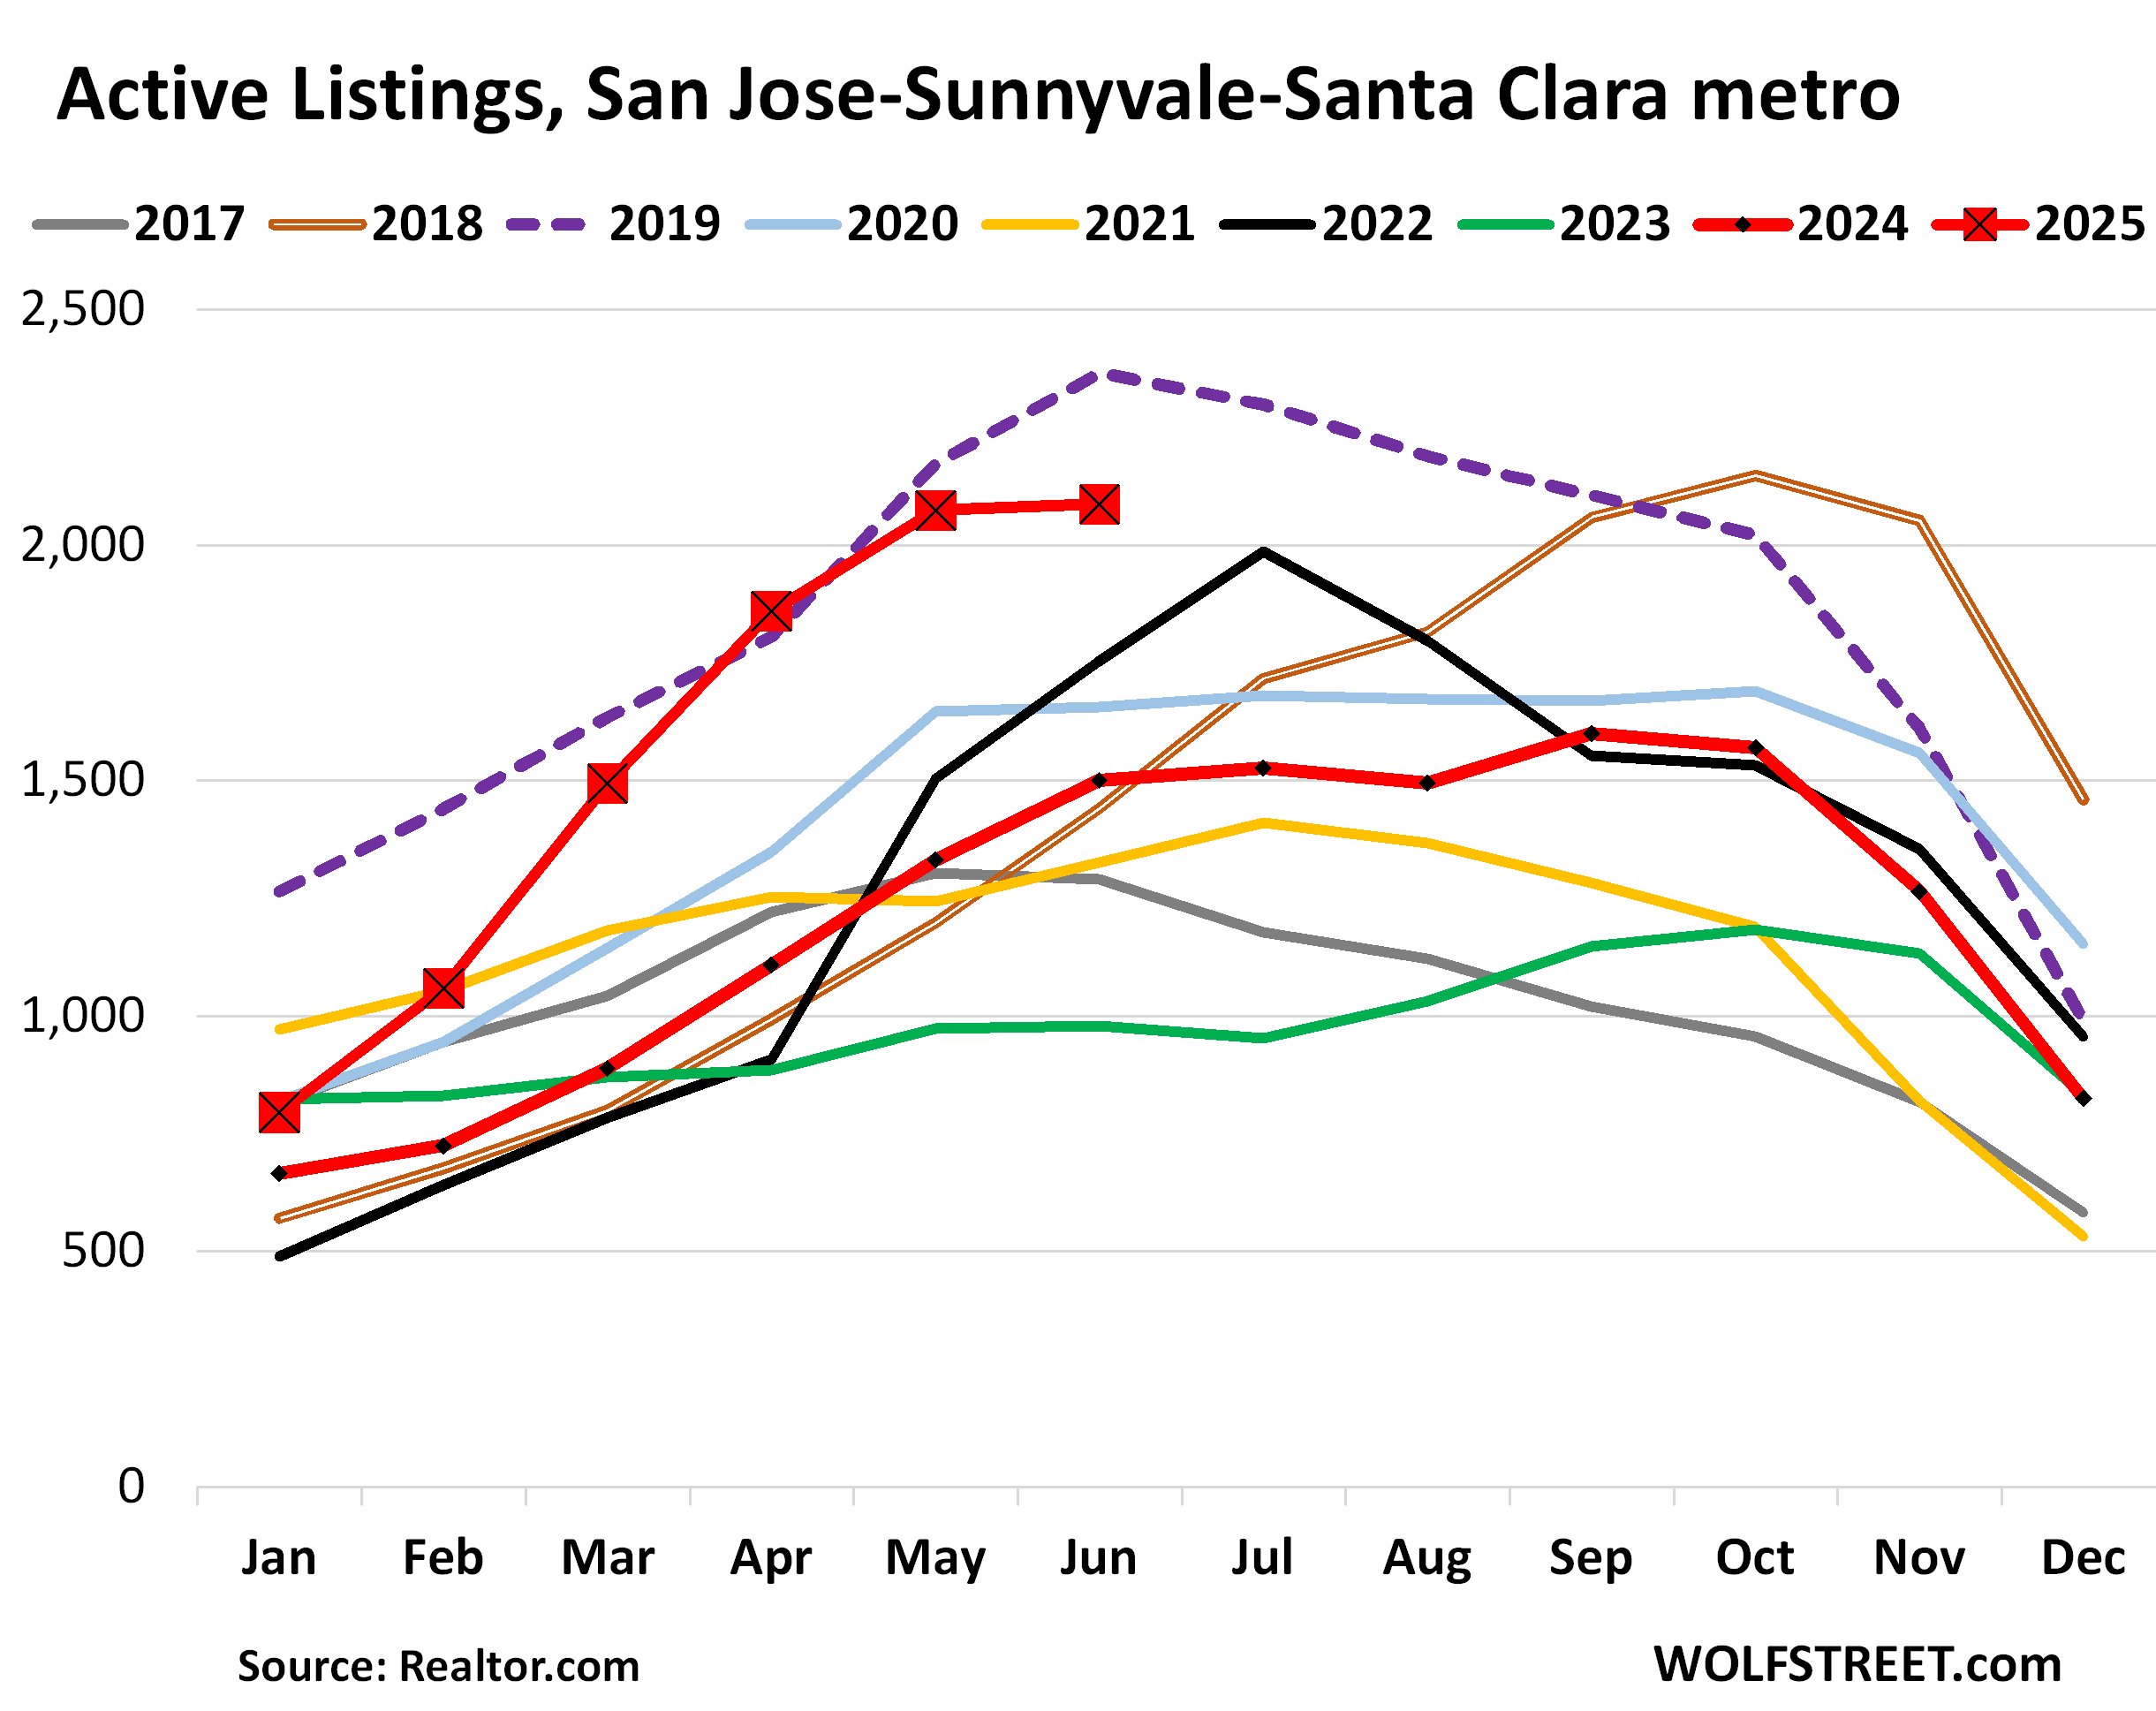
And inventory in the San Jose MSA:
| Atlanta MSA, Home Prices | |||
| From July 2022 | MoM | YoY | Since 2000 |
| -0.8% | 0.1% | -2.9% | 160% |
The other 4 metros with YoY price declines:
| Miami MSA, Home Prices | ||
| MoM | YoY | Since 2000 |
| -0.5% | -3.8% | 320% |
| San Diego MSA, Home Prices | ||
| MoM | YoY | Since 2000 |
| -0.4% | -2.4% | 333% |
| Charlotte MSA, Home Prices | ||
| MoM | YoY | Since 2000 |
| 0.2% | -1.0% | 171% |
The index is now just 0.6% above where it had been in mid-2022:
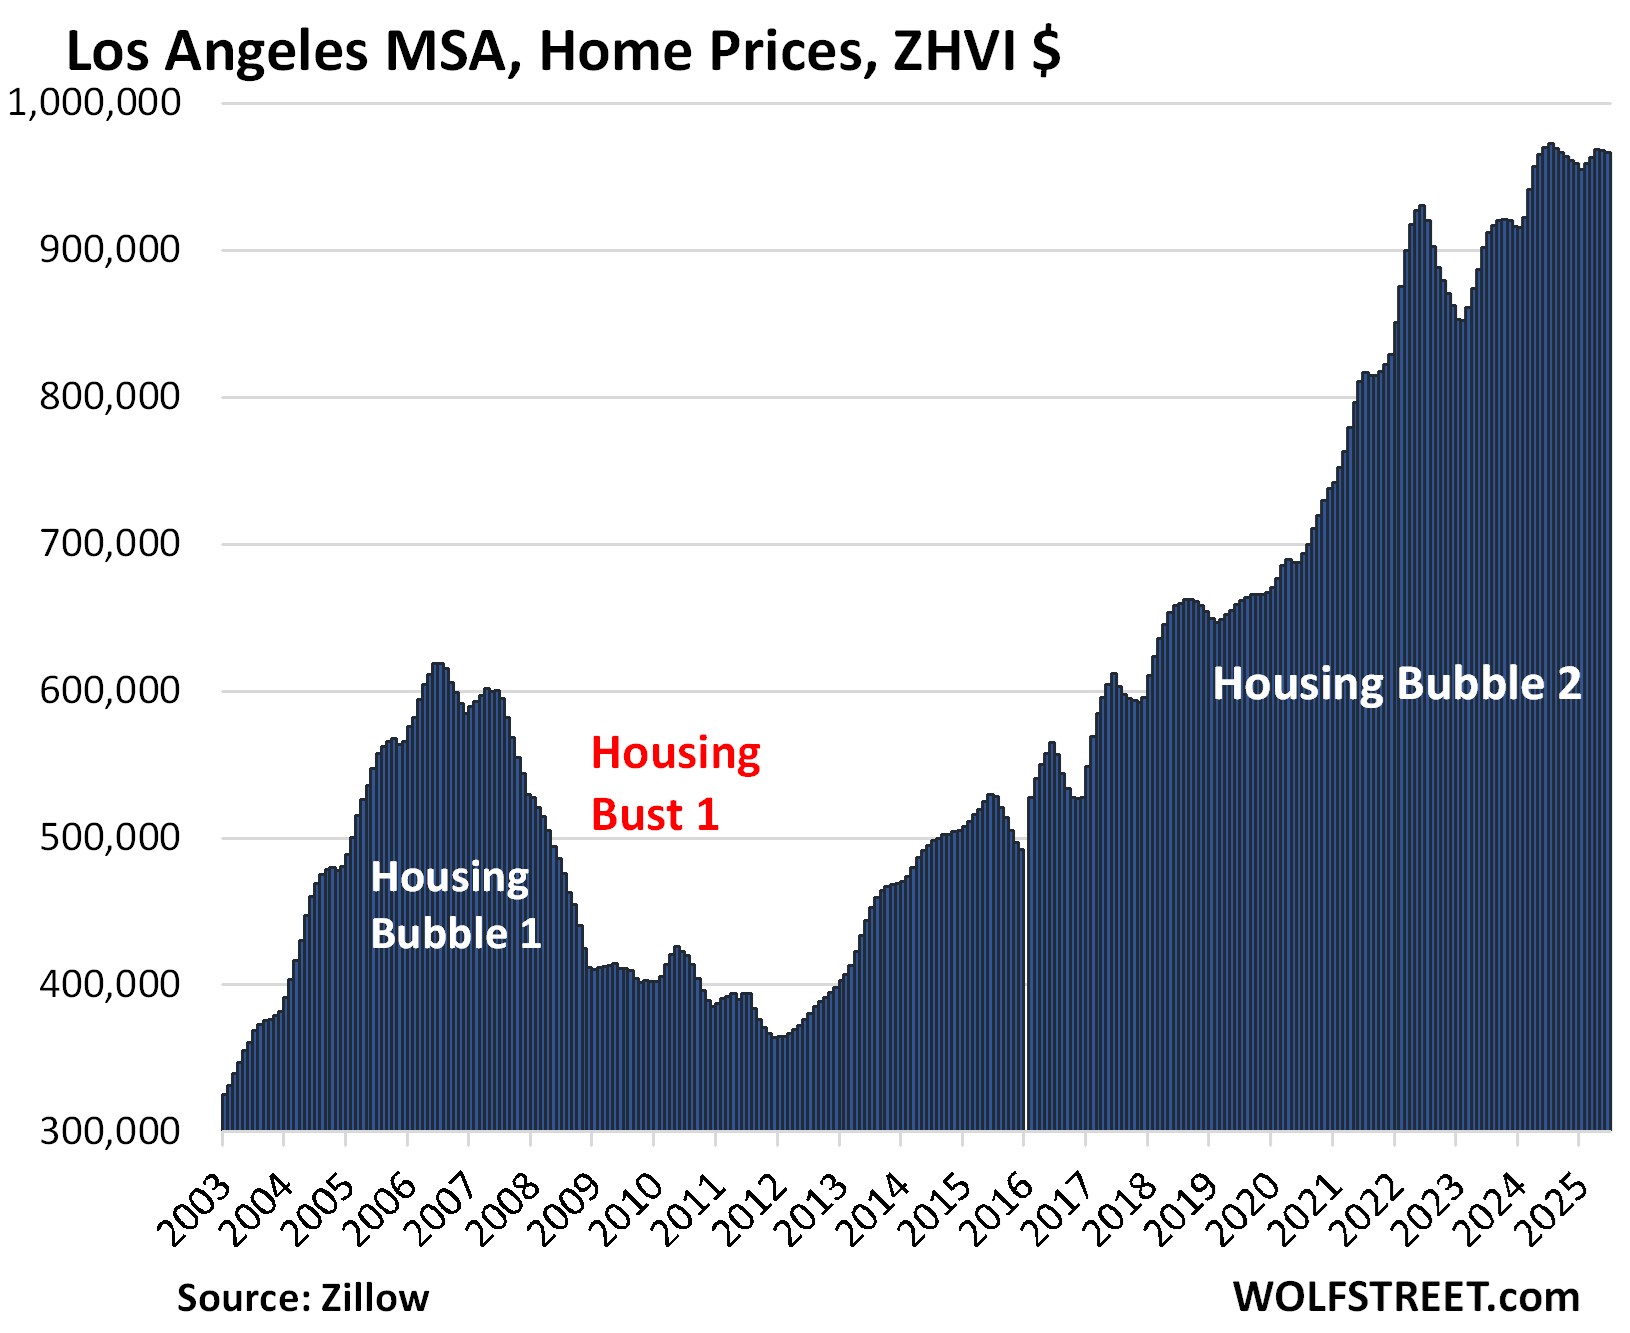
| Los Angeles MSA, Home Prices | ||
| MoM | YoY | Since 2000 |
| -0.1% | -0.4% | 332% |
The metros where prices were still up year-over-year.
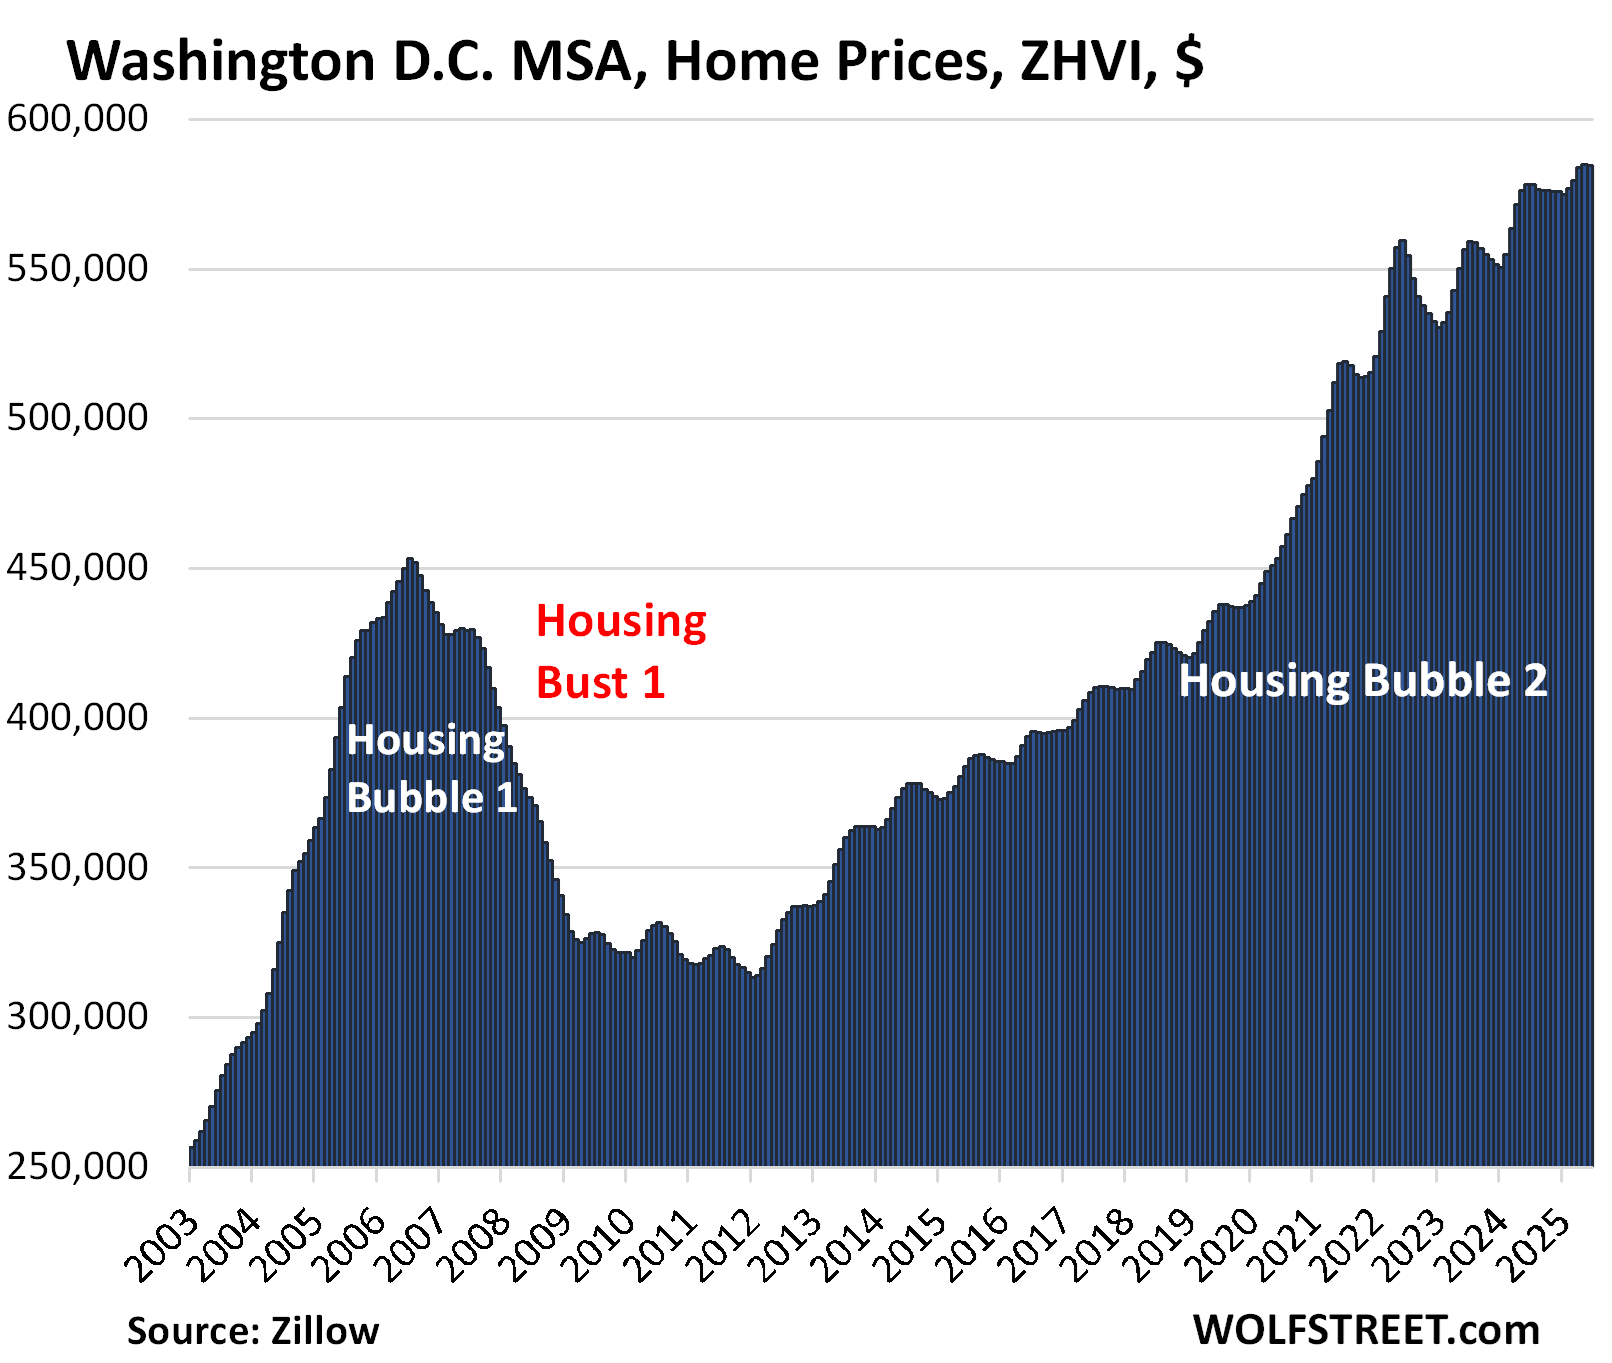
| Washington D.C. MSA, Home Prices | ||
| MoM | YoY | Since 2000 |
| 0.0% | 1.1% | 220% |
This vast MSA covers Washington D.C. plus portions of Virginia, West Virginia, and Maryland.
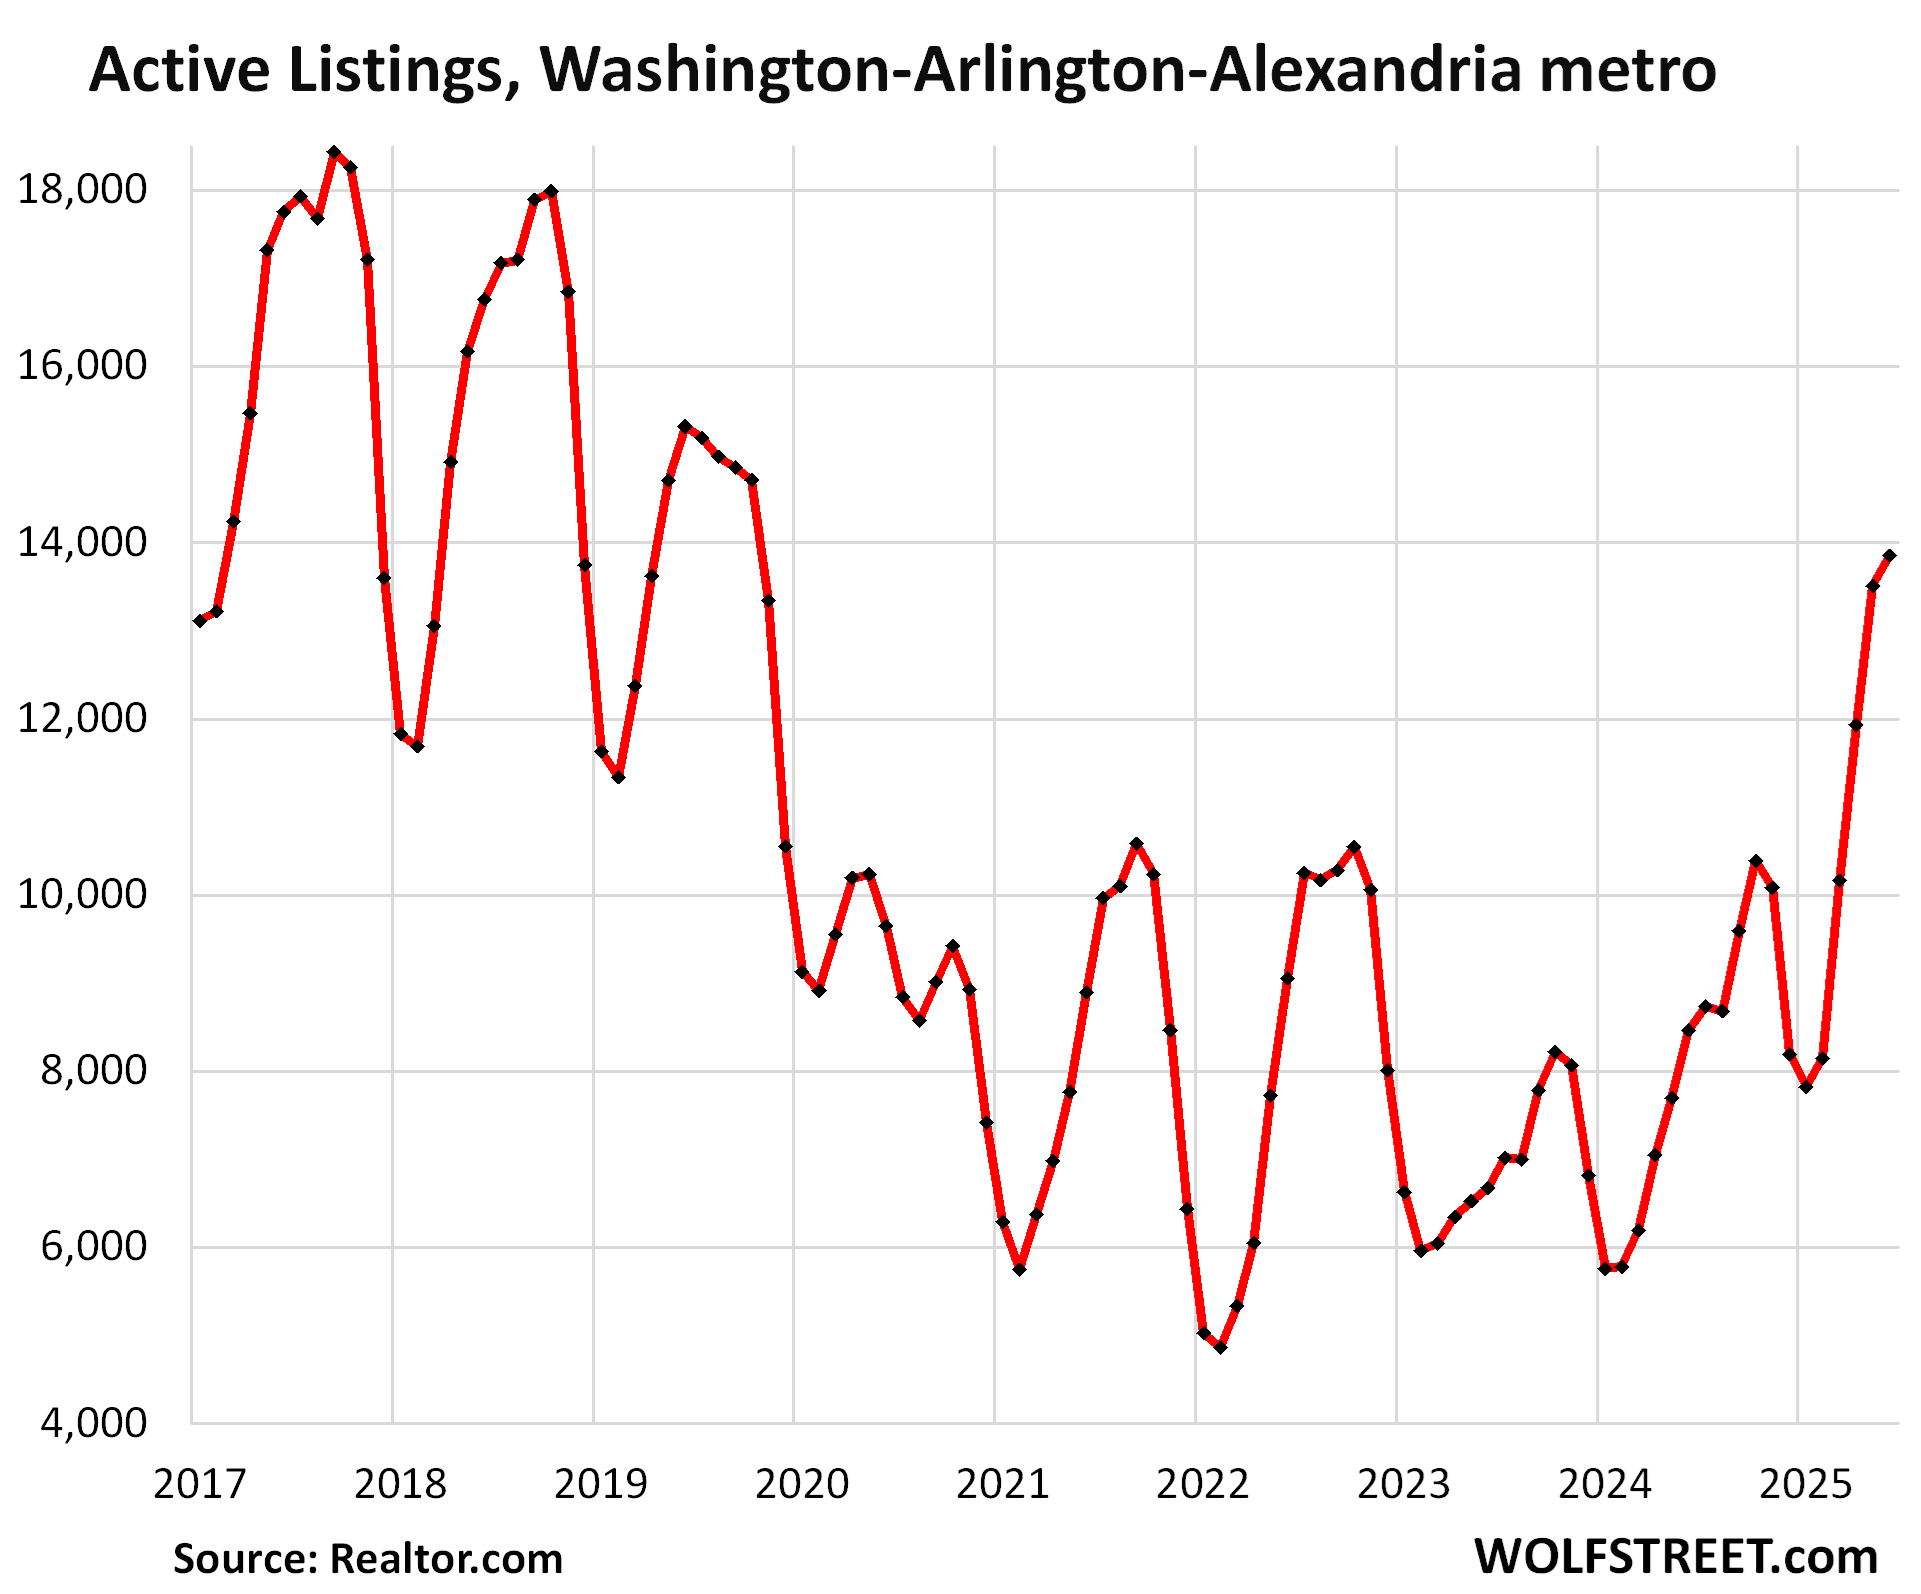
And inventory in the Washington D.C. MSA:
| Boston MSA, Home Prices | ||
| MoM | YoY | Since 2000 |
| 0.6% | 1.4% | 233% |
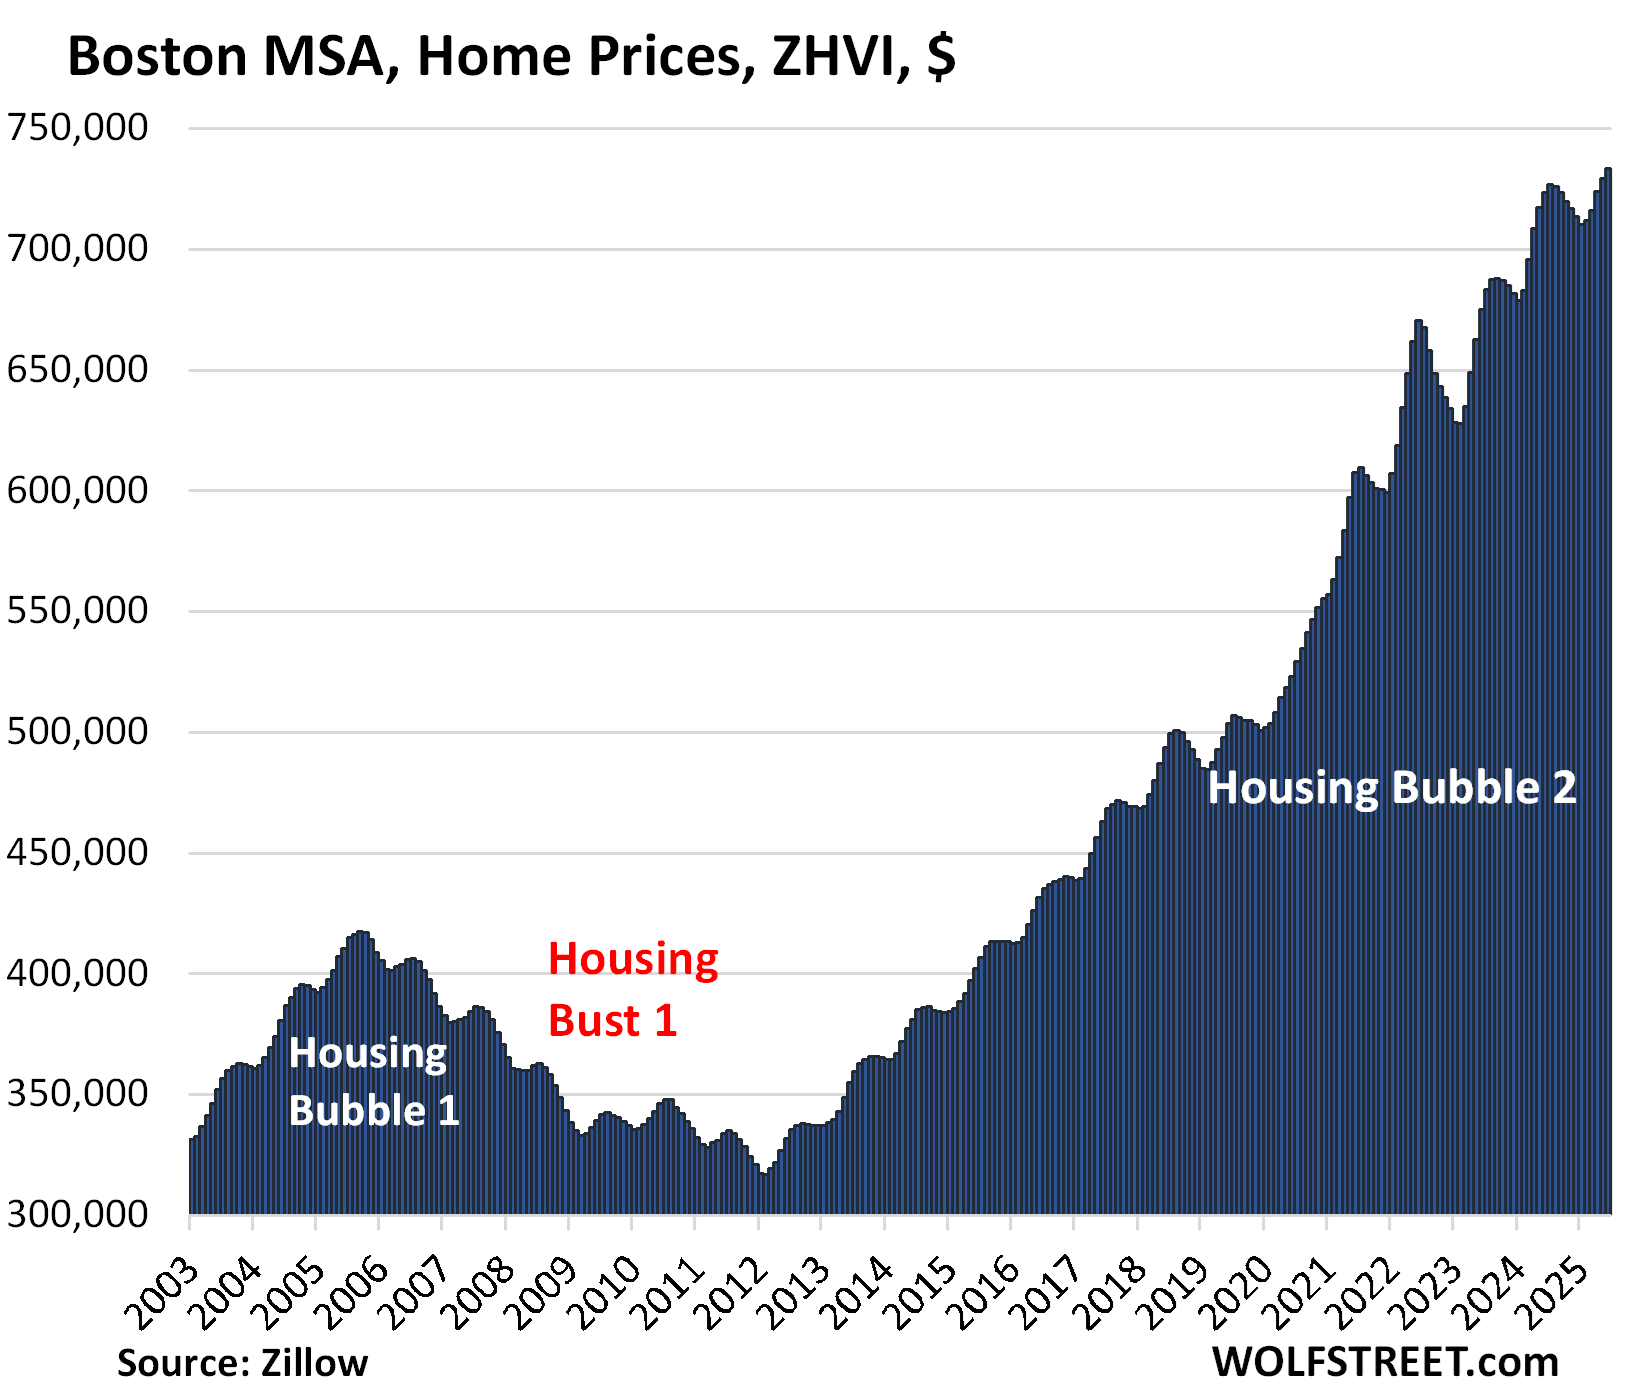
And inventory in the Boston metro:
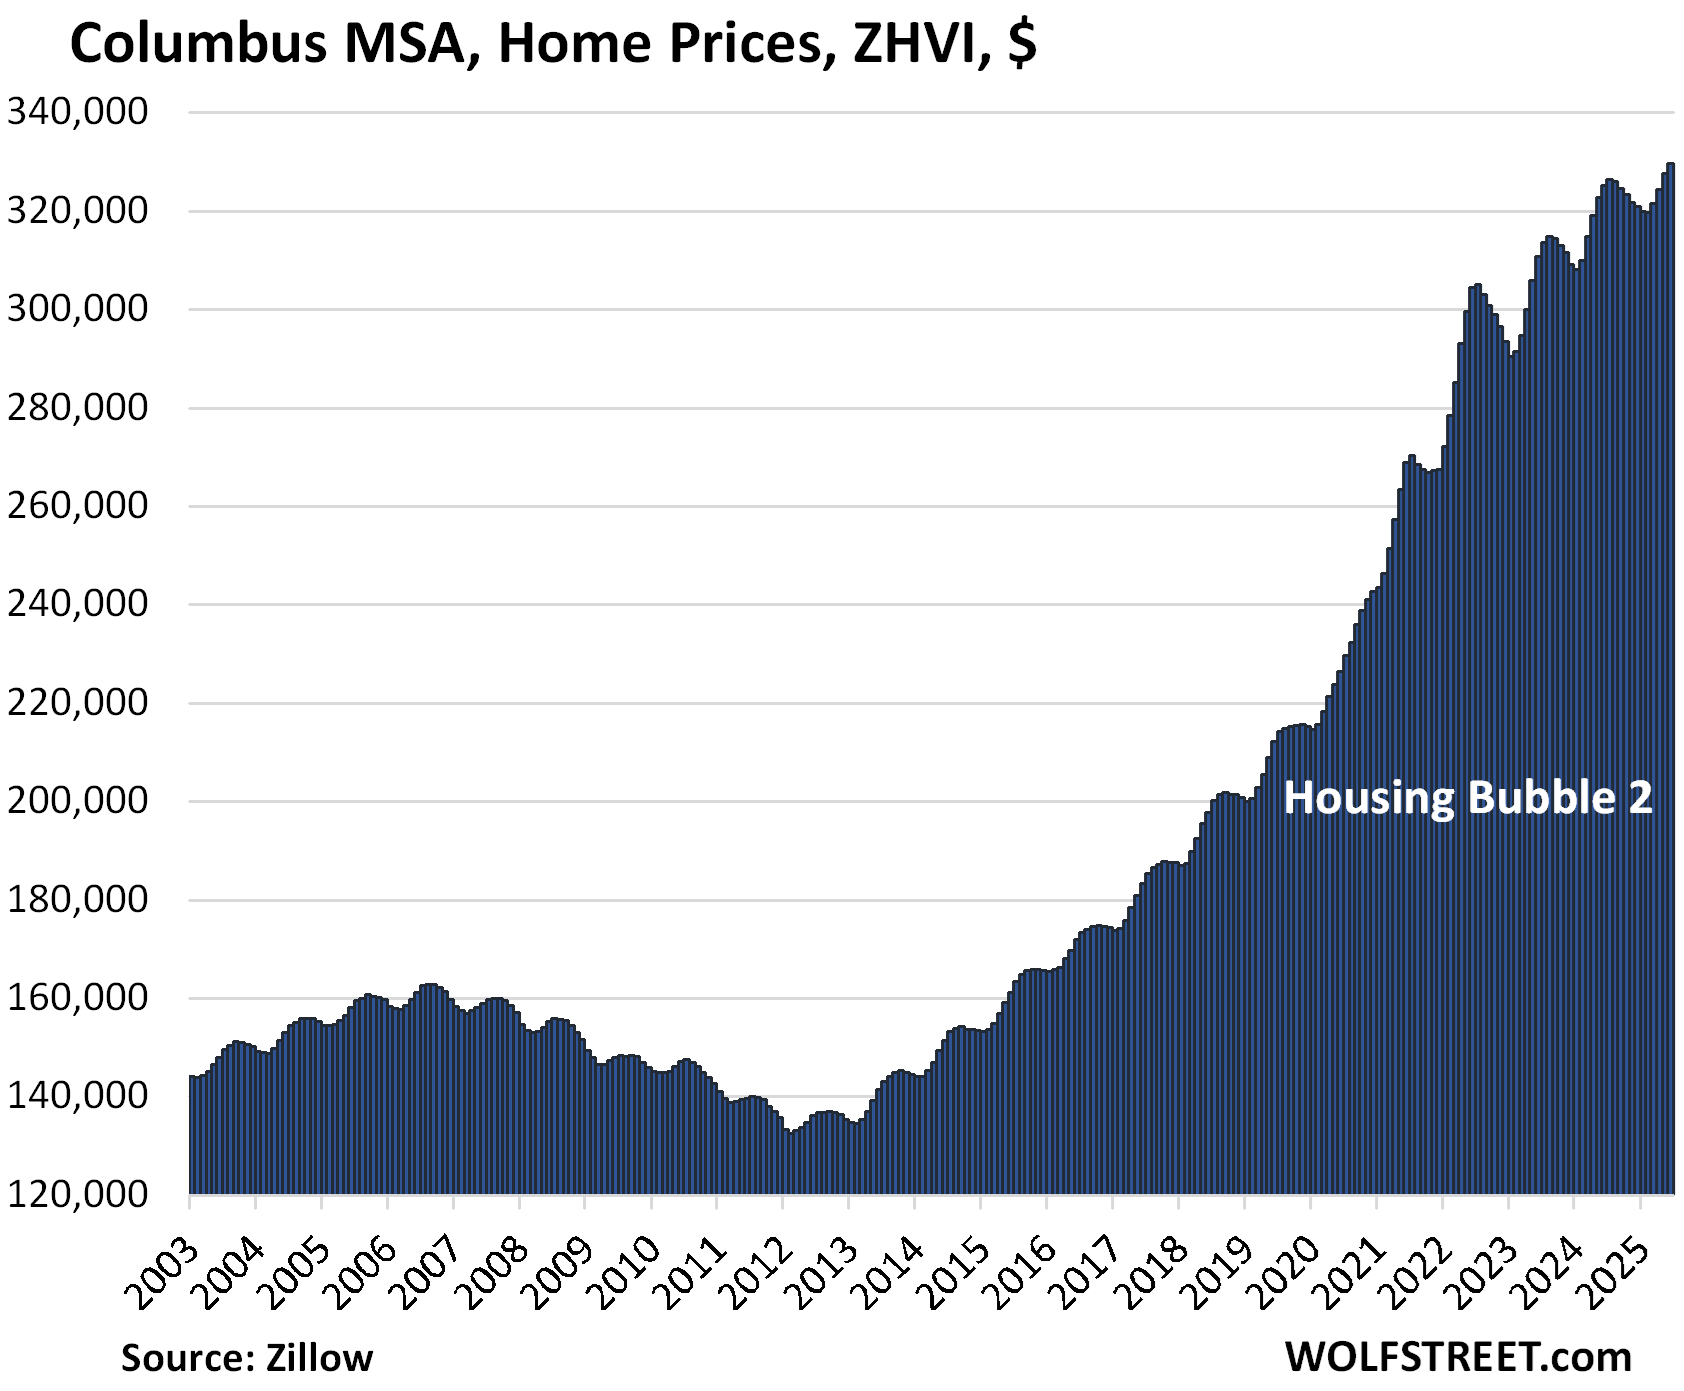
| Columbus MSA, Home Prices | ||
| MoM | YoY | Since 2000 |
| 0.6% | 1.4% | 159% |
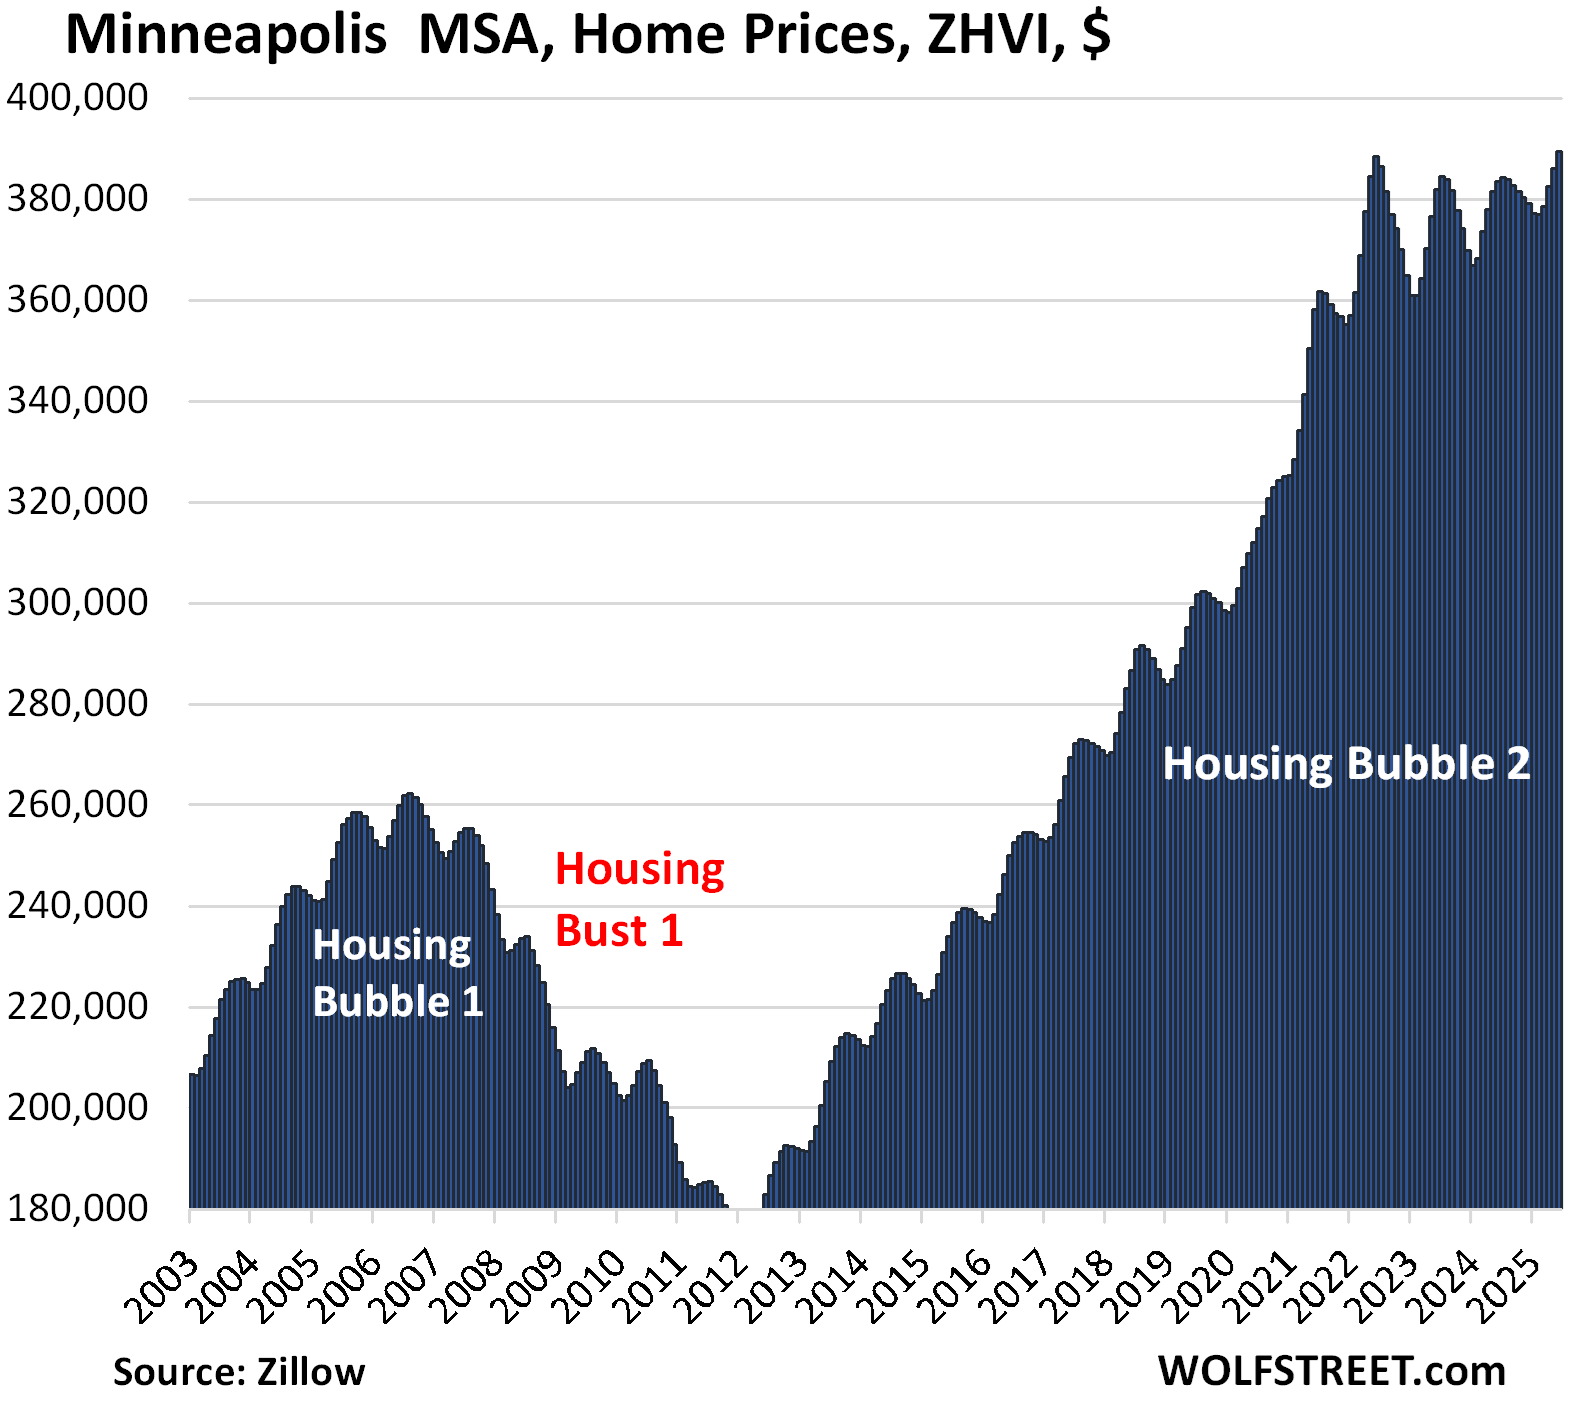
| Minneapolis MSA, Home Prices | ||
| MoM | YoY | Since 2000 |
| 0.9% | 1.5% | 163% |
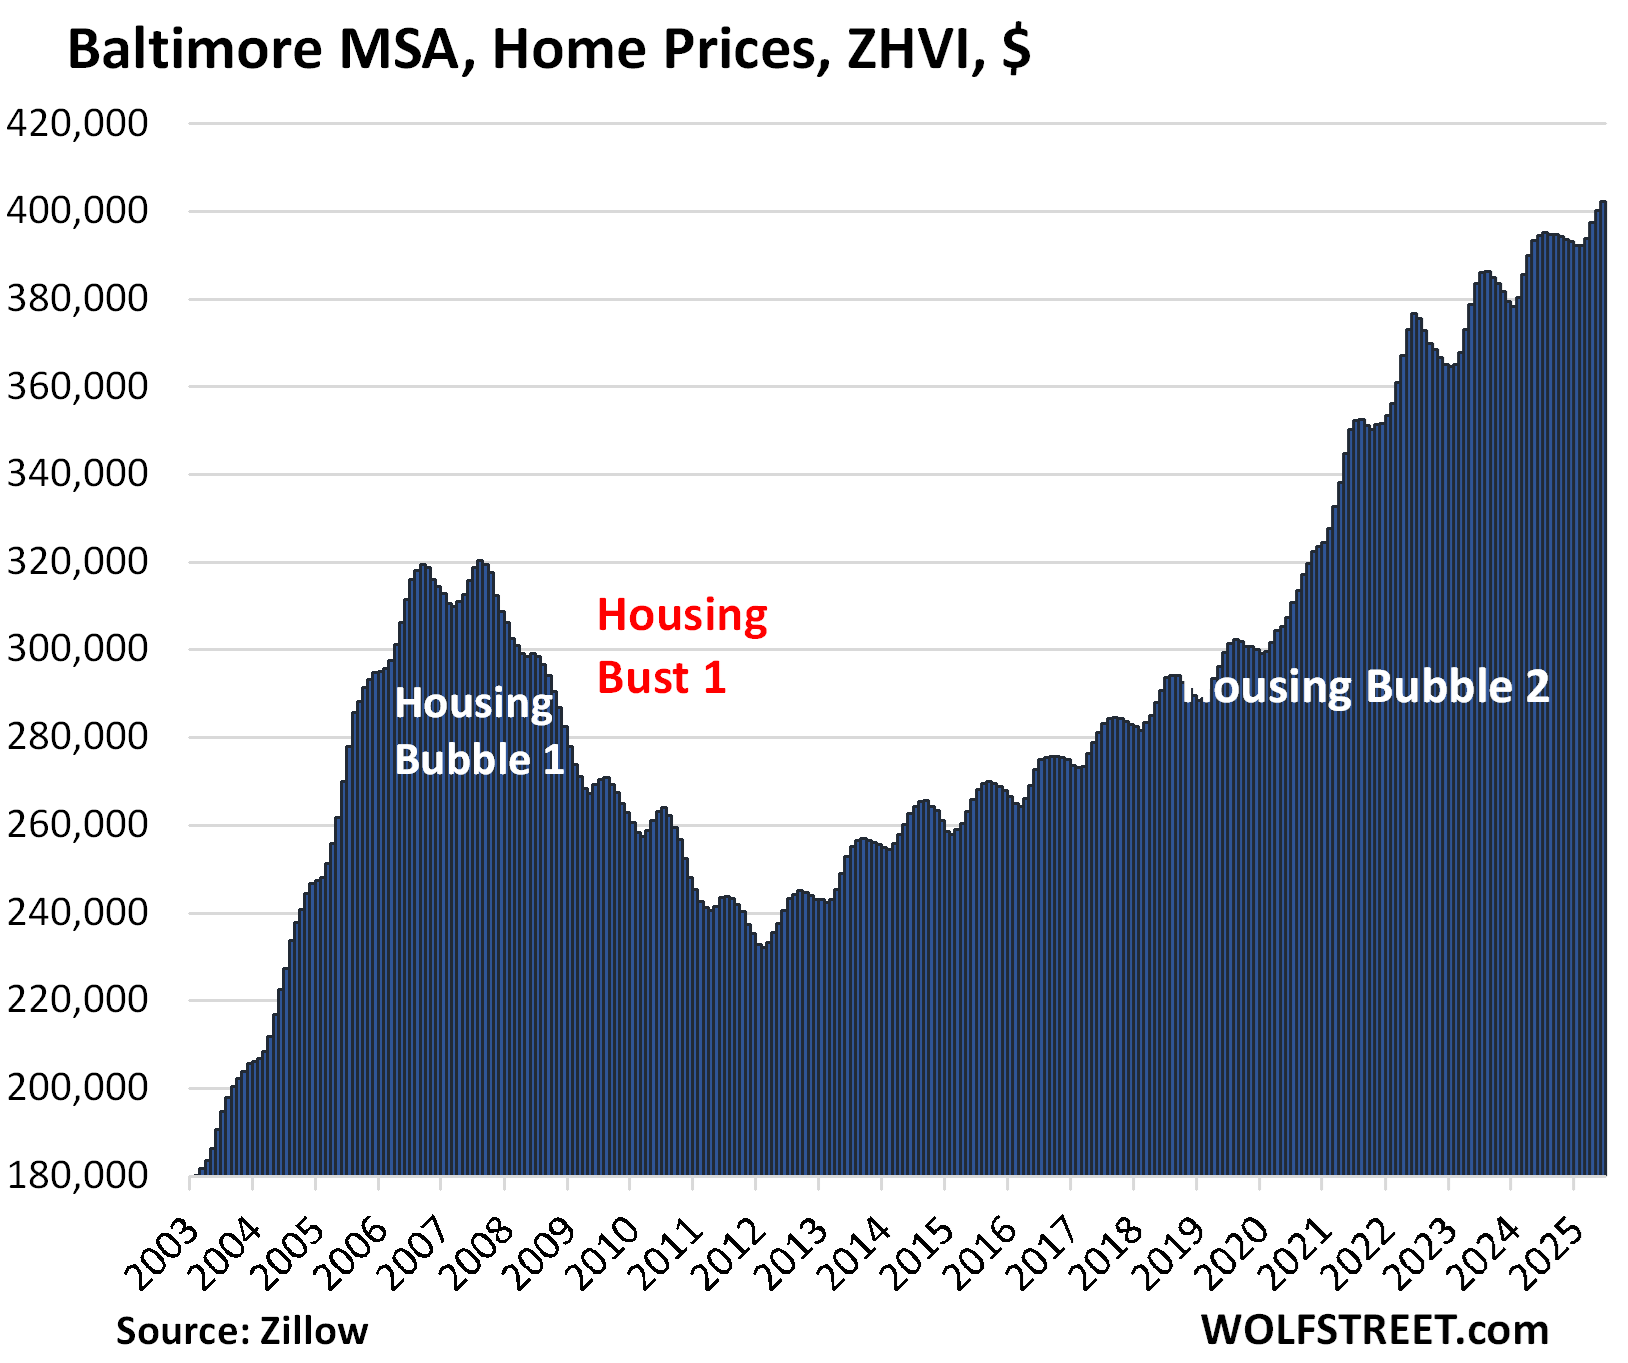
| Baltimore MSA, Home Prices | ||
| MoM | YoY | Since 2000 |
| 0.5% | 1.9% | 180% |
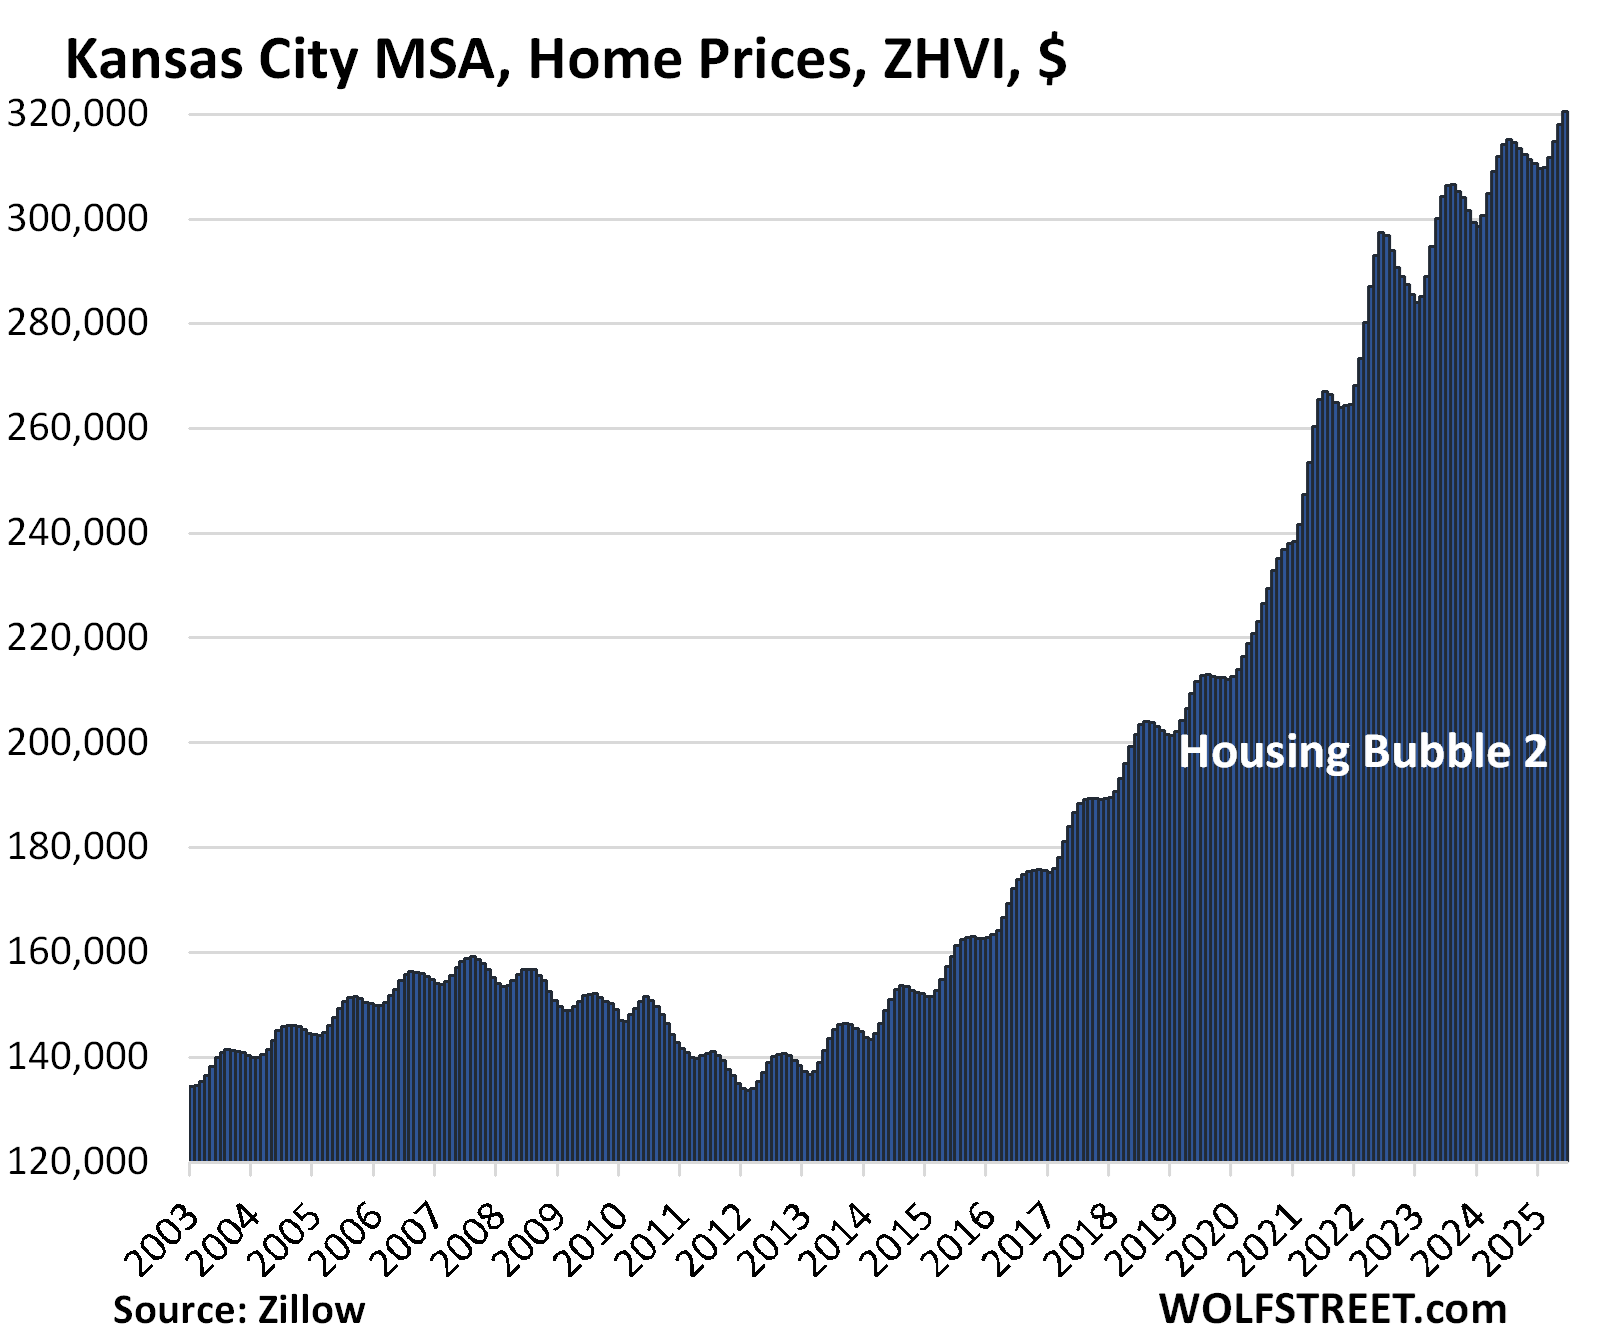
| Kansas City MSA, Home Prices | ||
| MoM | YoY | Since 2000 |
| 0.8% | 2.0% | 184% |
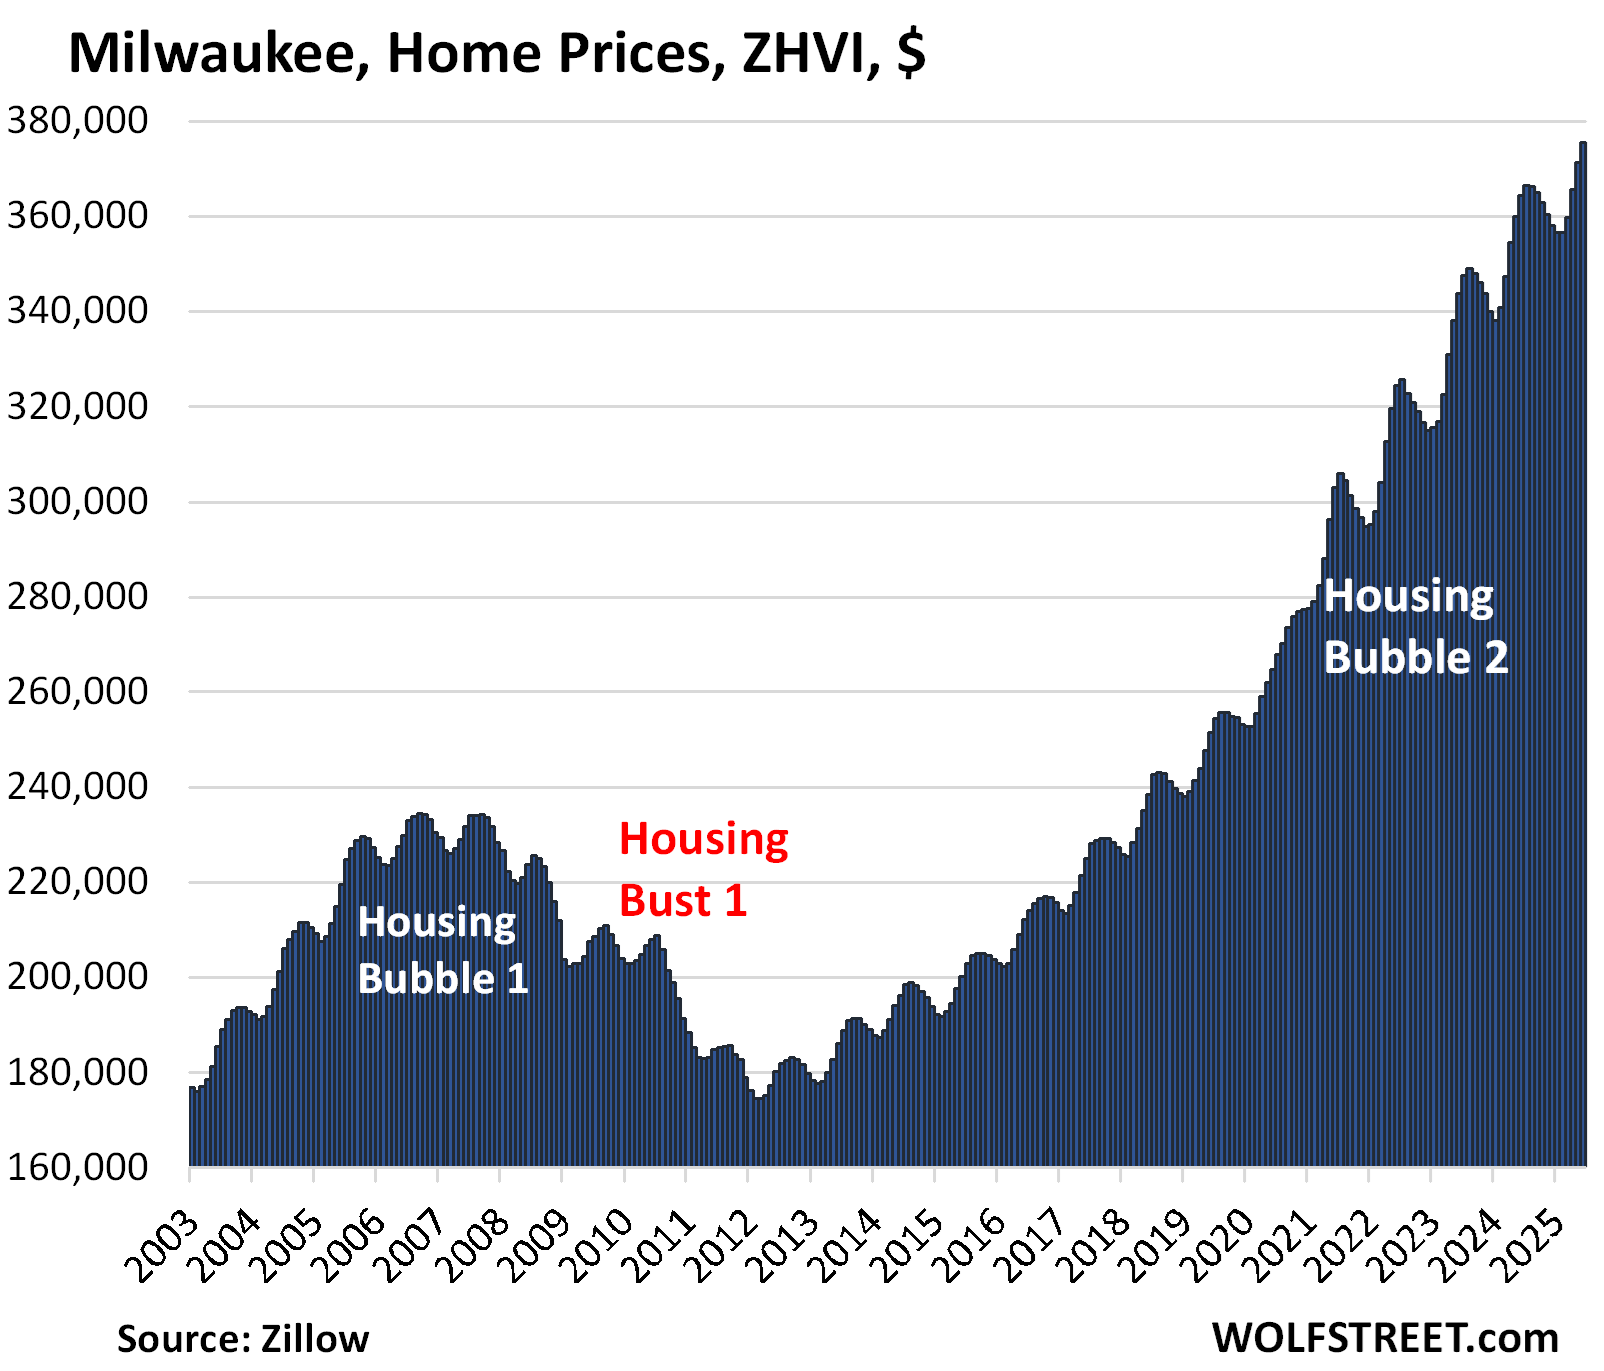
| Milwaukee MSA, Home Prices | ||
| MoM | YoY | Since 2000 |
| 1.1% | 3.1% | 154.2% |
| Chicago MSA, Home Prices | ||
| MoM | YoY | Since 2000 |
| 1.0% | 3.2% | 119% |
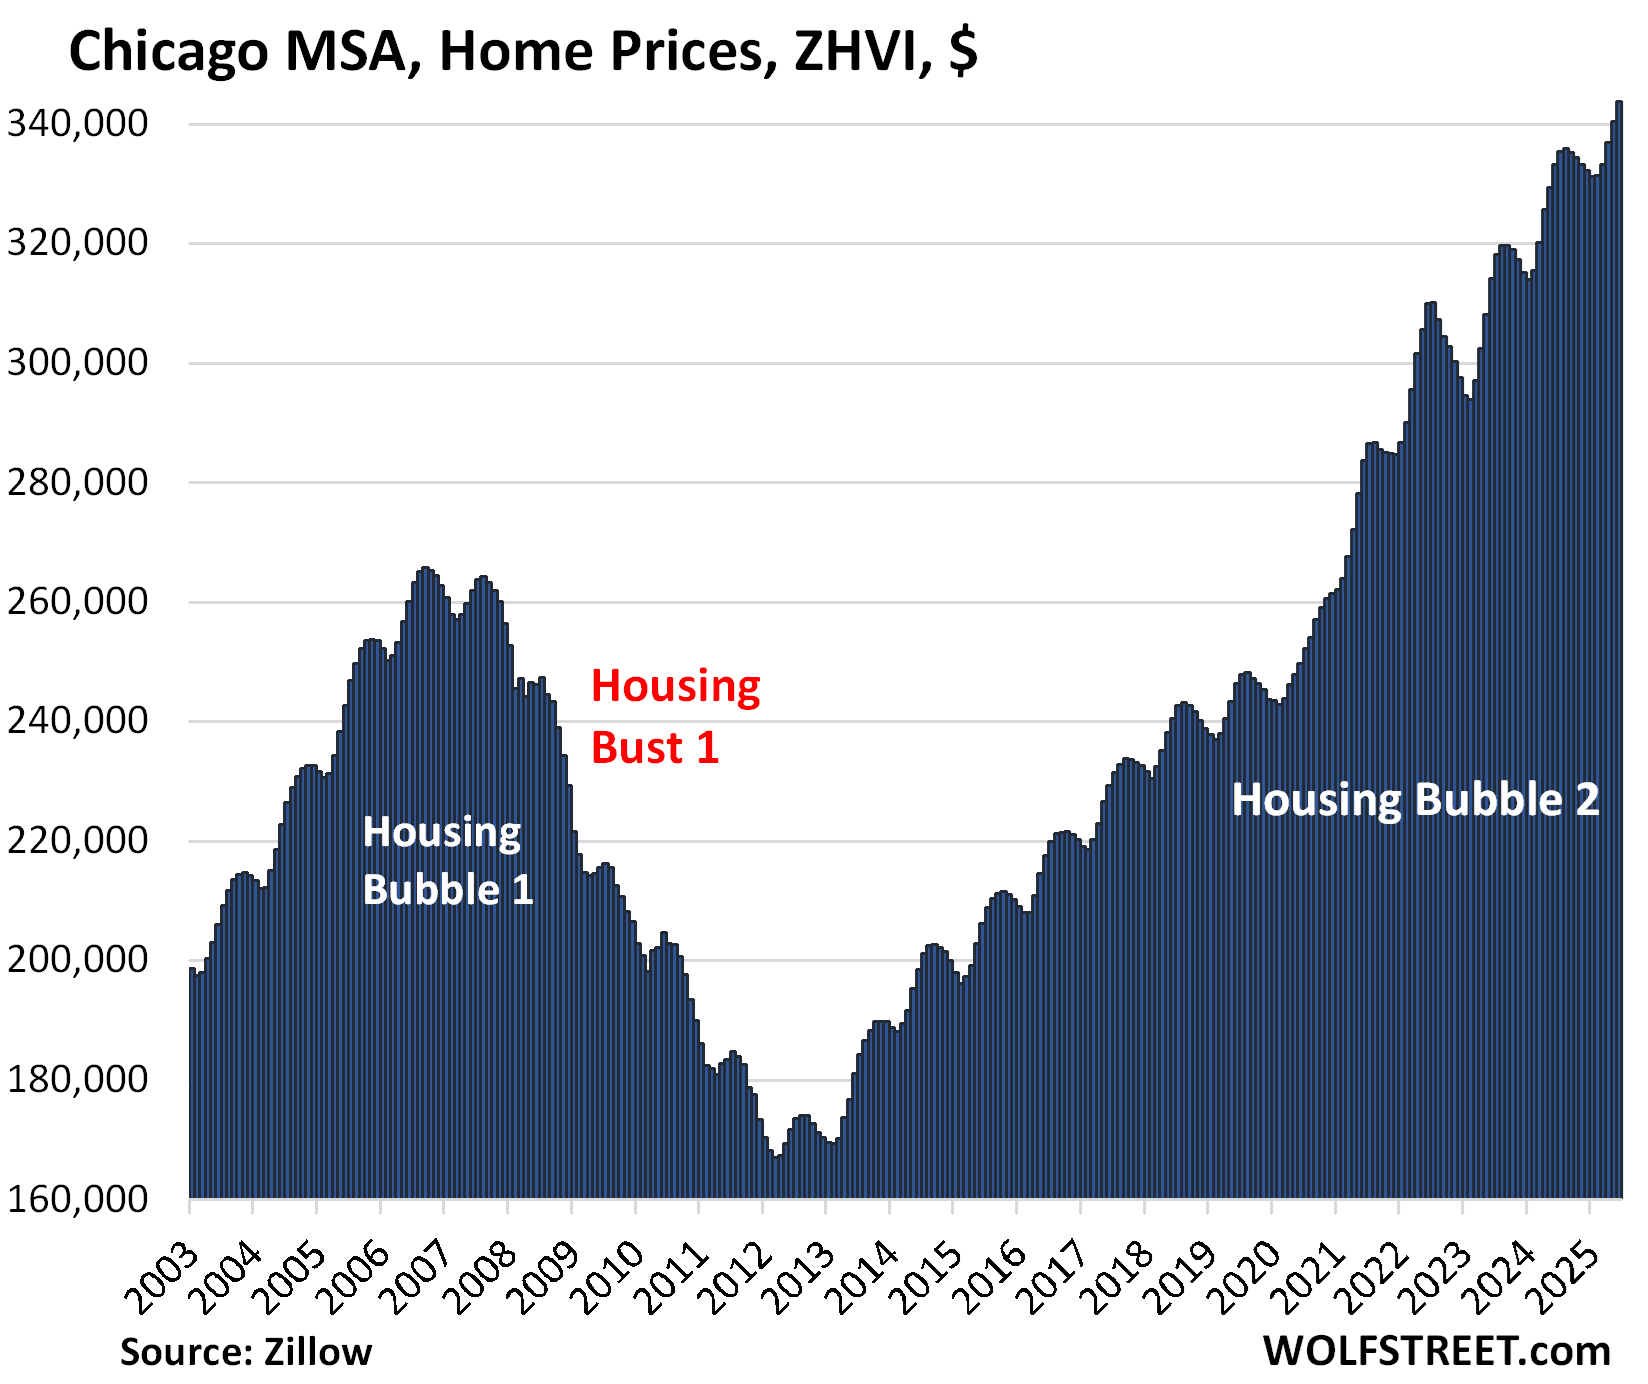
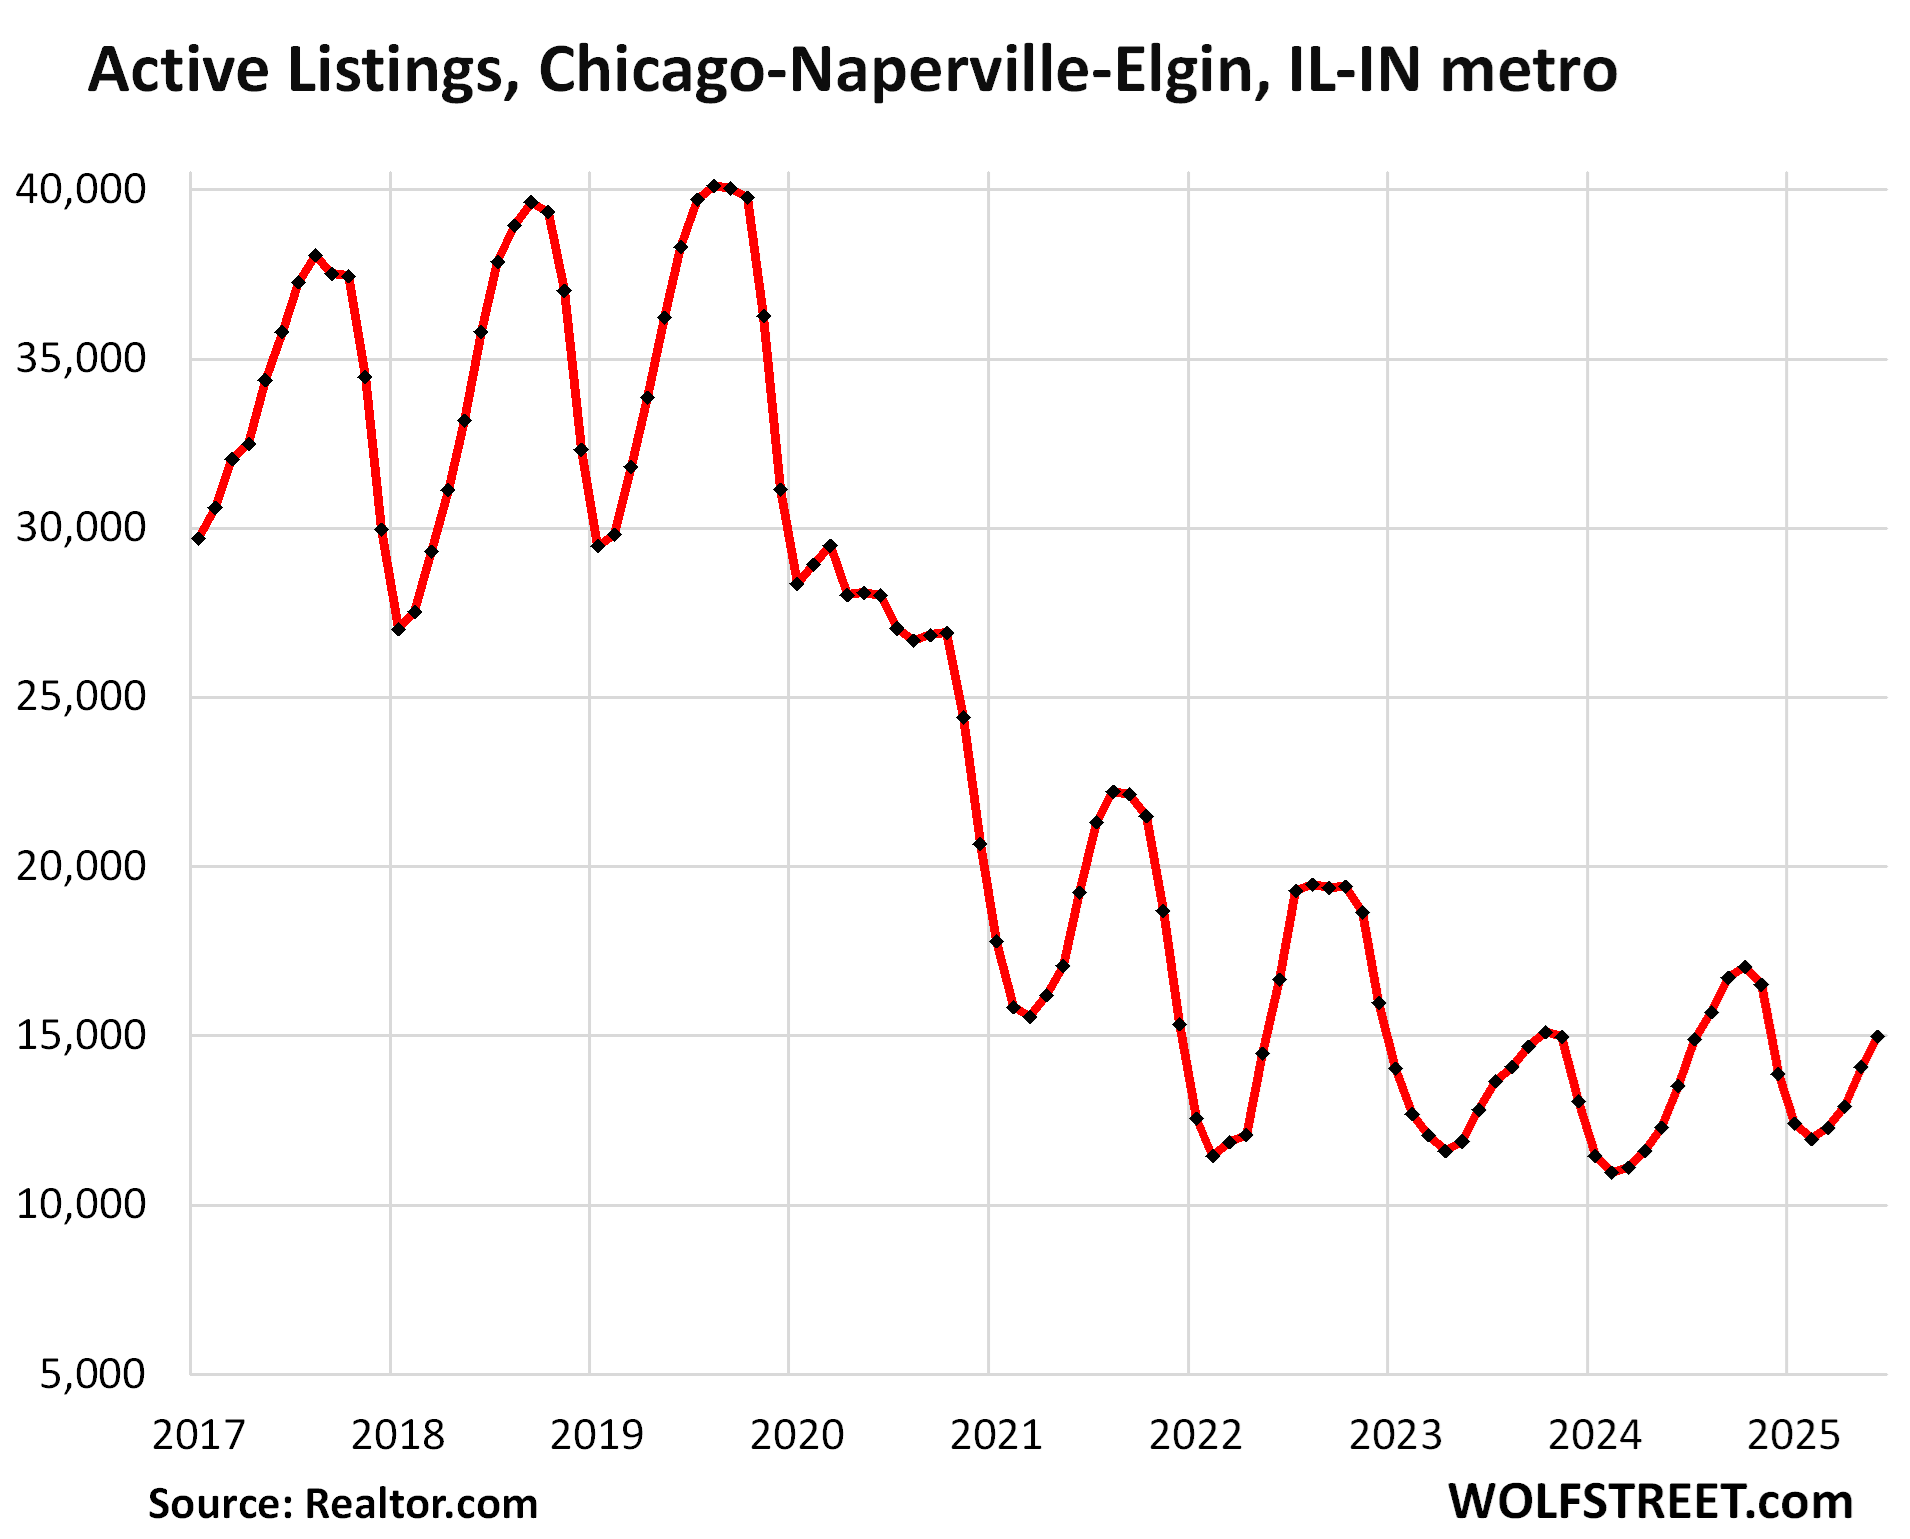
And here is the inventory in the Chicago metro:
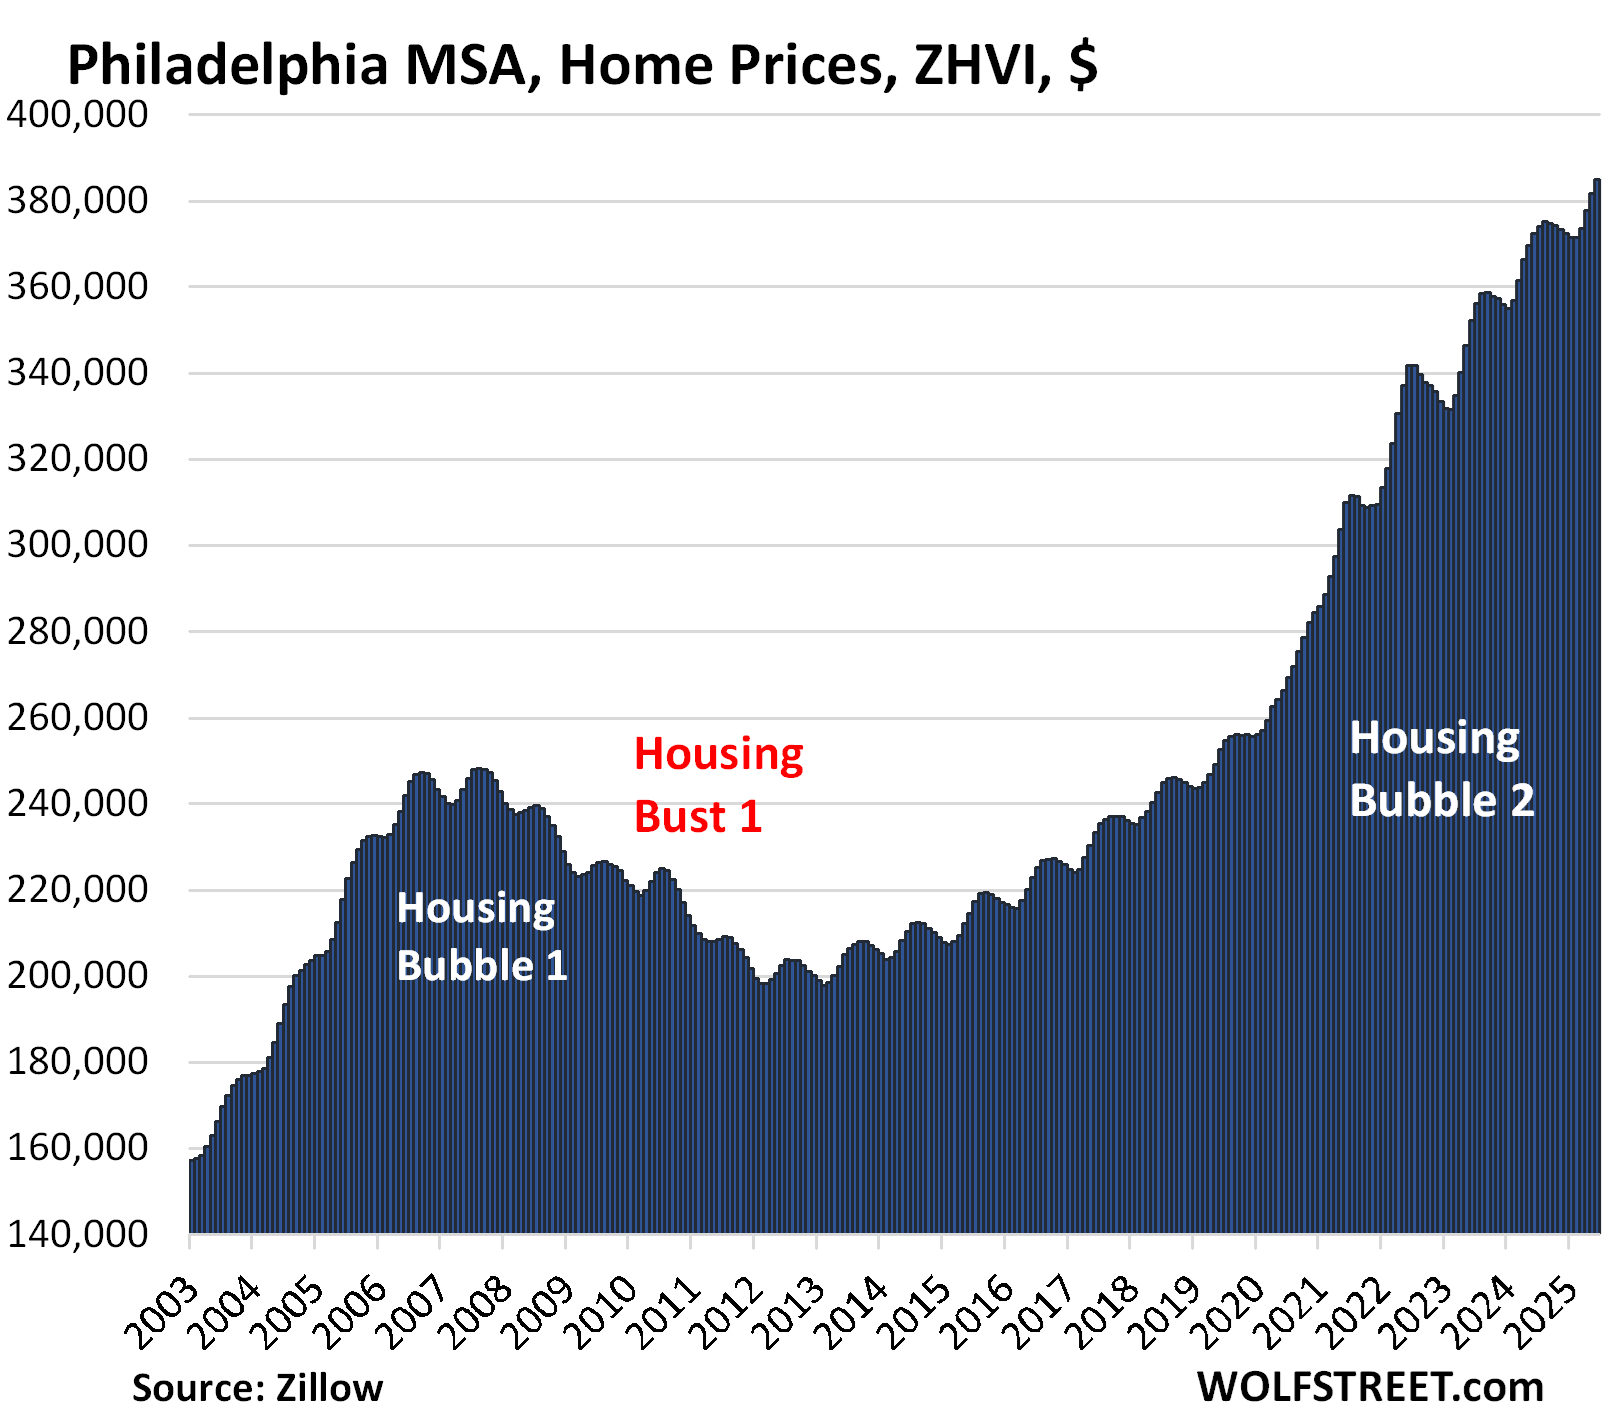
| Philadelphia MSA, Home Prices | ||
| MoM | YoY | Since 2000 |
| 0.8% | 3.3% | 210% |
| New York MSA, Home Prices | ||
| MoM | YoY | Since 2000 |
| 0.7% | 4.1% | 219% |
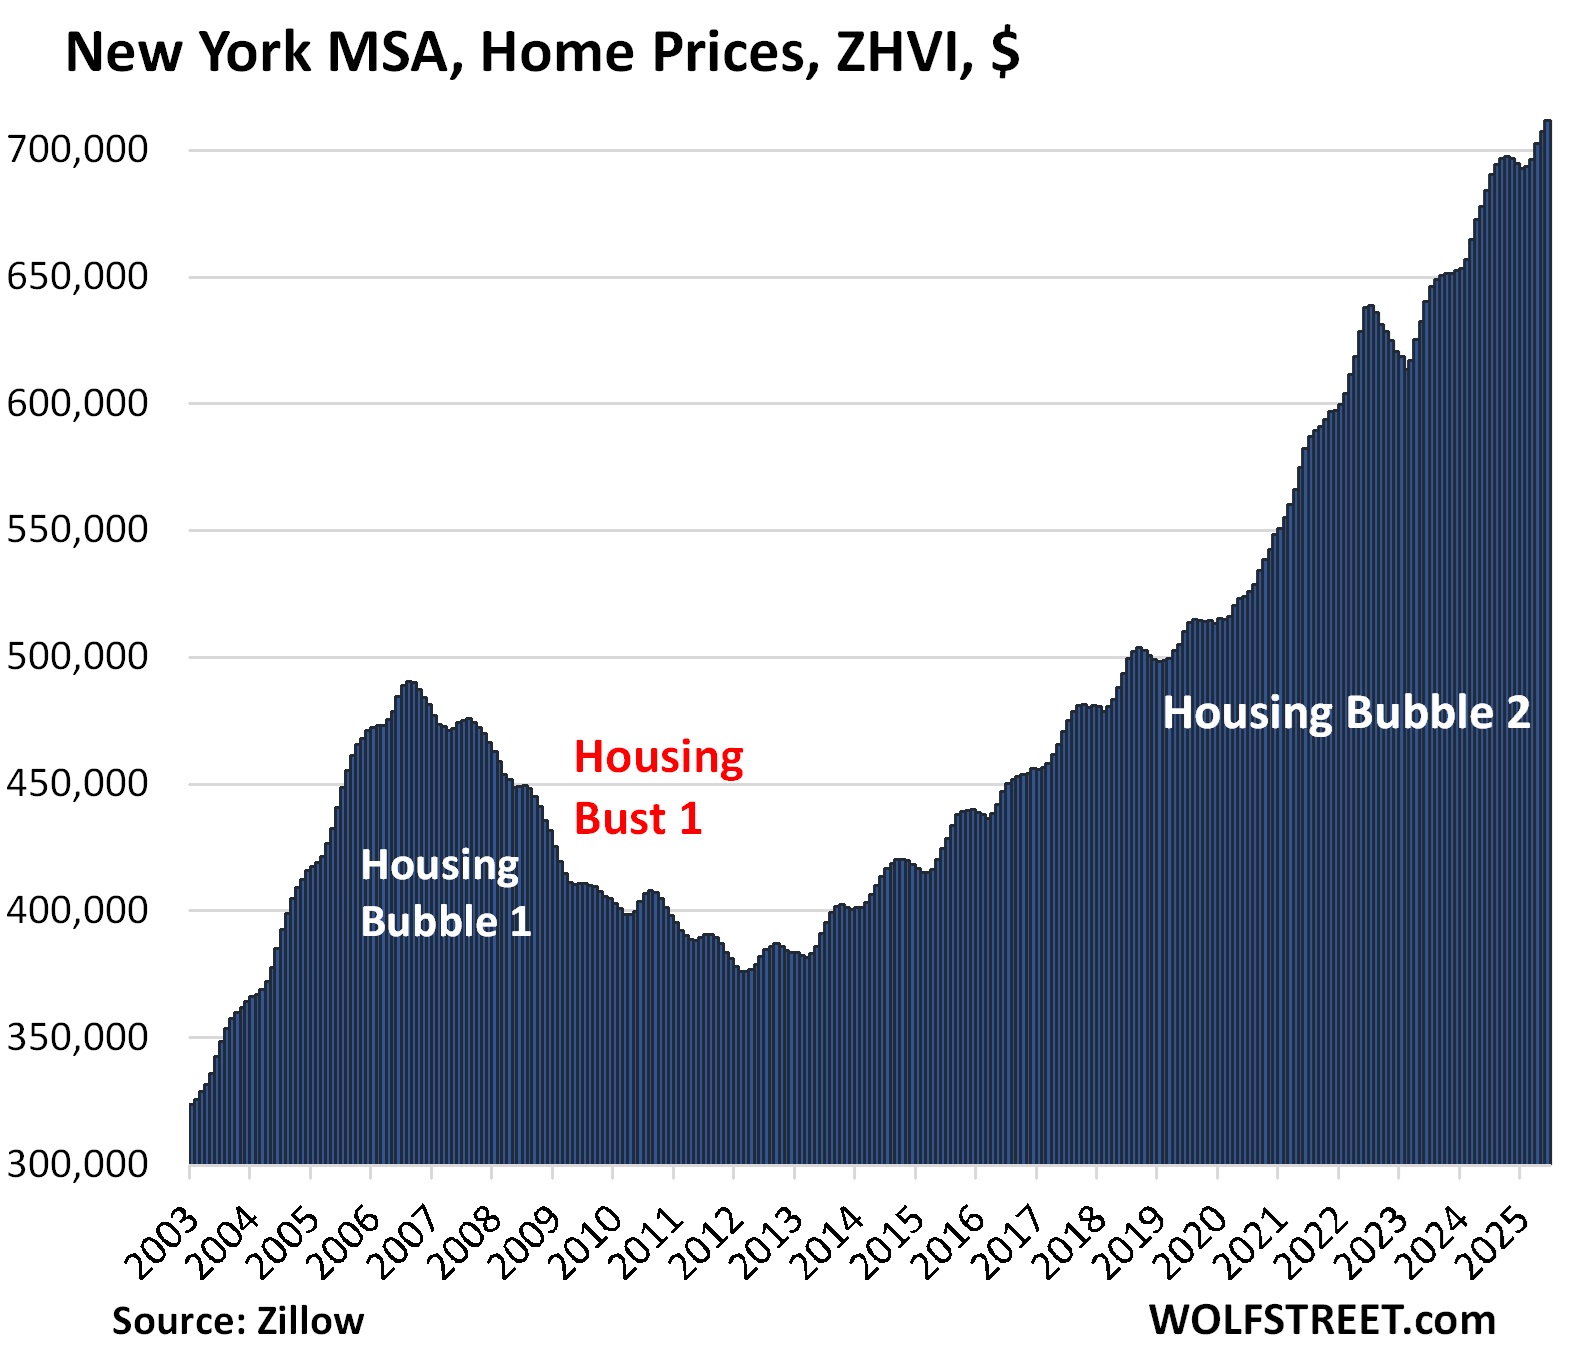
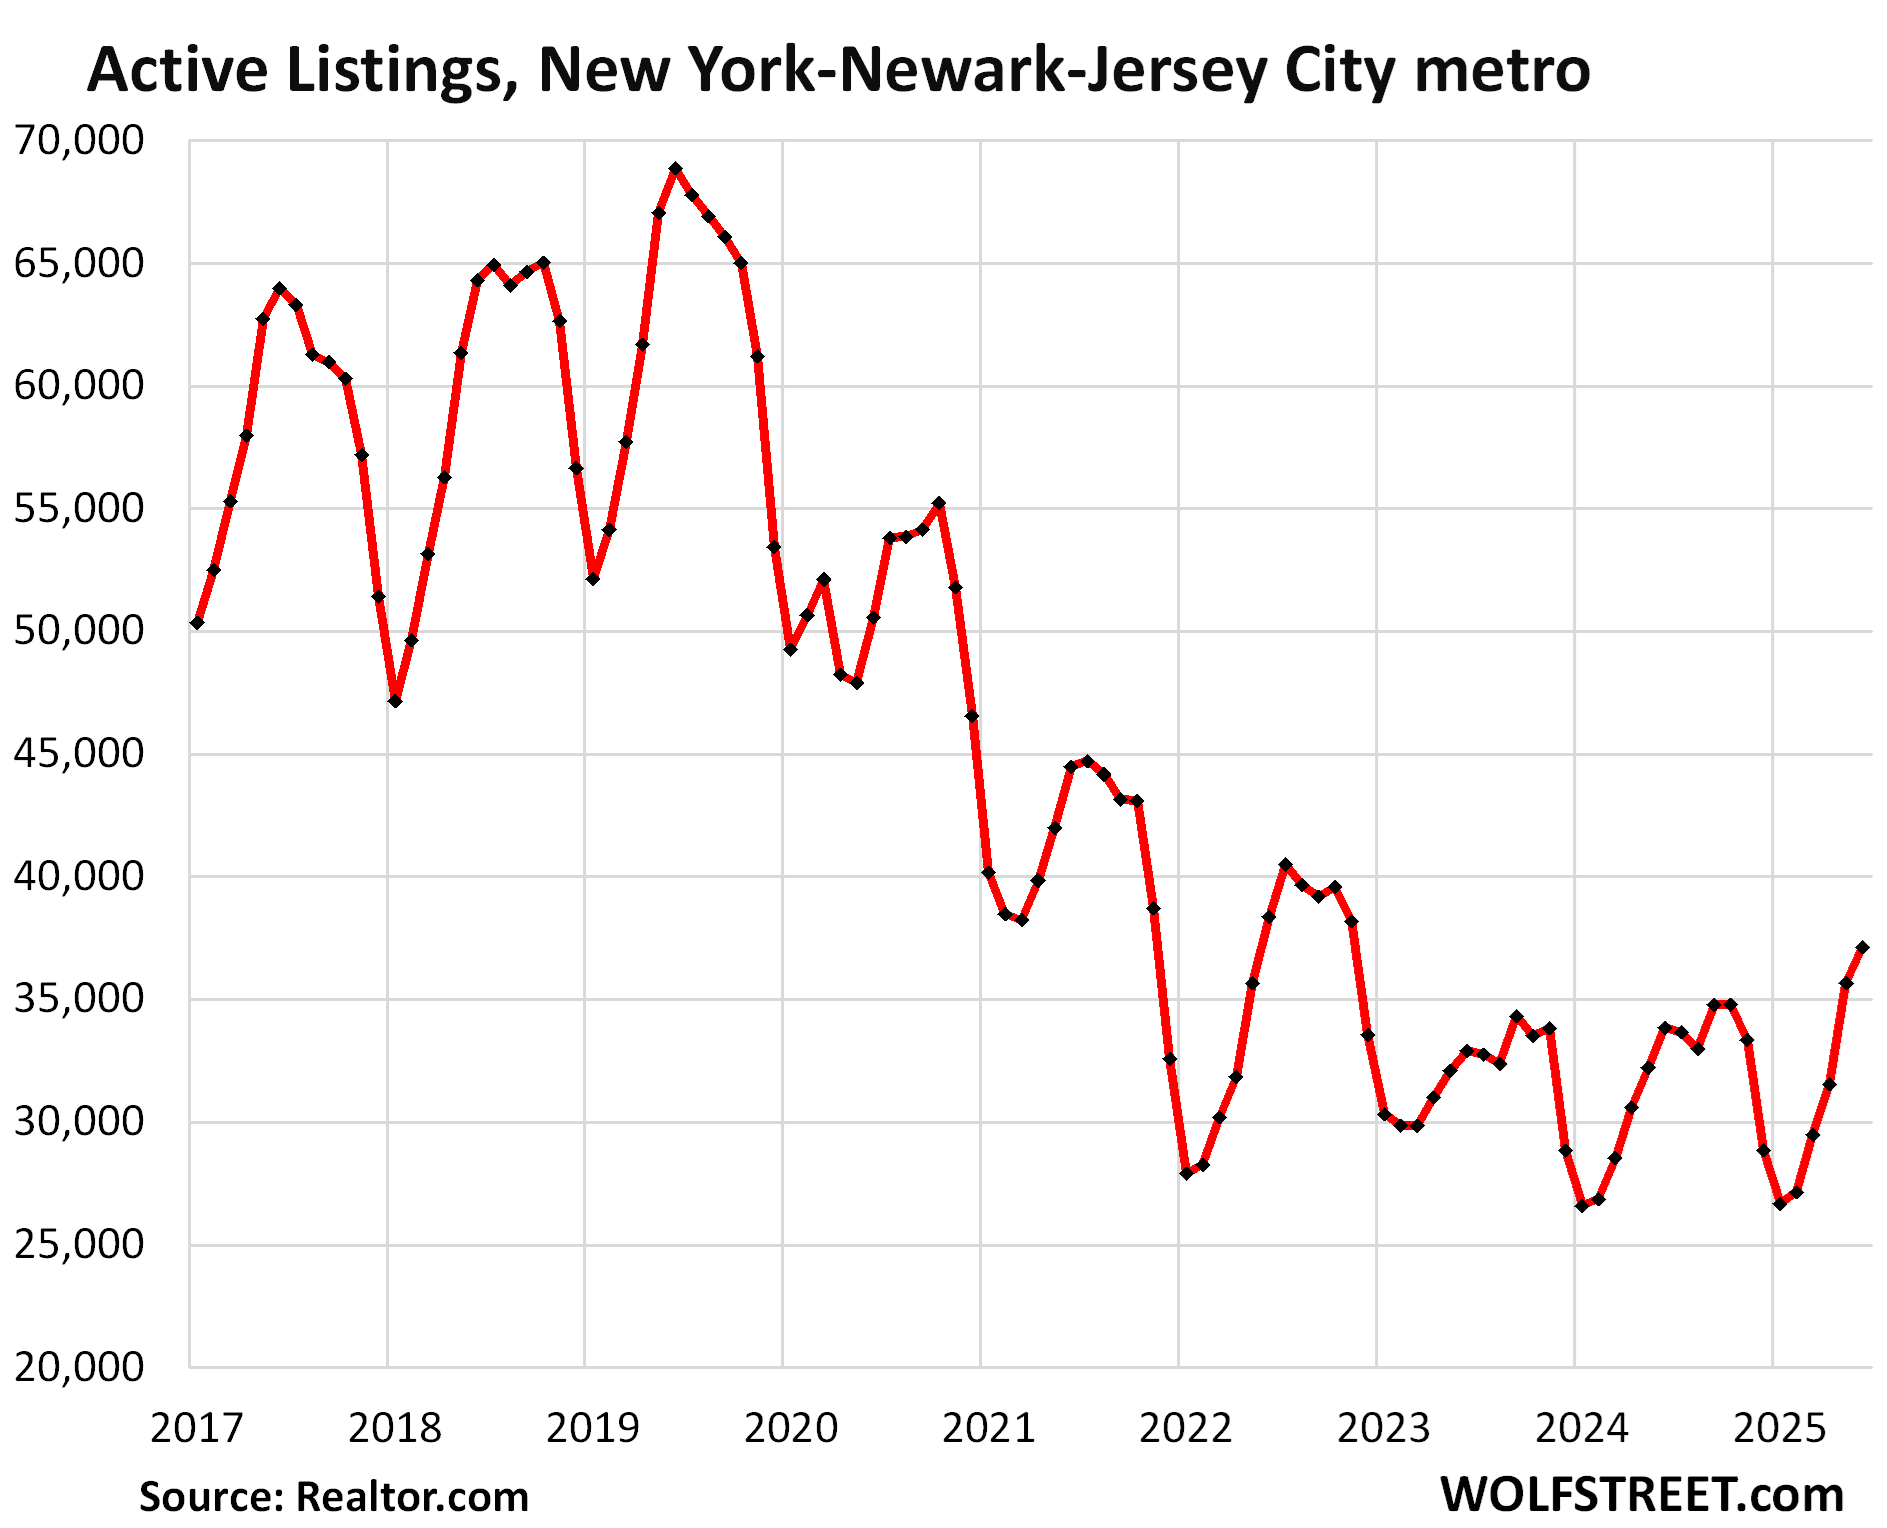
And inventory in the New York MSA:
Enjoy reading WOLF STREET and want to support it? You can donate. I appreciate it immensely. Click on the mug to find out how:

![]()
The negative changes from peak 2022 prices are pretty telling, but I’m curious why there’s no mention of percent differences for the ones still above the 2022 peak. It’s gotta be declining by the month and would be interesting to see.
I’m collecting the declines from “2024 peak.” But as you can see in the charts, those are recent, sometimes less than a year, sometimes a little more than a year, and they need to mature a little, so to speak.
There are many neighborhood in New Jersey, to get a house, you have to go through a bidding war , you conveniently missed New Jersey
” you conveniently missed New Jersey”
1. this was about metros (metropolitan statistical areas, or MSAs), not states. New Jersey is a state not an MSA.
2. The most densely populated part of New Jersey IS included in the New York-Newark-Jersey City MSA, see last two charts, prices and inventory.
The Los Angeles area appears to be stuck in limo at record high prices.
I ❤️ love the expression “Los Angeles area appears to be stuck in a limo at record high prices” and I may purloin it from you in the future.
an updated “permanently high plateau”
Governments at every level has been trying to increase supply in order to curb prices, or at least price increases. That’s why they’ve changed zoning to allow more condos to be built, and research has shown that even supplying the market with luxury condos eventually helps increase supply of non luxury condos as people move upwards.
So at least can we all agree that what’s happening in the housing market right now is what everyone has been wanting, and we’re seeing the success of policy changes to increase supply and calm prices for the average person. I.e. this is a good thing and maybe even a healthy thing for the market/nation?
Or are people upset that prices are starting to drop meaningfully? I myself have a real estate portfolio and I’m not mad about this. But I’m in for the loooooong term.
Aka stuck in lambo at record high prices? Lol.
Los Angeles is land locked opposite of Dallas.
Wolf, thanks for the great information and charts. We’ll see how far down these markets go.
Ditto Wolf. This is my favorite economics topic.
MW” Fed’s Williams says tariffs are pushing up inflation, and he expects even higher prices in coming months
We may well get more inflation in the coming months, but someone should email him my analysis:
https://wolfstreet.com/2025/07/15/feds-nightmare-cpi-inflation-in-services-reheats-not-tariffed-while-inflation-in-durable-goods-apparel-footwear-tariffed-remains-cool/
Why is it so hard to find more people as smart as you?
https://www.pewresearch.org/short-reads/2024/12/09/roughly-half-of-americans-are-knowledgeable-about-personal-finances/
Only 50% of the US population have sufficient financial literacy. What do you expect? Plus many people don’t understand why inflation from service sectors keeps going up.
It has nothing to do with intelligence – the entire US government and corporate world are shot through with corruption. It’s not about doing the right thing, it’s about lining the insiders’ pockets.
Wolf hasn’t been bought and paid for to push a specific narrative. So I disagree with Depth Charge in that I think it takes both integrity AND intelligence to call it like you see it and analyze the data in a manner that is both clear and consistent. Wolf is rare in having both as far as I can tell over the last several years, though we’ve disagreed on occasion.
Thank you for putting this together and sharing. The graphs really put the sheer magnitude of this into perspective.
This article really hits home. I live in Orlando and in February a neighbor of mine listed their home for $1.05M which aligned with all of the online estimates. That is double what they paid for it in 2014. Four months later they closed for $825k. The air is leaving the bubble.
Trigger warning: quick maths.
Let’s assume a 20% down payment, an average $500 per month maintenance, and a 5% mortgage.
Sale price of $825k – $315k remaining mortgage balance = turning $100k into $510k in 11 years.
Even with the $500 per month maintenance, that’s a 12% rate of return.
Not bad! Especially if they had a less than 20% down.
lol so you ignore property taxes, HOA and insurance monthly costs? Classic!
Total payments over 11 years – $480k + $100k down payment so total cost over 11 years was $580k.
People need to stop thinking of the house they live in as a good investment. It’s not – it’s a place to raise your family. Quit falling for the realtor propaganda.
Cause Math is hard plus certain groups are very good at willful ignorance…lol
The same family would have to live somewhere. Figure $3K rent…. over 11 years is $396K. The $100K down isn’t lost unless the value of the house (aka resale value) goes to zero – which is unlikely in most cases. Therefore, the cost of ownership is @ $80K. You’re also discounting any opportunity for price appreciation. As a renter you have a box of receipts. That’s it.
Many homes have no HOA. Straw dog. If you rent, you have renters insurance unless your a total putz. Is the insurance a wash? Obviously not. But if you’re living in a $500K home, you likely have more than $110 a year renters premium. And let’s not forget liability insurance because if you have someone do work for you at your expense, you could be on the hook for any accidental injuries – like the furniture delivery guy that slips on a banana peel your kid left in the foyer.
You are right that it’s merely a place to raise a family. However, in many, if not most, situations, ownership trumps renting – unless you’re a gypsy who moves randomly on a whim.
Yes, maff is hard. Especially when you’re predisposed to be an ownership hater.
PS: The house I presently live in is paid for. How? From the profits from the sale of prior homes. Any “investment” has been recovered as well as any mortgage taken out as well. In other words, it’s a free house. My “mumphly” is property taxes (@ $200 a month), insurance (HO5 plus flood because I’m stupid) is $150 a month, which could be less if I reduced the content coverage. and a HOA (which includes cable TV and trash) of $400 (trash and cable pencils to @$200 of that). So, I live in a 2,600 square foot ranch with a 3 car garage on 1/2 acre for $550 a month. Utilities apply equally to a renter as to an owner. Maintenance? Most I do myself. Climbing palm trees, not so much. $270 this year. I have never spent $500 a month on maintenance. I can assure you that any mortgage payment I had was far less than the rental cost, even considering the lost opportunity on the cash down. (My last mortgage was $715 a month and the taxes were @ $800 on a single family in Orange County, CA – Seal Beach to be exact)
I could do similar “analyses” to yours on subjects like golf memberships (100% waste), boats (a hole in the water you pour money into), luxury cars (what’s 2 YO Taycan worth today?), dinners out ($0), diamond jewelry (1/4 of retail if you try to sell it back to them), luxury watches, and so on. The good news is, no landlord can raise my rent nor sell the house from under me. I don’t have to deal with management companies, fake BS “damages” upon lease termination, no first and last plus security nonsense…. And the funny part is that, if the market falls 33%, I’m still money good on this hovel. And… oh the view.
Those are in the $500 per month “maintenance” assumption. Read the comment before getting angry.
100% agree. My wife and I had to buy in this bubble, but it isn’t a Boomer investment scheme. We plan on staying in our house for at least the next 20 years. The area is good, there is no HOA, and the house is appropriate for our long term needs/wants. Buying a home is a long term plan, not a five year investment opportunity.
Coulda just bought the S&P… ~same return but with no work.
I wish there was a “like” button here! ^^^
If you sunk the money into the S&P you would have had to also pay for housing with other money.
S&P would have had to significantly beat the housing return for the S&P option to be equal or better.
With RE, you can leverage 80% to 97% of your purchase price to juice returns in rising markets.
I did the math. Our investment condo returned around 10-12% a year (including appreciation), a balanced stock portfolio does the same. Real estate is taxed higher than stock returns, so stocks get a slight edge. However, real estate is very stable, it’s not going anywhere. There are pluses and minuses to both. Of course…. it all depends on when you buy, how much you paid…and if you sell high or low.
This right here is why the housing bulls love talking about median sale price. This transaction still made median sale price number go up, even though it sold at a substantial discount.
“We’re going to need a lower rate”
Ha! Kind of the way they needed a bigger boat in Jaws. Appropriate for the 50th anniversary of that film.
I like the home price % change from a year ago graph Wolf. Very telling.
Here in flyover southwestern Ohio some market changes are taking place. First, not all the new residential RE listings are completely overpriced. Many are, but not all. That in itself is a change from 1 – 2 years ago.
Another change is the length of time (some) listings are sitting on the market. That has increased.
Despite those changes, many new listings still have “fund my retirement” prices. Many sellers apparently think they are still entitled to 2022 pricing.
My overall take is that while the market is slowly changing, this is still a “less bad” market for buyers. Not a good market but a less bad market. I think the suspicion that residential RE prices are starting a long-term decrease is becoming more prevalent. Patience may pay off here for those who have the luxury of being patient.
One lesson outta all of this?
Excessive QE/ZIRP and pervasive financialization of asset values alters risk calculations toward the outer sigmas.
“Patience may pay off here for those who have the luxury of being patient.”
I never see real estate/home purchase as urgent. One can always wait it out in a rental home for couple of years.
So, everyone has luxury of waiting it out.
Sorta related to the stacks of housing charts that look like exploding volcanos, that spewed out lava — now the shows over.
Where in the hell did all that speculative cash come from, to fuel that friggn cycle??
We kinda know the GFC Bubble had ninja-related tentacles, with a tsunami of unqualified buyers and over leveraged stupidity — but, this pandemic bubble has been an unprecedented, unthinkable, unknowable nuclear explosion of wealth transfer/distribution (disruption) — but, like how — where did this magic money come from — how was it pulled forward to such a mutated level??? Is this the aggregate culmination of baby boomer retirements?? This is really crazy!
It wasn’t stimulus, it wasn’t savings— it wasn’t the deficit — if it was loans, what was the collateral — and how does this really play out? I don’t think this ends well (as usual).
From a friend:
In 2020, the total value of owner-occupied real estate in the U.S. was approximately $31.6 trillion. This figure grew significantly to reach about $47.9 trillion in early 2025
Over 90% of buyers in my area are on mortgages.
The explosion in house prices is a direct result of a wild borrowing binge. Why banks loaned out into existence trillions over trillions of new debt in such a short span of time? Who knows.
But societal damage is BIG with hurt family formation, tanking birth rates and an extreme household burdening with debt servicing costs.
The reckless Fed applied ZIRP for 6 years. Banks had few choices. One obvious option was to buy treasury bonds, and they quickly lost 40% on those.
The Feds framework was obviously flawed, and they haven’t adequately explained it or admitted it, so there’s high risk the flawed mindset still exists.
The Fed shouldn’t fear recessions as much as it does. When the Fed consistently overshoots the inflation target by signifant amounts for many years, faith in monetary policy is lost.
Hurt family formation is due to chicks realizing they don’t have to put up with dudes’ BS anymore. As a result, dudes are getting more hate filled and even less attractive.
Also, maybe hormones are changing? Not certain about this, but could be our artificial diet.
Free money = QE make stocks go boom.
This is a dumb, myopic gendered statement that only shows your lack of thinking.
You obviously have never attracted a good male.
I have asked myself this question many times, where did all of this “magic money” come from? It is such a large sum in such a short amount of time that seemingly came out of nowhere.
My profession allowed me to see so many of these transactions happen in real time (broker), every couple of months or so I was certain it would stop/break but just kept going higher and faster. Was pure insanity really
You can thank the likes of Paul Volcker who was quoted in the WSJ in 1983 that the Fed: “as a matter of principle favors payment of interest on all reserve balances” … “on rounds of equity”. [sic]
The artificial suppression of long-term interest rates coupled with the all-time record growth in the money stock propelled the most vulnerable assets impinged by this surfeit of loan collateral.
Valuations driven from loan collateral generally depend upon Gresham’s law: “a statement of the least cost “principle of substitution” as applied to money: that a commodity (or service) will be devoted to those uses which are the most profitable (most widely viewed as promising), aka, the Cantillon Effect.
As a point of reference:
In 2006, the total aggregate value of all houses in the U.S. was estimated to be around $24 trillion
In 2020, the total value of owner-occupied real estate in the U.S. was approximately $31.6 trillion.
Obviously, subjective numbers and appraisal values all over the map, but just curious about general baseline:
Residential investment reached a high of 6.3% of GDP in the last quarter of 2005, fueled by the housing bubble —
In the first quarter of 2025, the combined contribution surpassed 16% for the first time since 2022.
Looking back, the Greenspan era of low rates, fueled bubbles — then Bernanke, downplayed the impact of low rates, as he engineered zero rates and force-fed zombie ghouls with easy money for an eternity.
Along comes pandemic, more free money to pump the wealth effect into the greatest financial bubble in Earths history — and now, of course we have someone flailing away, screaming for zero rates, so we can spray jet fuel on the existing volcano.
As an insane commenter, I have to beat my head against the Buffett Indicator, and think about what it might mean, to pump up the wealth effect in housing and financial assets — from the current insane levels.
Maybe, as a society, we are moving away from building stuff, which kinda touches on the general philosophy of reshoring manufacturing, so that in the future, our grandchildren can put screws in smartphones — and apparently that would play out in GDP growth —- but, on the other hand, what we’re really seeing, is a sustained policy to financialize housing and anything not bailed down, in order to pump the wealth effect, through speculative manipulation (that contributes to GDP growth).
I think the two approaches are not compatible — I don’t see a chain of events, where investing in robotic factories, results in generating a wealth effect that spills out into higher hone prices and higher gains in speculative assets.
The debt burden and servicing costs to create a new science fiction society has to compete or coincide with a deficit burden that constrains govt spending — which leaves the private sector scrambling to find cash to build obsolete factories, which won’t stimulate GDP — or fuel another housing bubble.
That leaves the tried and tested model of fueling speculation as the only means of pumping the wealth effect — which now, is apparently a crypto pump and dump campaign, camouflaged as a 401k window of opportunity …..
Nonetheless in the bigger picture, seems as if these volcano chart patterns have reached peak lava explosion splatter, spewing upward, and now, lava flowing off the lip of the ruptured mountain wall. Gravity and time will smooth out this peak insanity.
Nostradamus #799
as soon as mortgage rates come back down, to the moon!!!!
1. back down to 6.3%? LOL
2. Mortgage rates came down a lot in Canada (they mostly have variable rate and adjustable-rate mortgages), and in the formerly hottest and biggest market, Toronto, prices continue to drop and are down by 22% so far. Once the bloom is off the rose, it’s off:
https://wolfstreet.com/2025/07/15/the-most-splendid-housing-bubbles-in-canada-june-2025-single-family-condo-prices-plunge-to-multi-year-lows-in-toronto-hit-record-high-in-montreal/
Canada: Pre-Covid share of variable rate mortgages were about 10%, then shot up to 50%+ with the massive rate cuts, came down, then shot back up with BoC cuts 42% of all mortgages.
I think this is very dangerous. Everyone seems to think the BoC can control the interest rates but if the US drags everyone down an inflationary pathway (Trump firing Powell: Making Inflation Great Again) also those variable raters are going to be in trouble along with our financial system.
Actually would need mortgage rates to go back to 3%, stimulus checks to go out, and pause loan obligations – then to the moon.
5 or even 4% mortgage rates doesn’t fix the monthly affordability problem. Luckily people aren’t falling for this stupid lie as much as they did in ‘22 and ‘23.
Marry the house and date the rate was pure realtor propaganda
“Marry the house and date the rate was pure realtor propaganda”
Two-Timing is rarely a wise strategy.
You wonder if foreign buying of real estate will change with the drop in the U.S. $
https://cms.nar.realtor/sites/default/files/2025-07/2025-international-transactions-in-us-residential-real-estate-report-07-09-2025.pdf
Here is one of the charts from the NAR report you linked.
Note that there are two types of purchases:
1. Dark blue: by “non-resident” investors that remain overseas and purchase for investment-purposes, and often the home remains vacant;
2. Light blue: “resident” foreign buyers that live here and work here and live in the home that they buy.
It’s the non-resident buyers (dark blue) that helped drive up housing costs in those few markets where they’re really active. But that activity has plunged by 72% since 2017 after China imposed stricter capital controls.
National Realtor Association data
From April 2024 to March 2025 Chinese bought 11,700 homes worth $13.7 Billions
Mostly in SoCal particular cities like Dana Point, San Clemente, Mission Viejo …
Now we know why last year not only housing price went up last year but also in such an insane % increase in these areas …
Chinese purchases have plunged by 71% from 40,600 homes in 2017 and 40,400 homes in 2018 to 11,700 homes in the current report “2025” that you cited, LOL
According to press releases, the amount of spending by foreign buyers was a record amount in dollars:
“Foreign buyers are flooding back into the U.S. housing market, spending a record $56 billion on American homes over the past year. “
SocalJim
$56 billion a “record”??? LOL, that’s a big-fat malicious LIE. Purchases in dollar terms collapsed by 63% in 2025 from the ACTUAL RECORD year, 2017, when foreign buyers bought $153 billion in homes. In 2018, they bought $121 billion. There were four years with over $100 billion in purchases.
Read the report for yourself (it’s linked above, page 13) and quit abusing this site to spread your propaganda lies and idiotic bullshit. You think no one can actually read the report that is linked above, and that you’d get away with it??? That shows how your brain got polluted by your own lies and propaganda.
05/1/2024 ,,,,, 3376.1
06/1/2024 ,,,,, 3379.7
07/1/2024 ,,,,, 3302.2
08/1/2024 ,,,,, 3321.1
09/1/2024 ,,,,, 3236.8
10/1/2024 ,,,,, 3211.6
11/1/2024 ,,,,, 3256.8
12/1/2024 ,,,,, 3240.4
01/1/2025 ,,,,, 3255.6
02/1/2025 ,,,,, 3261.2
03/1/2025 ,,,,, 3408.3
04/1/2025 ,,,,, 3355.0
05/1/2025 ,,,,, 3262.9
Total reserve balances have been flat for 13 months. That is a restrictive money policy. Inflation is destined to fall in the last part of 2025.
Steve Hanke recently showed a graph on a pod cast and said that U.S. money supply was flat-ish (my term) since mid-2022 and predicting a contraction.
Hanke’s no expert. He has a new book but I’m not going to read it.
Dr. Steve Hanke: “WSJ Aug 5th, 2021
“The notion that a trillion dollars in reverse repos has reduced the money supply by even one dollar is nonsensical. Reverse repos are a liability of the Fed and an asset of the banks and money-market mutual funds (MMMF) that loan funds to the Fed via reverse repos. Deposit liabilities of both banks and MMMFs are constituents of the money supply. These liabilities remain unaffected by the choice banks and MMMFs make about whether to place their assets in the Fed’s reverse-repo facility, Treasury bills or elsewhere. Contrary to the Gramm-Saving analysis, the Fed’s reverse-repo program has no effect on the money supply.”
Contrary to Bernanke, money is not neutral in the short or long term. Money is the measure of liquidity, the yardstick by which the liquidity of all other assets is measured.
Maybe, do reserves matter or does the velocity of money matter? And which money, there are a lot of different flavors of currency out there. Trump seems determined to sell off U.S. assets, so, hypothetically, do the reserves at the Fed and U.S. banks matter at all if foreign currency and foreign dollars start rushing back into the U.S? I think not.
So you say it’s housing bubble 2.0. If you can say with confidence it’s a bubble, at what levels would you estimate the froth to be burned off? Any particular metrics to keep an eye on?
SuperHans,
How are you going about multiplying wealth when bubble bursts. What’s the plan? Please share of you can. Thank you in advance.
Agree that patience is key here. I have none left.
Easy. Sit on tbills until assets hit historic trendlines. There’s a reason they are revisited for the past 100 years or it wouldn’t be a trend. S&p at trend would be around 2,100. Every valuation metric nearing 4 standard deviations above trend. 1 or 2 used to be madness zone.
Prices still have a way to fall. In general, if the median wage cannot afford to purchase AND maintain a home at the median price, then you have a bubble, period.
Off topic, but the house passed the genius bill paving the way for corporate-owned crypto currencies regulated by the Fed. So a new private monetary system with no oversight from congress? Hmm, even more merging of corporations and the state, now where have we seen that before in history…
Hedge accordingly.
RE: crypto currencies comment
In the private currency market, the goal of the artificial currency maker is not only to survive another ten years into the future but to take down the opposition along the way ensuring long-term viability.
Navigating the bitcoin world has become harder as more brands of “coin” proliferate, the government steps in with proposals of its own and news reports continue to be generally friendly to the various bitcoin currencies. A bit of cynicism would help, in this as with other matters of real life (particularly matters of the heart).
The value of crypto currencies is determined by factors of uncertain import that are changing day by day. My own personal guess is that one day there will be a clear winner and the holders of that currency will profit, but until then all bets are off.
Thanks for the comment. Regardless, it’s a pipe dream of mine to return to a constitutional monetary system that rewards production and innovation. Production and innovation require real resources and refined materials, perhaps why gold silver, and other commodity-based systems continue to resurface. It’s pretty clear that the greatest CON in the history of the planet has been the financialization of everything. Rewarding bad behavior and punishing productive/good behavior along the way. Empires come and go I guess. As the saying goes, full FAITH and credit. In a nutshell, it looks to me like RISK is being repriced globally and some see these “financial products” as a useful store of value while things shake out. I am not convinced.
“[5] To coin Money, regulate the Value thereof, and of foreign Coin, and fix the Standard of Weights and Measures;”
I’m no legal scholar, but it seems to me that Congress could define the USD as just about anything, and it would be constitutional.
Wish more would have come to the realization. Financializing all resources & material has always been the beginning of a downfall of any empires throughout the history. The ideal of financializing really is rooted in the desire of controlling everything. Instead of being incentives, true liquidity & reward system, money has become a tool of control which alone doesn’t bring any real economic growth nor beneficial usage of resources. Average minds can’t understand the inflated “wealthy” in their mind is an invisible chain on their neck. Only then they willingly eagerly participate this “hunger game”. When median income can’t support median housing price. When American dream is dead to younger generations, something is seriously wrong.
“In general, if the median wage cannot afford to purchase AND maintain a home at the median price, then you have a bubble, period.”
That’s incorrect. We should never expect the median income to afford a median home.
Just because you have low expectations, it doesn’t mean the rest of us should. LOL!
Dreams of a bygone golden age. Feel free to venture beyond the all-inclusive resort.
Wolf, would enjoy your thoughts on the idea that high house prices are causing an increase in the number of Americans who see renting their whole lives as just fine. Do you think there’s a structural change happening in American culture regarding the social desirability of owning?
Gotta love MSM, you have to drum up that FOMO right? This was all over Bloomberg, NY post..etc. Who knows, maybe this is more relevant in places like Irvine, SGV and a lot of SoCal cities…
“Chinese Buyers Spent 83% More on US Homes This Year”
Chinese purchases have plunged by 71% from 40,600 homes in 2017 and 40,400 homes in 2018 to 11,700 homes in the current report “2025” that you cited.
What the stupid-ass AI-powered media, paid for by the lobbying group NAR, are hyping is that the 2025 purchase have come up from the record low in the prior year of just 6,000 home purchases, LOL
I’ll just repeat this here: It’s the non-resident buyers (dark blue) that helped drive up housing costs in those few markets where they’re really active. But that activity has plunged by 72% since 2017 after China imposed stricter capital controls.
Yup thanks Wolf….the moment I read the “data” came from NAR, not much dissecting is needed…
for the FOMO sucker buyers on the fence right now though, this type of articles are certainly trying..
Wolf I love your graphs and data, and coverage of these topics.
What do we think about the metros who are not off-peak and reaching new ATHs? e.g. Columbus, Ohio … are the flashy metros like Austin leading indicators for declines elsewhere or will the less popular metros see big gains as people go to the for “affordable” housing?
Chicago with average price $350,000 is not a bubble is more a bargain compared with every other city in US.
Tell me another place where you have high salaries with these housing prices?
Denver? over $550,000 , Arizone?, Boston? Portland? all over $600,000
High RE taxes there. Prices are lower in Texas for the same reason.
The problem with buying in Chicago is that you’d have to live in Chicago.
The pension obligations of Chicago should be enough of a deterrent to anyone with an IQ higher than their shoe size.
You might want to look at the salaries in places like Boston. Phoenix is presently a hotbed of tech due to the influx of corporations and investment from their neighbor to the west. There’s more money there than you can imagine. Where do you see Safeway parking lots littered with Lambos, Ferrari’s, G-Wagons, and Porsche’s as common as Toyota’s? A daily occurrence in Scottsdale or Paradise Valley.
There’s another whole world out there, folks. Gorgeous historical homes, in Galesburg, Illinois…..
“Here’s some information about the housing market in Galesburg, IL, based on data from Redfin:
Current Snapshot (as of May 2025/June 2025 depending on the specific metric):
Median Sale Price: $112,000 in May 2025, which represents a 46.6% increase compared to last year.
Median Sale Price per Square Foot: $86, up 9.6% since last year.
Median Listing Price: $139,900 in June 2025, showing an increase of 24.1% year-over-year.”
Galesburg…. why not Toluca? Or Macomb?
Detroit has some bargains as well.
Oats are always cheaper after they’ve been through the horse.
Yaaaaawwwnn. 🥱
This is a slow motion roller coaster ride. Wake me up when we’re at the bottom. I want off the ride. Wake me up when the ride’s over.
Looking at volcano charts, can’t help but think about inflation and further debasement:
In the U.S., the average home value has increased by roughly 45% since 2015
The value of a dollar since 2015 has gone down 38%
As purchasing power declines, those charts are really gone get uglier
Do you have indicators at the North will follow the trends of other regions? As a person living in the NE, everything still feels inflated (1,300sq flip for $1M, no joke).
Doing some traveling and a few nights ago I was out and met a land speculator and then later a real estate developer. I asked their opinions about our market – the land speculator said his job was basically to assess and recommend the best places to build – he said there’s nowhere in CO they’re recommending for the foreseeable future. Too much is coming on the market and people aren’t moving here anymore (COVID surge is over and people have realized it’s faster to fly here and ski than spend 8hrs in traffic on i70). He said the drop is already starting in certain select communities but that housing was like steering a tanker, it turns slowly, that if I could hold on another year there’d likely be significant price drops in a lot of areas. I got the same story from the real estate developer – Colorado is not ideal for investment and they’re anticipating significant market declines based on a long list of things. Significant wasn’t exactly quantified but it was implied at least in the low double digits from todays prices and likely more in some of the really bubbly areas. Overall though I asked about my favorite places and they both said they don’t consider any of them ideal for investment atm, basically some places will crash hard, some places will crash a little – nowhere looks like it’s going to make them money.
Also these are still non panic price drops – all lot of the collective opinion is controlled by the media. I think as soon as the media turns the narrative to this is a bubble, prices are going down for the foreseeable future – we’ll see the race to the exit. Right now there’s still a lot of people thinking they can wait this out and not cut prices.
the re market looks like it is in a bubble. but its not. 2000s were a true bubble. today’s “bubble” is a direct reflection of the current supply and demand. the moment juristictions authorize building more units, the market responds with a modest price drop as supply increases briefly. the moment supply increases, deep pocketed buyers foregin and domestic buy up all the properties and add them to their rental inventories. this has never been a problem in the US in the past. but it is now. prices will remain high as long as deep pockets buyers from around the world can land bank their money and buy up all the US real estate.
We didn’t have a housing shortage in 2019. Housing prices were slightly correcting as interest rates were slightly increasing.
The housing shortage is a real estate agent narrative
This short term shortage was caused by a lot of vacant properties being held for price appreciation, lots of people (incorrectly) thinking they could get rich from Airbnb with no effort, and mass influx of immigrants which puts upward prices pressures on rentals and has a trickle up effect.
Now yolo travel is dying, remote work is dying, immigration is down, and holding for price appreciation makes no sense (plus lots of people hitting the 2 in 5 yr capital gains exclusion rule needing to get out).
Inventory levels are already significantly above 2019 levels in many cities. Denver is up 30% compared to 2019.
Also note the inventory increases and prices decreases are happening with record low unemployment and record high stock market. Think how much they’d speed up if either of those changed?
The only logical thing I can think of with your comment, is you must be a realtor?
Maryland just lost 4,000 realtors YoY, of the total of 45,000. They’ve all dropped out and not renewed their licenses. Washington, DC is getting rid of realtors altogether. Only Brokers will be allowed to sell houses. All the licensed realtors in DC are being fired. This is a good move and is no loss to the buyers or sellers of real estate.
It would be great to see this be a national trend. I can’t see a house now without signing with a realtor. Not a regulation, but how things have played out in Denver with the commission changes. Total bullshit, I am totally capable of walking around a house and deciding if I like it on my own.
Talked to some people in tech who were trying to create software to eliminate real estate agents and honestly on the buy side I think it’s the best thing that could happen. Buyers agents agents don’t get their client the best deal they want to close the deal so they’re going to tell you to bid way over asking – then they get their commission check.
In Orange County, it is said that buyer agent colluded with listing agent conceal structural issues or foundation problems or other issues that could be material factors for a buyer not to pursue. Realtors were culprits causing 2008 housing crash yet no one name them. Unfortunately most time realtors manipulate buyers paying more just for higher commission. Worse – in SoCal now it is realtors recently from 🇨🇳 push the market. 🙄