Germany, France, Italy, Spain, Netherlands, Poland, Belgium, Sweden, Ireland, Austria, Norway, Denmark, Romania, Czech Republic, Finland, Portugal
By Wolf Richter for WOLF STREET.
This is our second annual wild ride across sales prices of existing homes of all types (“dwellings”) in the 16 largest economies that are either in the European Union (EU) or in the European Economic Area (EEA), based on data from Eurostat through Q1, released on Friday. The data goes back to 2005 for some countries, and less far for other countries.
Some countries have or had indeed the most splendid housing bubbles, and a few of those have deflated some. Other countries had the most splendid housing bubbles 15 or more years ago. A few didn’t have any housing bubbles at all. And one essentially went nowhere over the past 15 years. So a wild ride across the spectrum.
Biggest decliners from the peak and year of that peak:
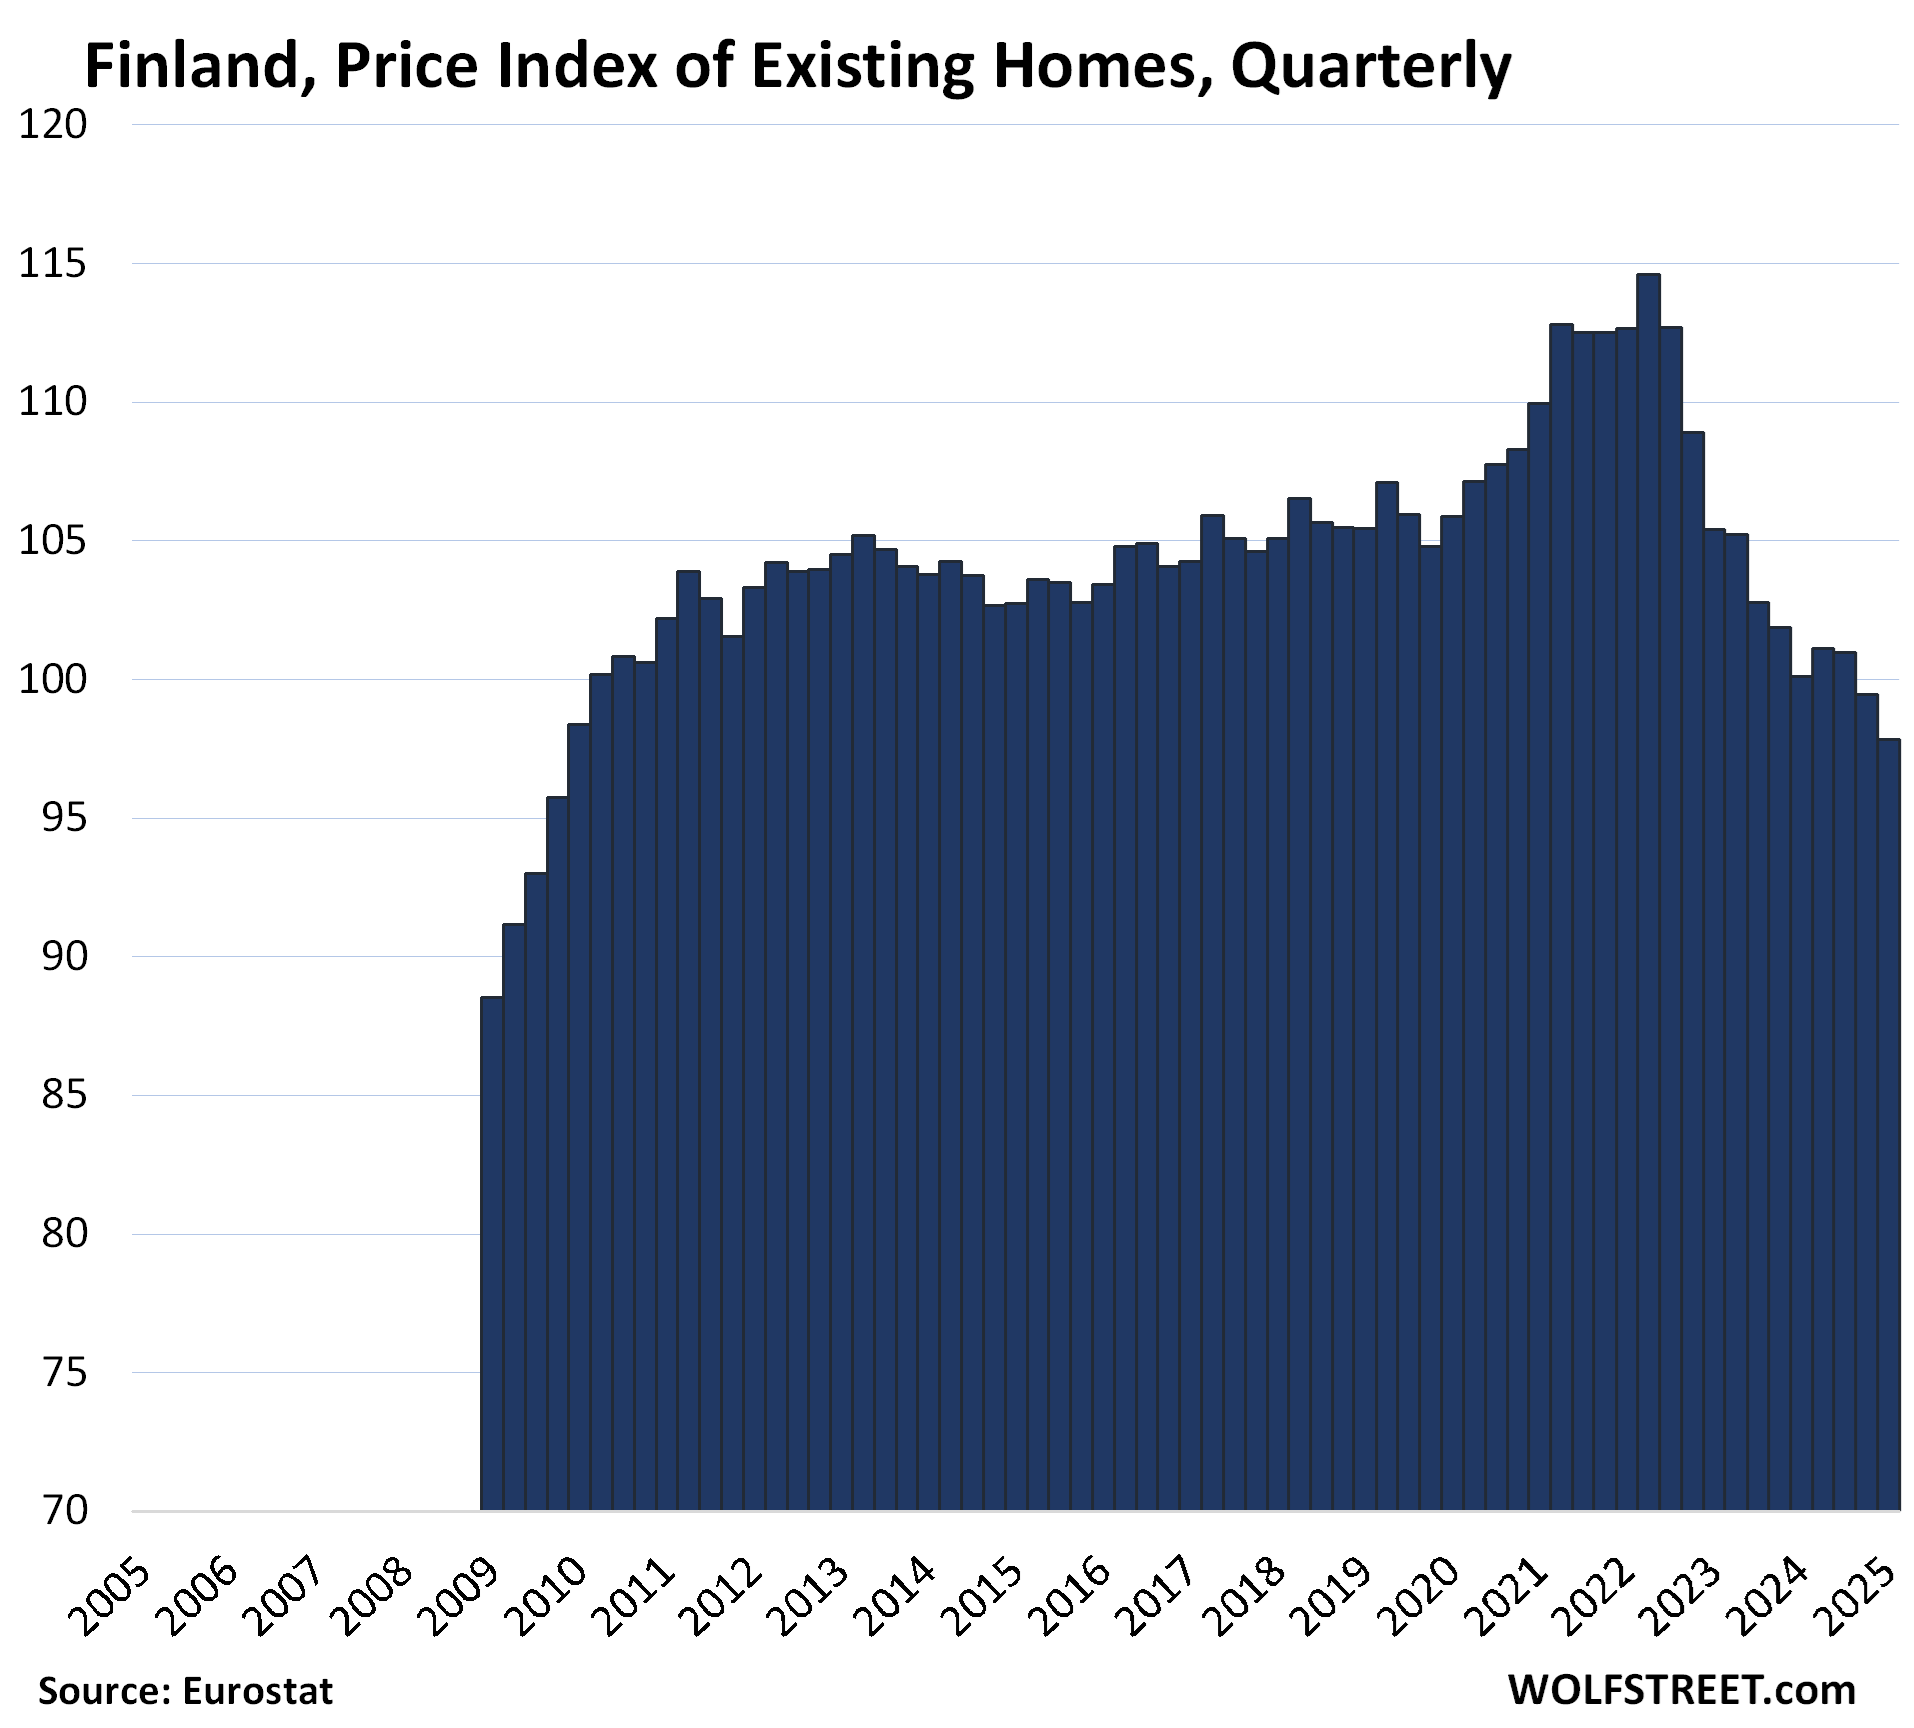
- Finland: -14.6% from Q2 2022
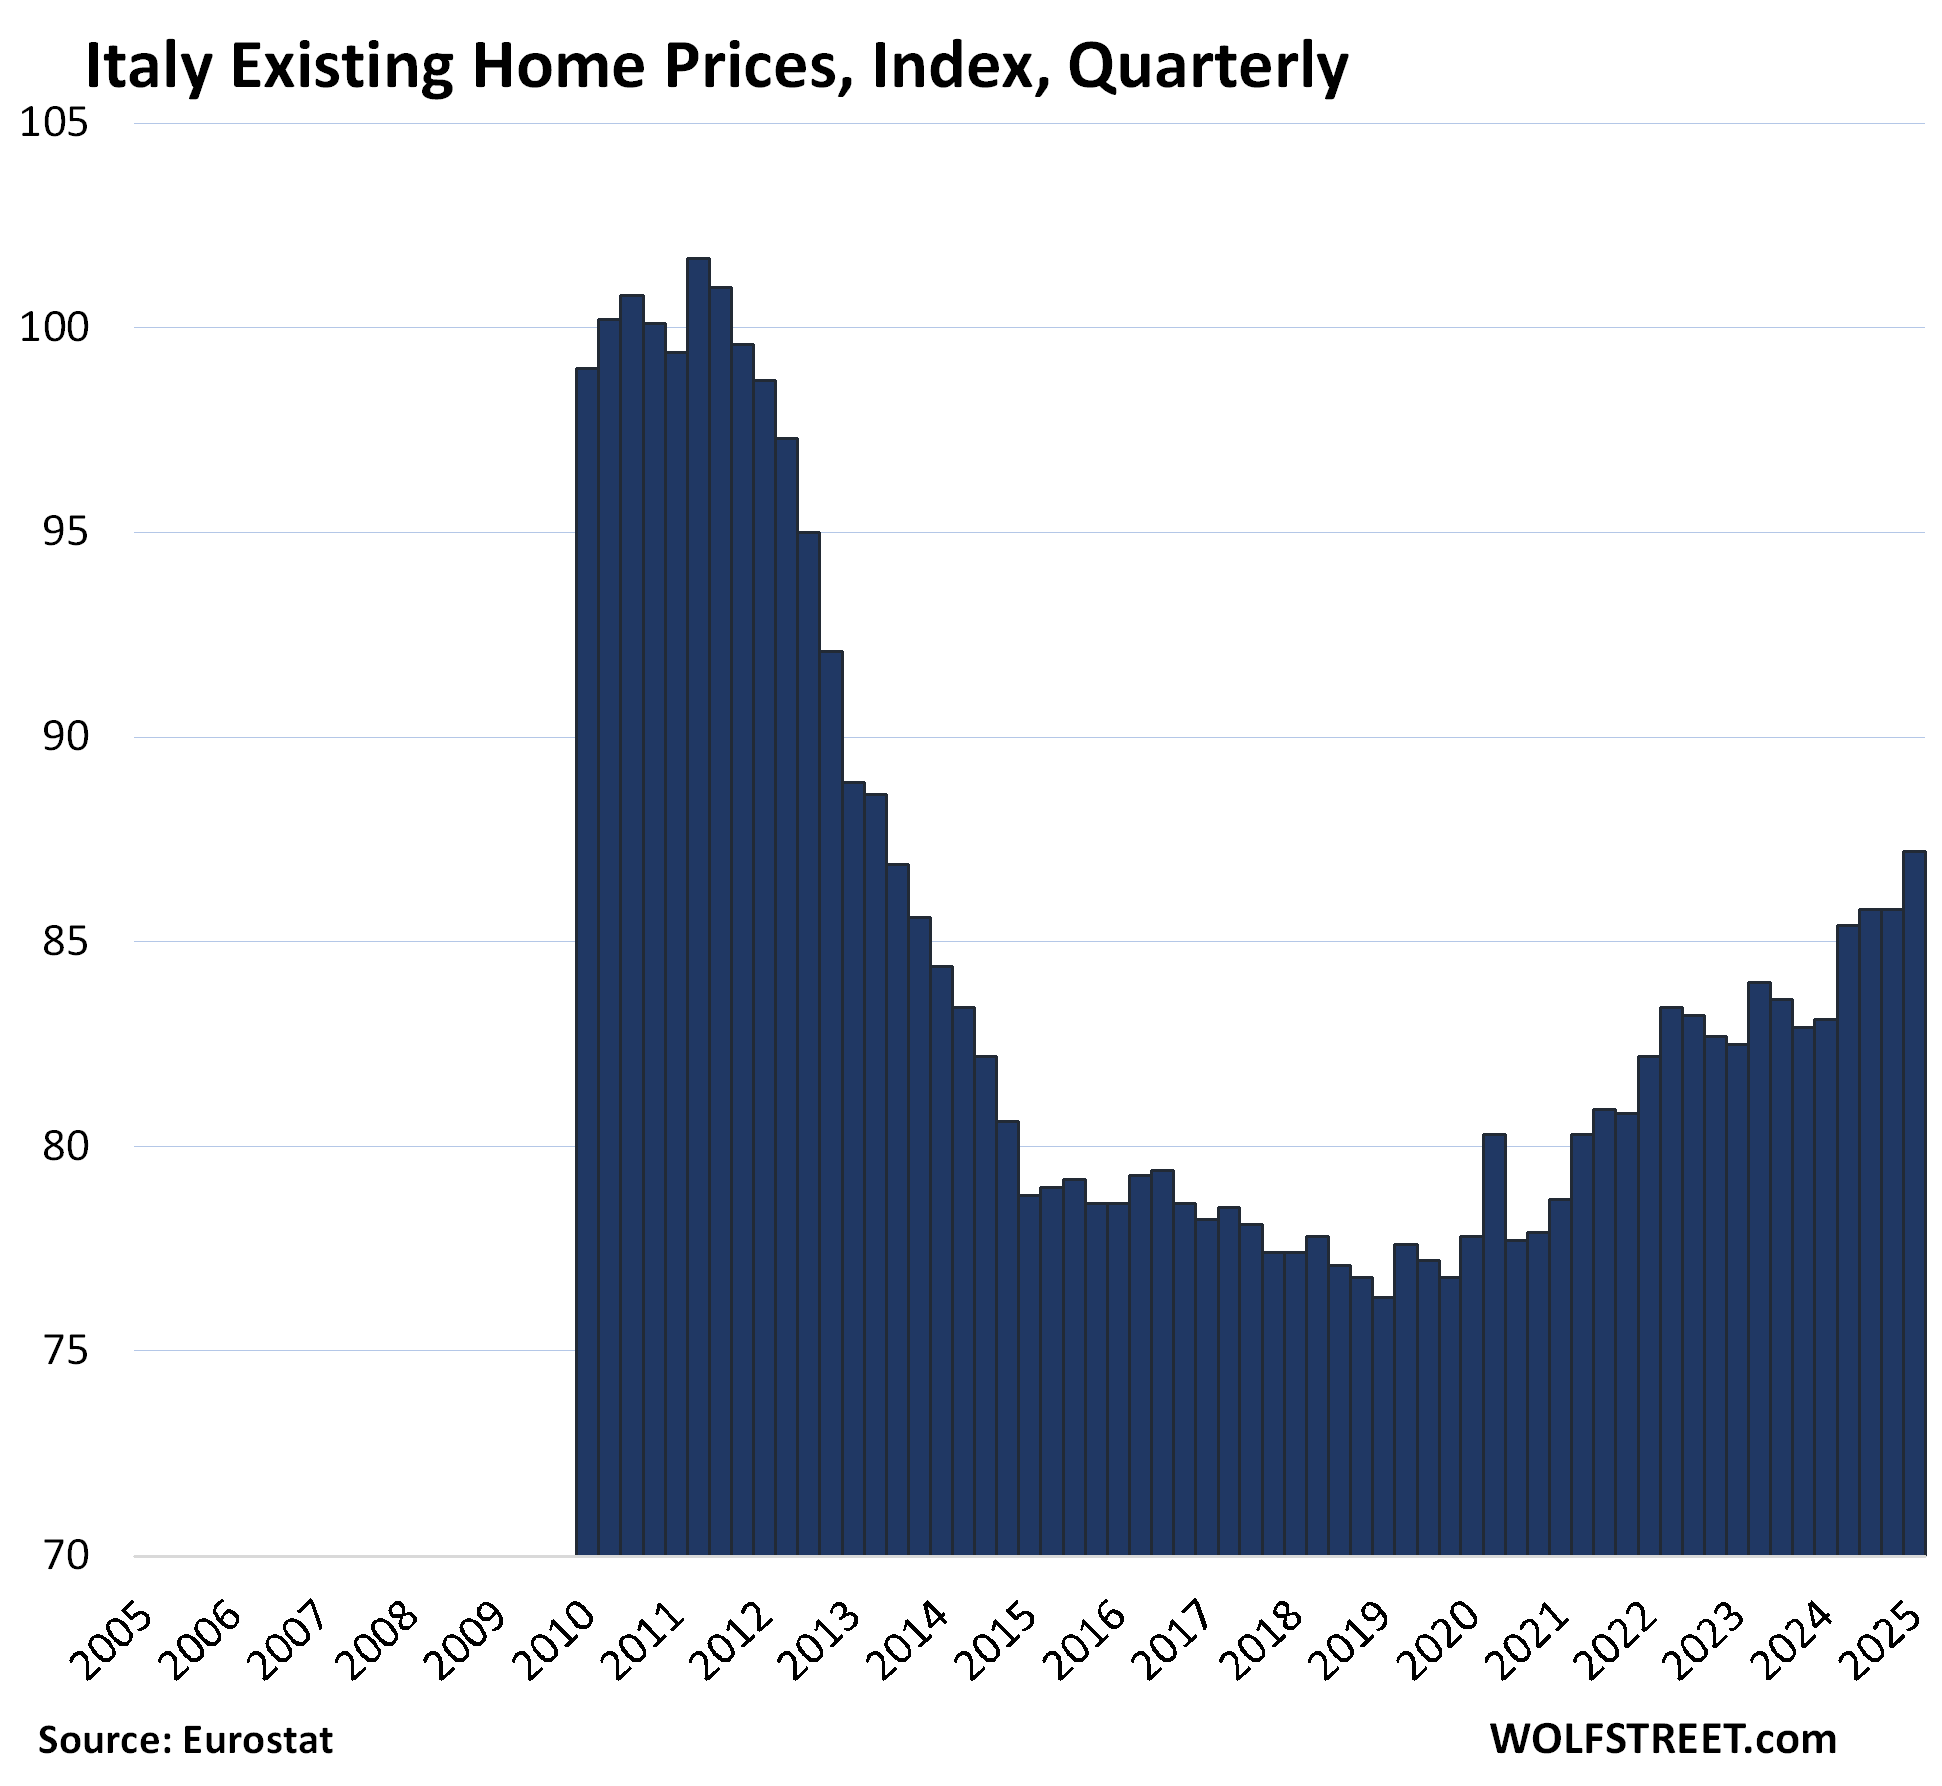
- Italy: -14.3% from Q2 2011
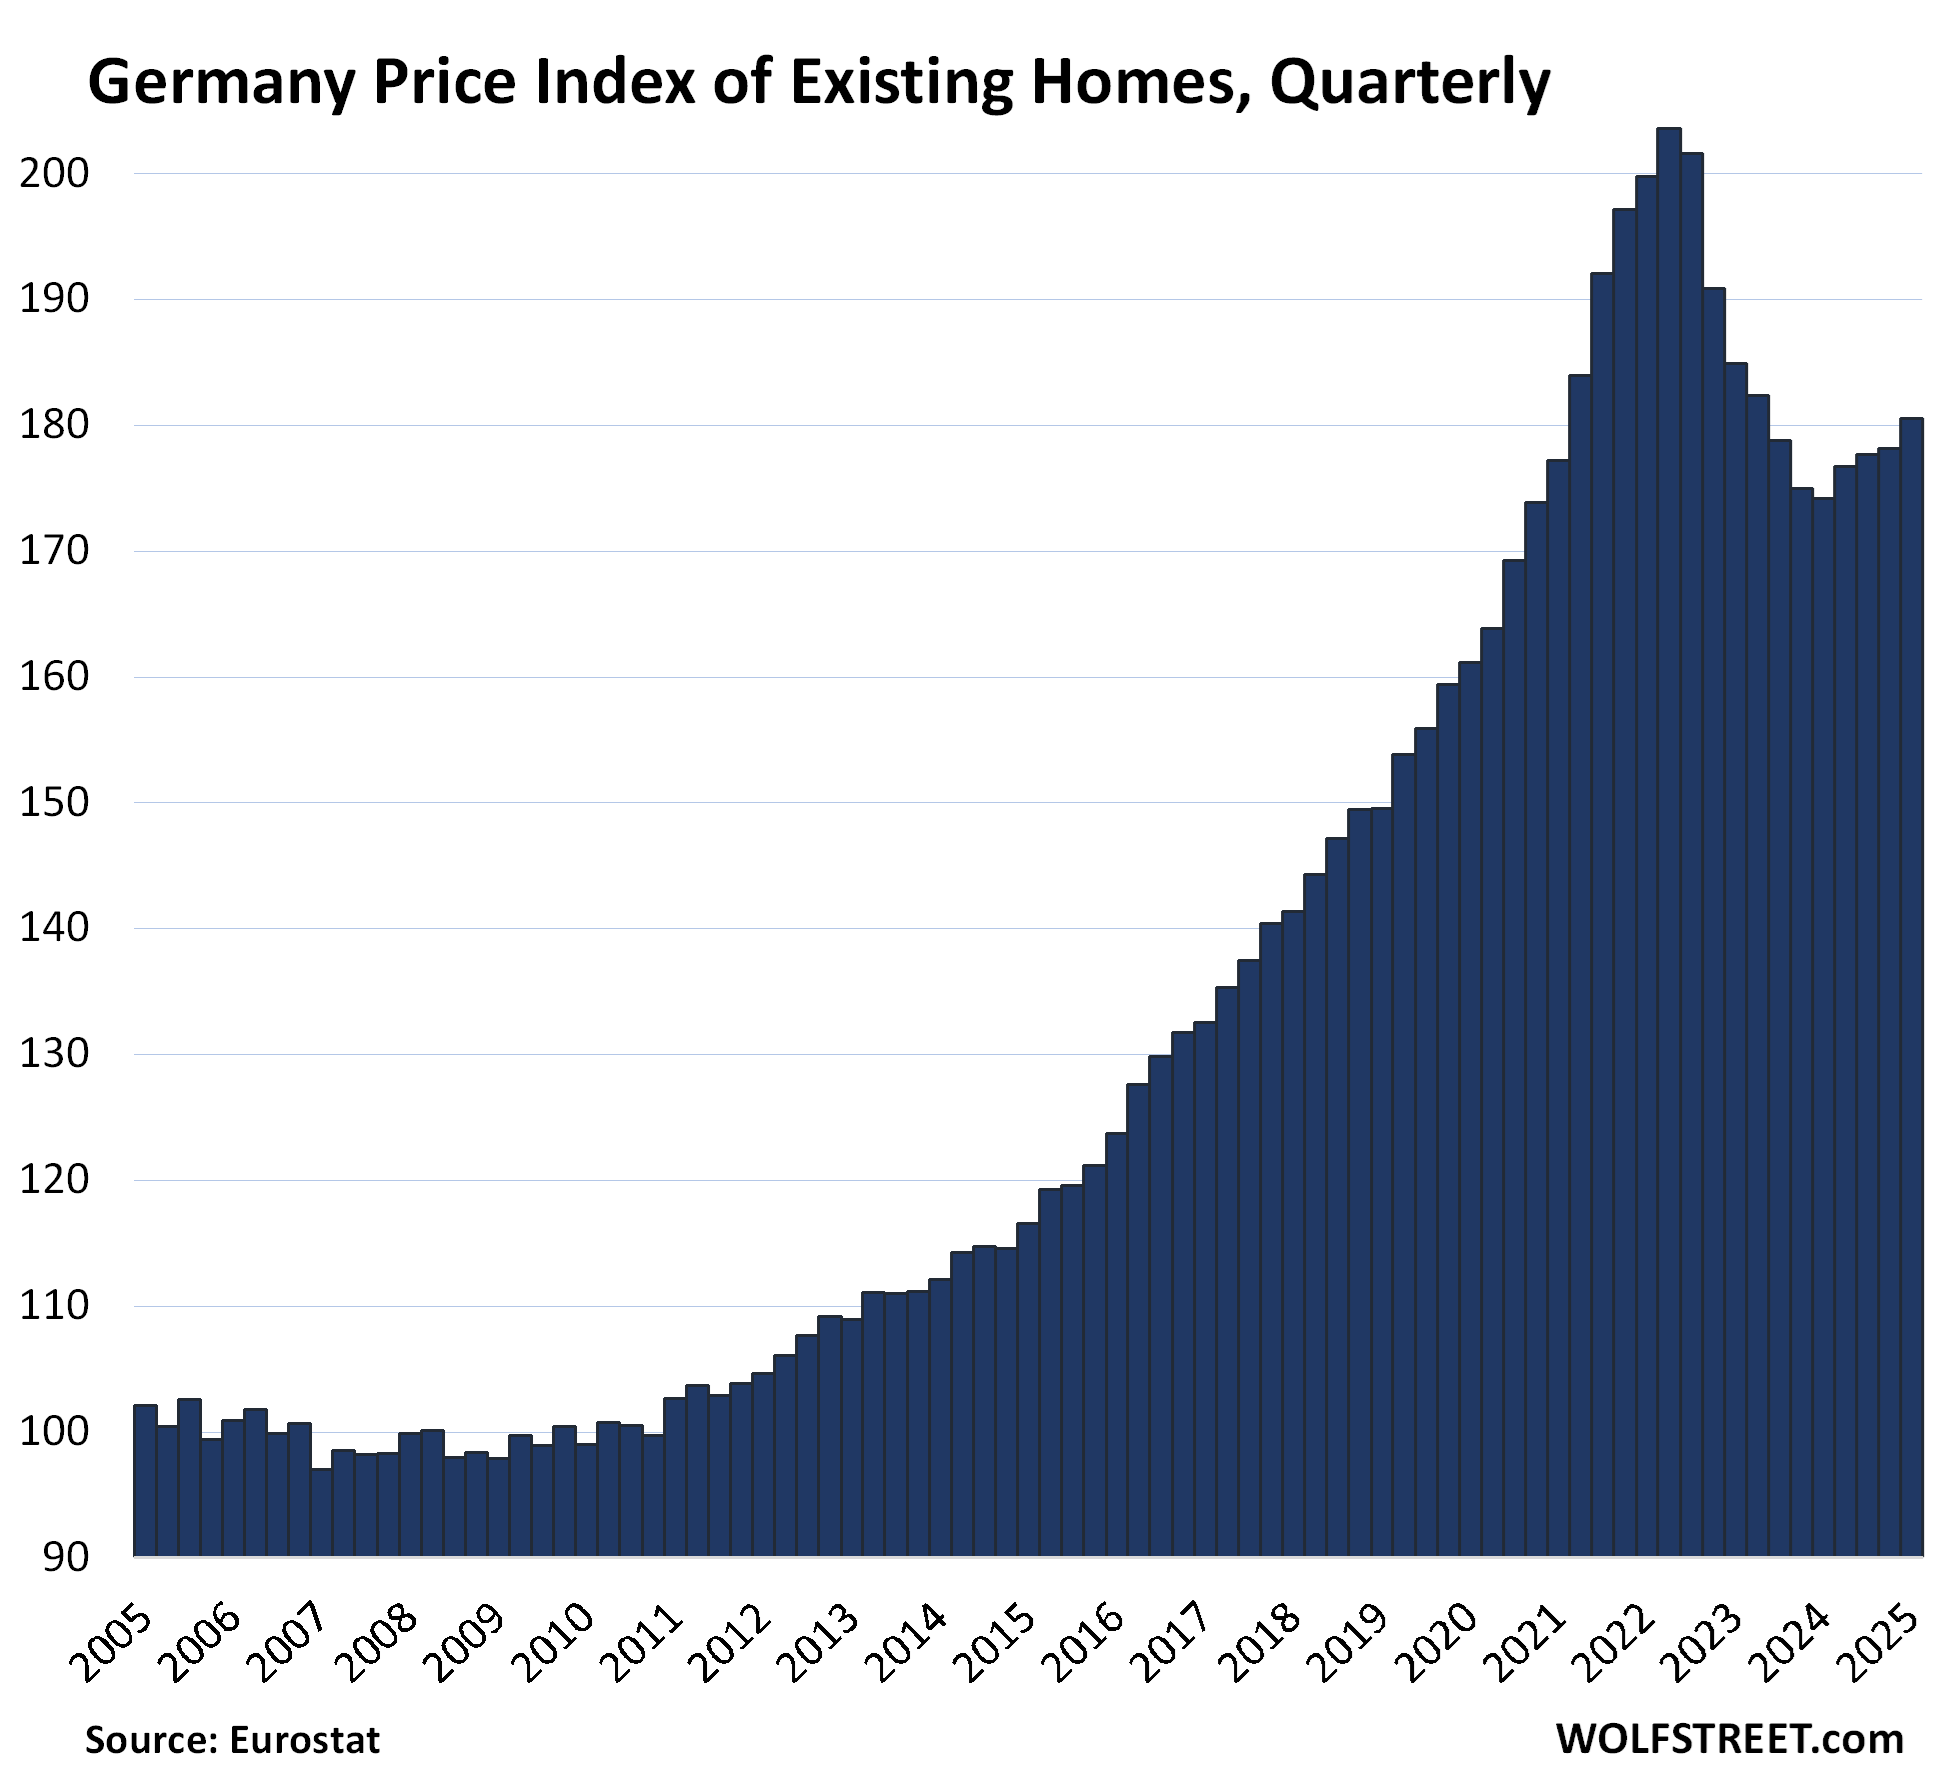
- Germany: -11.3% from Q2 2022
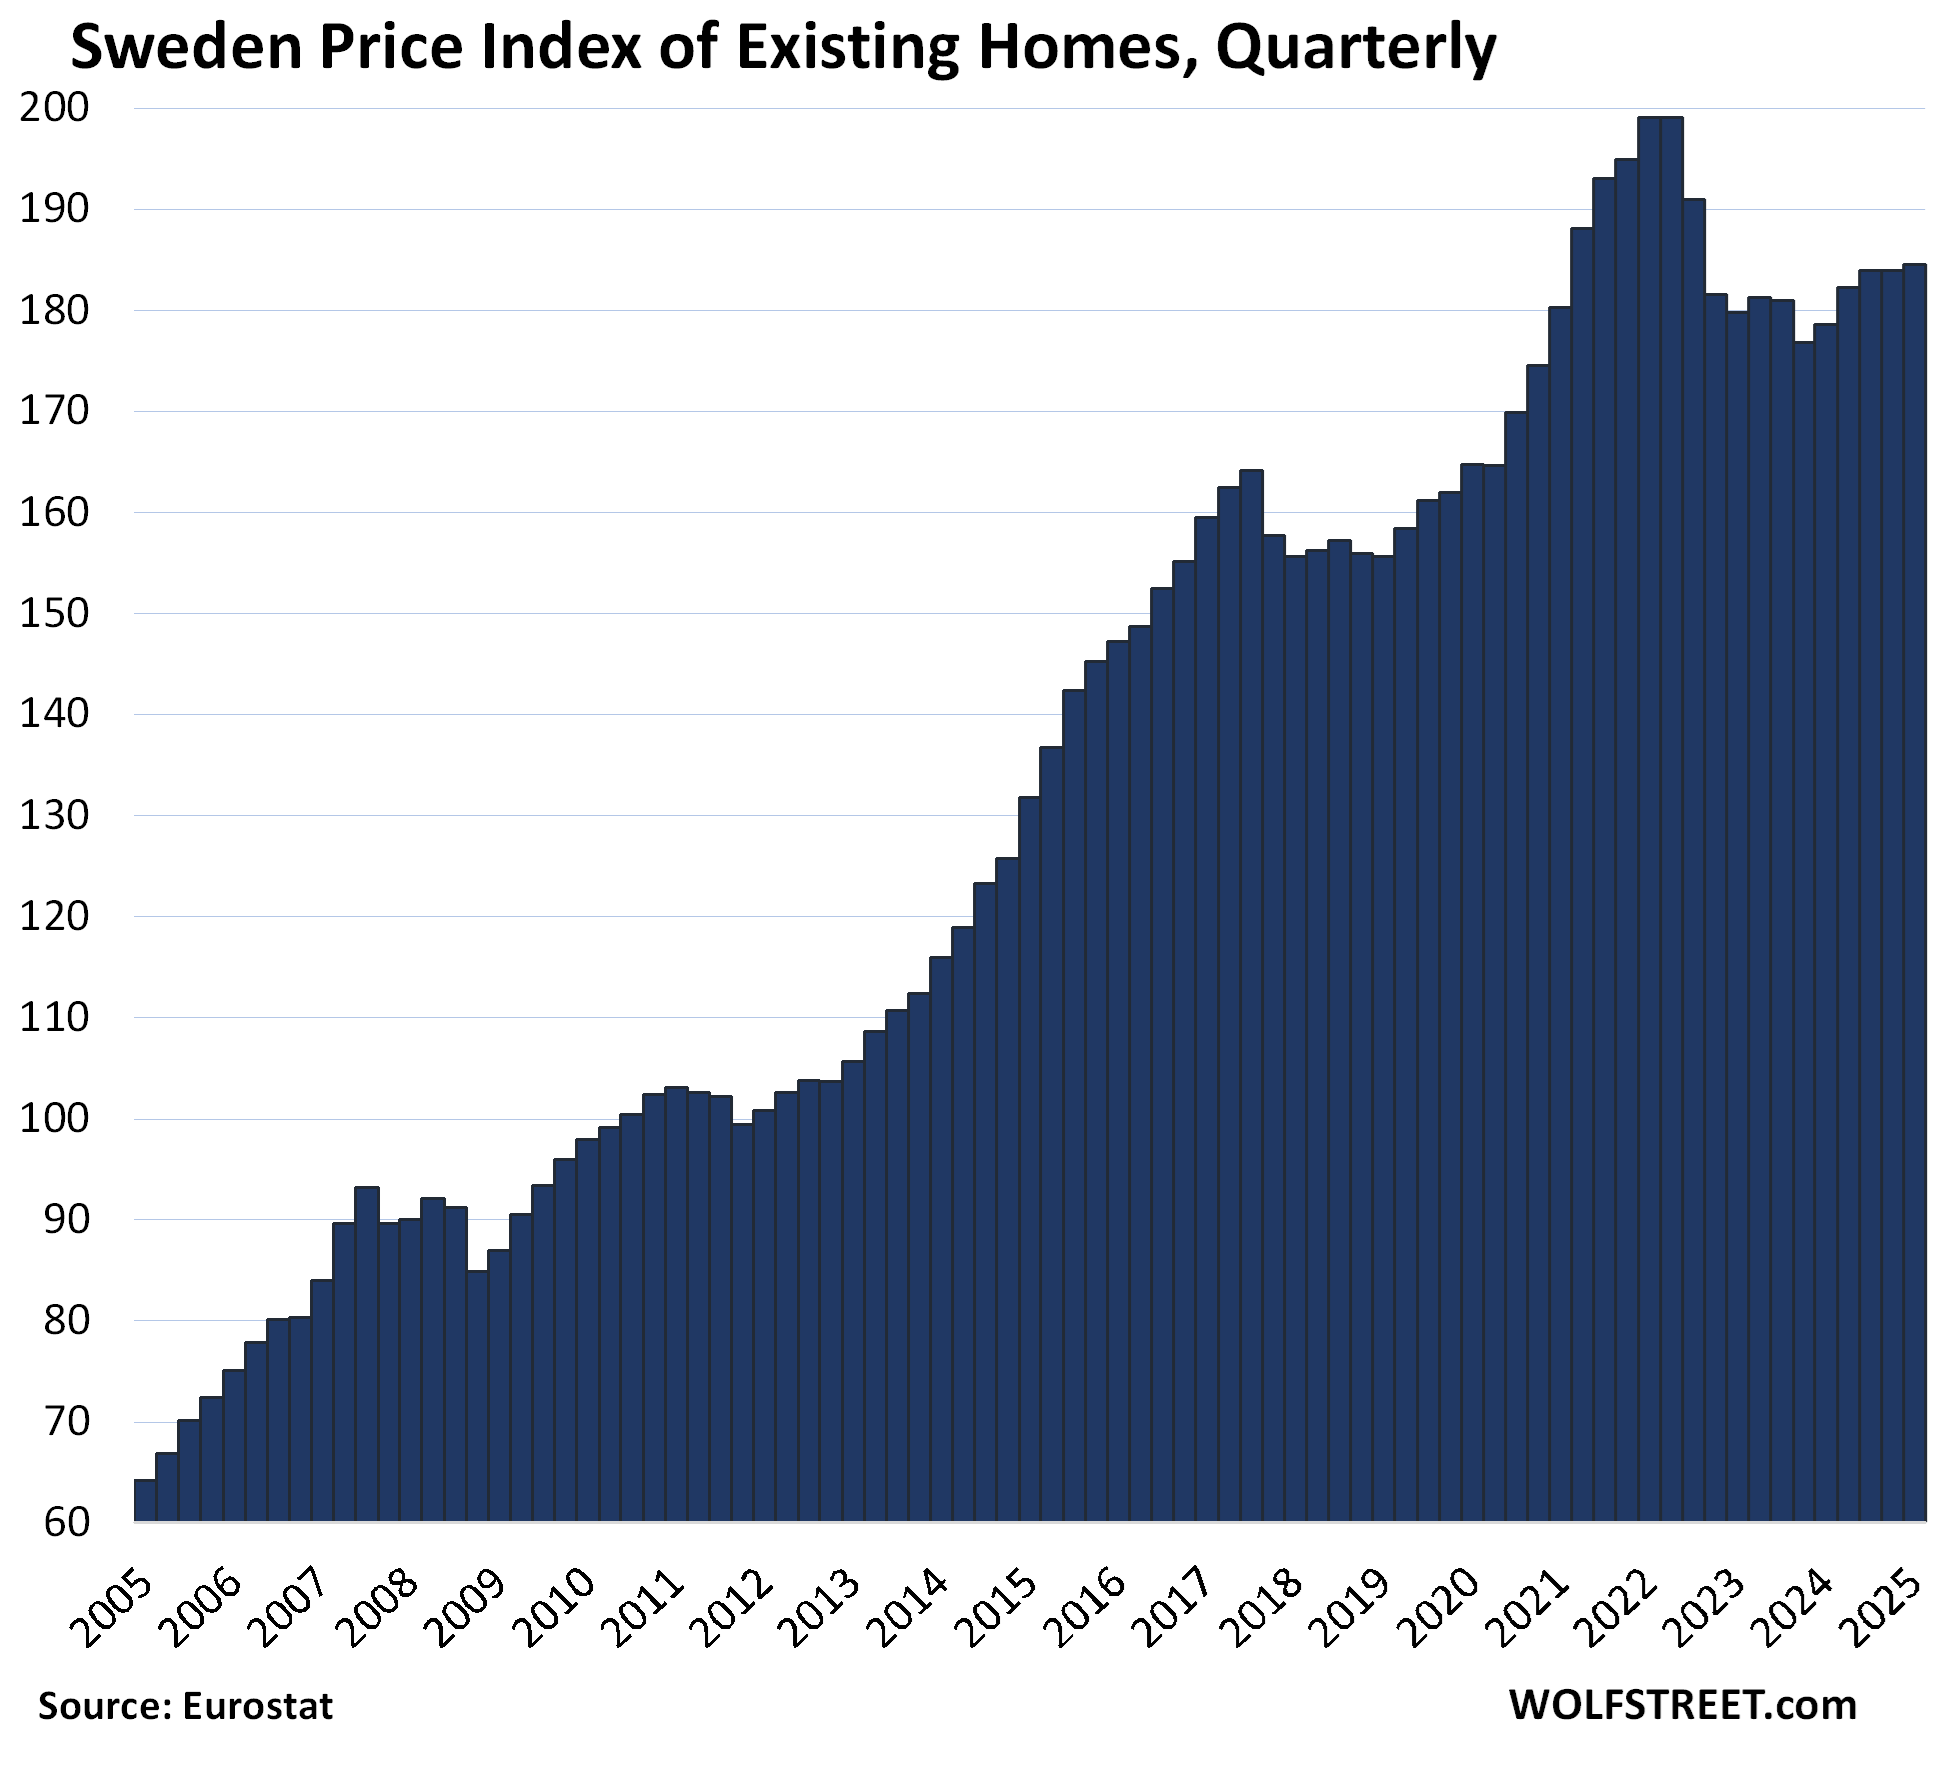
- Sweden: -7.3% from Q2 2022
- Austria: -7.3% from Q3 2022
- France: -6.5% from Q3 2022
Triple-digit gainers from 2010 to their respective peak:
- Czech Republic: +146%
- Portugal: +139%
- Austria: +136%
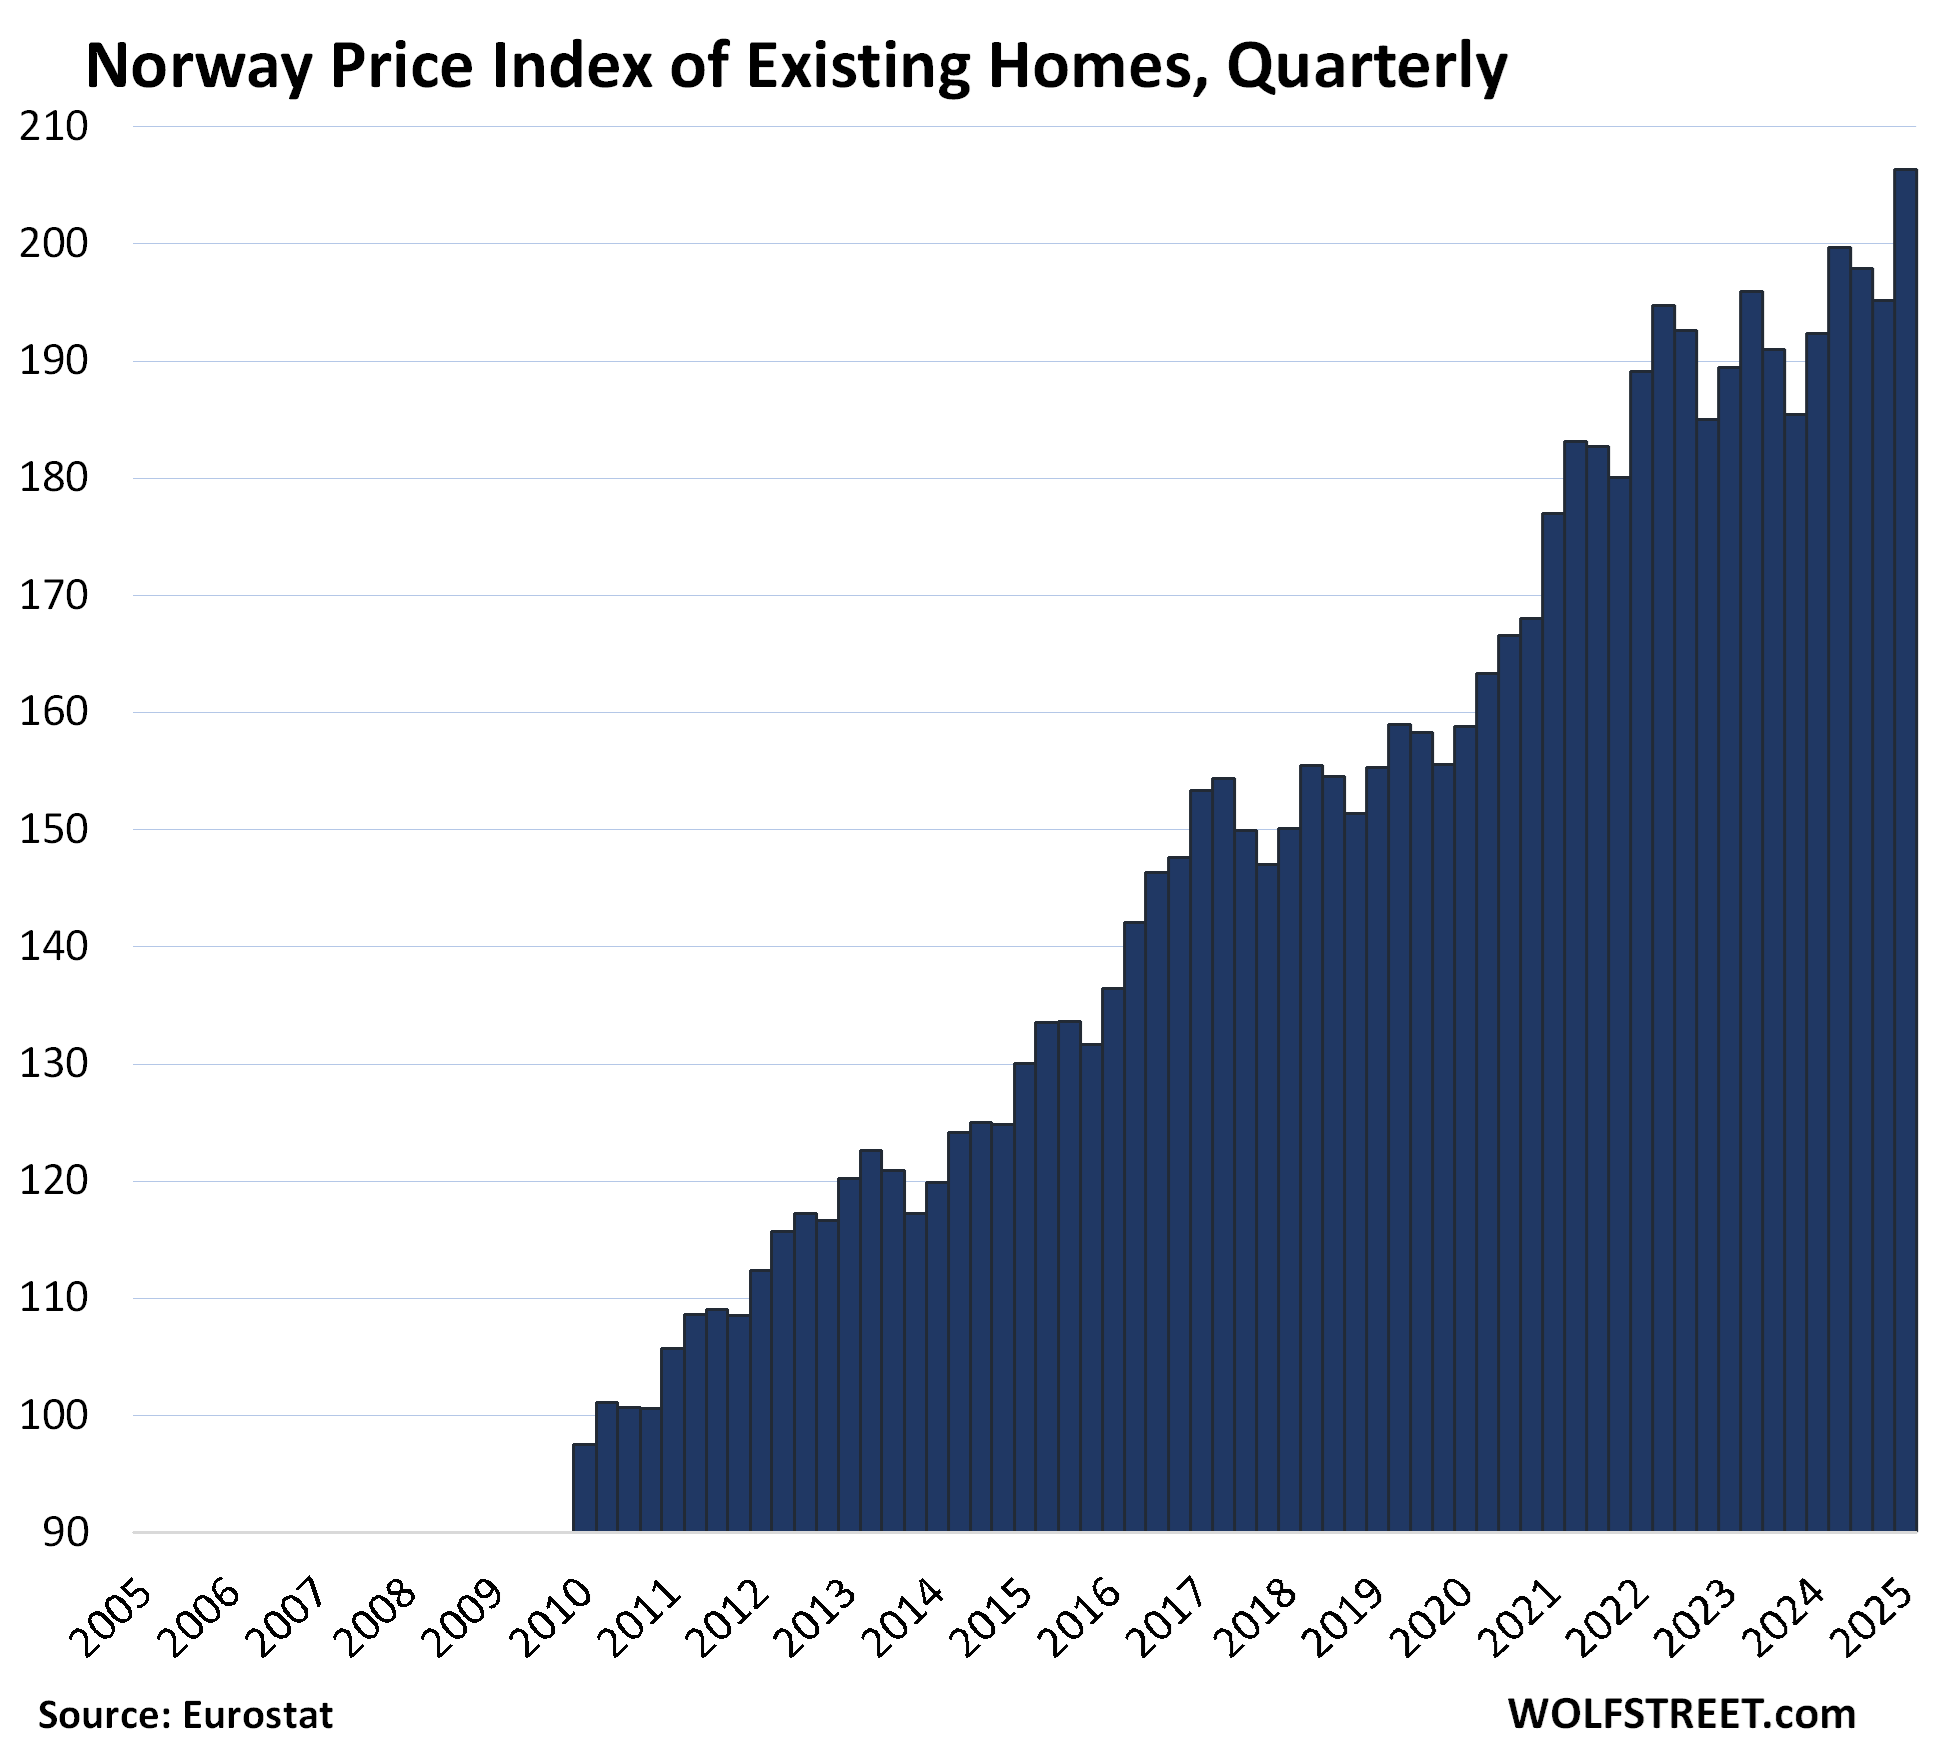
- Norway: +111%
- Poland: 108%
- Germany: +106%
- Sweden: +103%
The home price indices for the biggest European markets:
The little tables show either three or four columns:
(1) % change from 2010 to the peak, whether the peak was in 2022 or in the current quarter. But in some countries, the peak was before 2010, such as in Italy and Spain, and those markets don’t have that column. (2) Quarter-over-quarter % change. (3) Year-over-year % change. And (4) % change in the current quarter from the peak.
Of the 16 markets, 7 are down from their peaks:
| Finland, Prices of Existing Homes | |||
| 2010 to Peak | QoQ | YoY | From peak |
| 16.5% | -1.6% | -2.3% | -14.6% |
The index fell back to where it had first been in 2010. This is an example of a housing market that really hasn’t gone anywhere in 15 years.
| Italy, Prices of Existing Homes | ||
| QoQ | YoY | From peak |
| 1.63% | 4.9% | -14.3% |
The recovery started during the pandemic.
| Germany, Prices of Existing Homes | |||
| 2010 to Peak | QoQ | YoY | From peak |
| 105.7% | 1.3% | 3.6% | -11.3% |
The index is where it had been in 2021.
| Sweden, Prices of Existing Homes | |||
| 2010 to Peak | QoQ | YoY | From peak |
| 103.2% | 0.3% | 3.3% | -7.3% |
Also back to 2021.
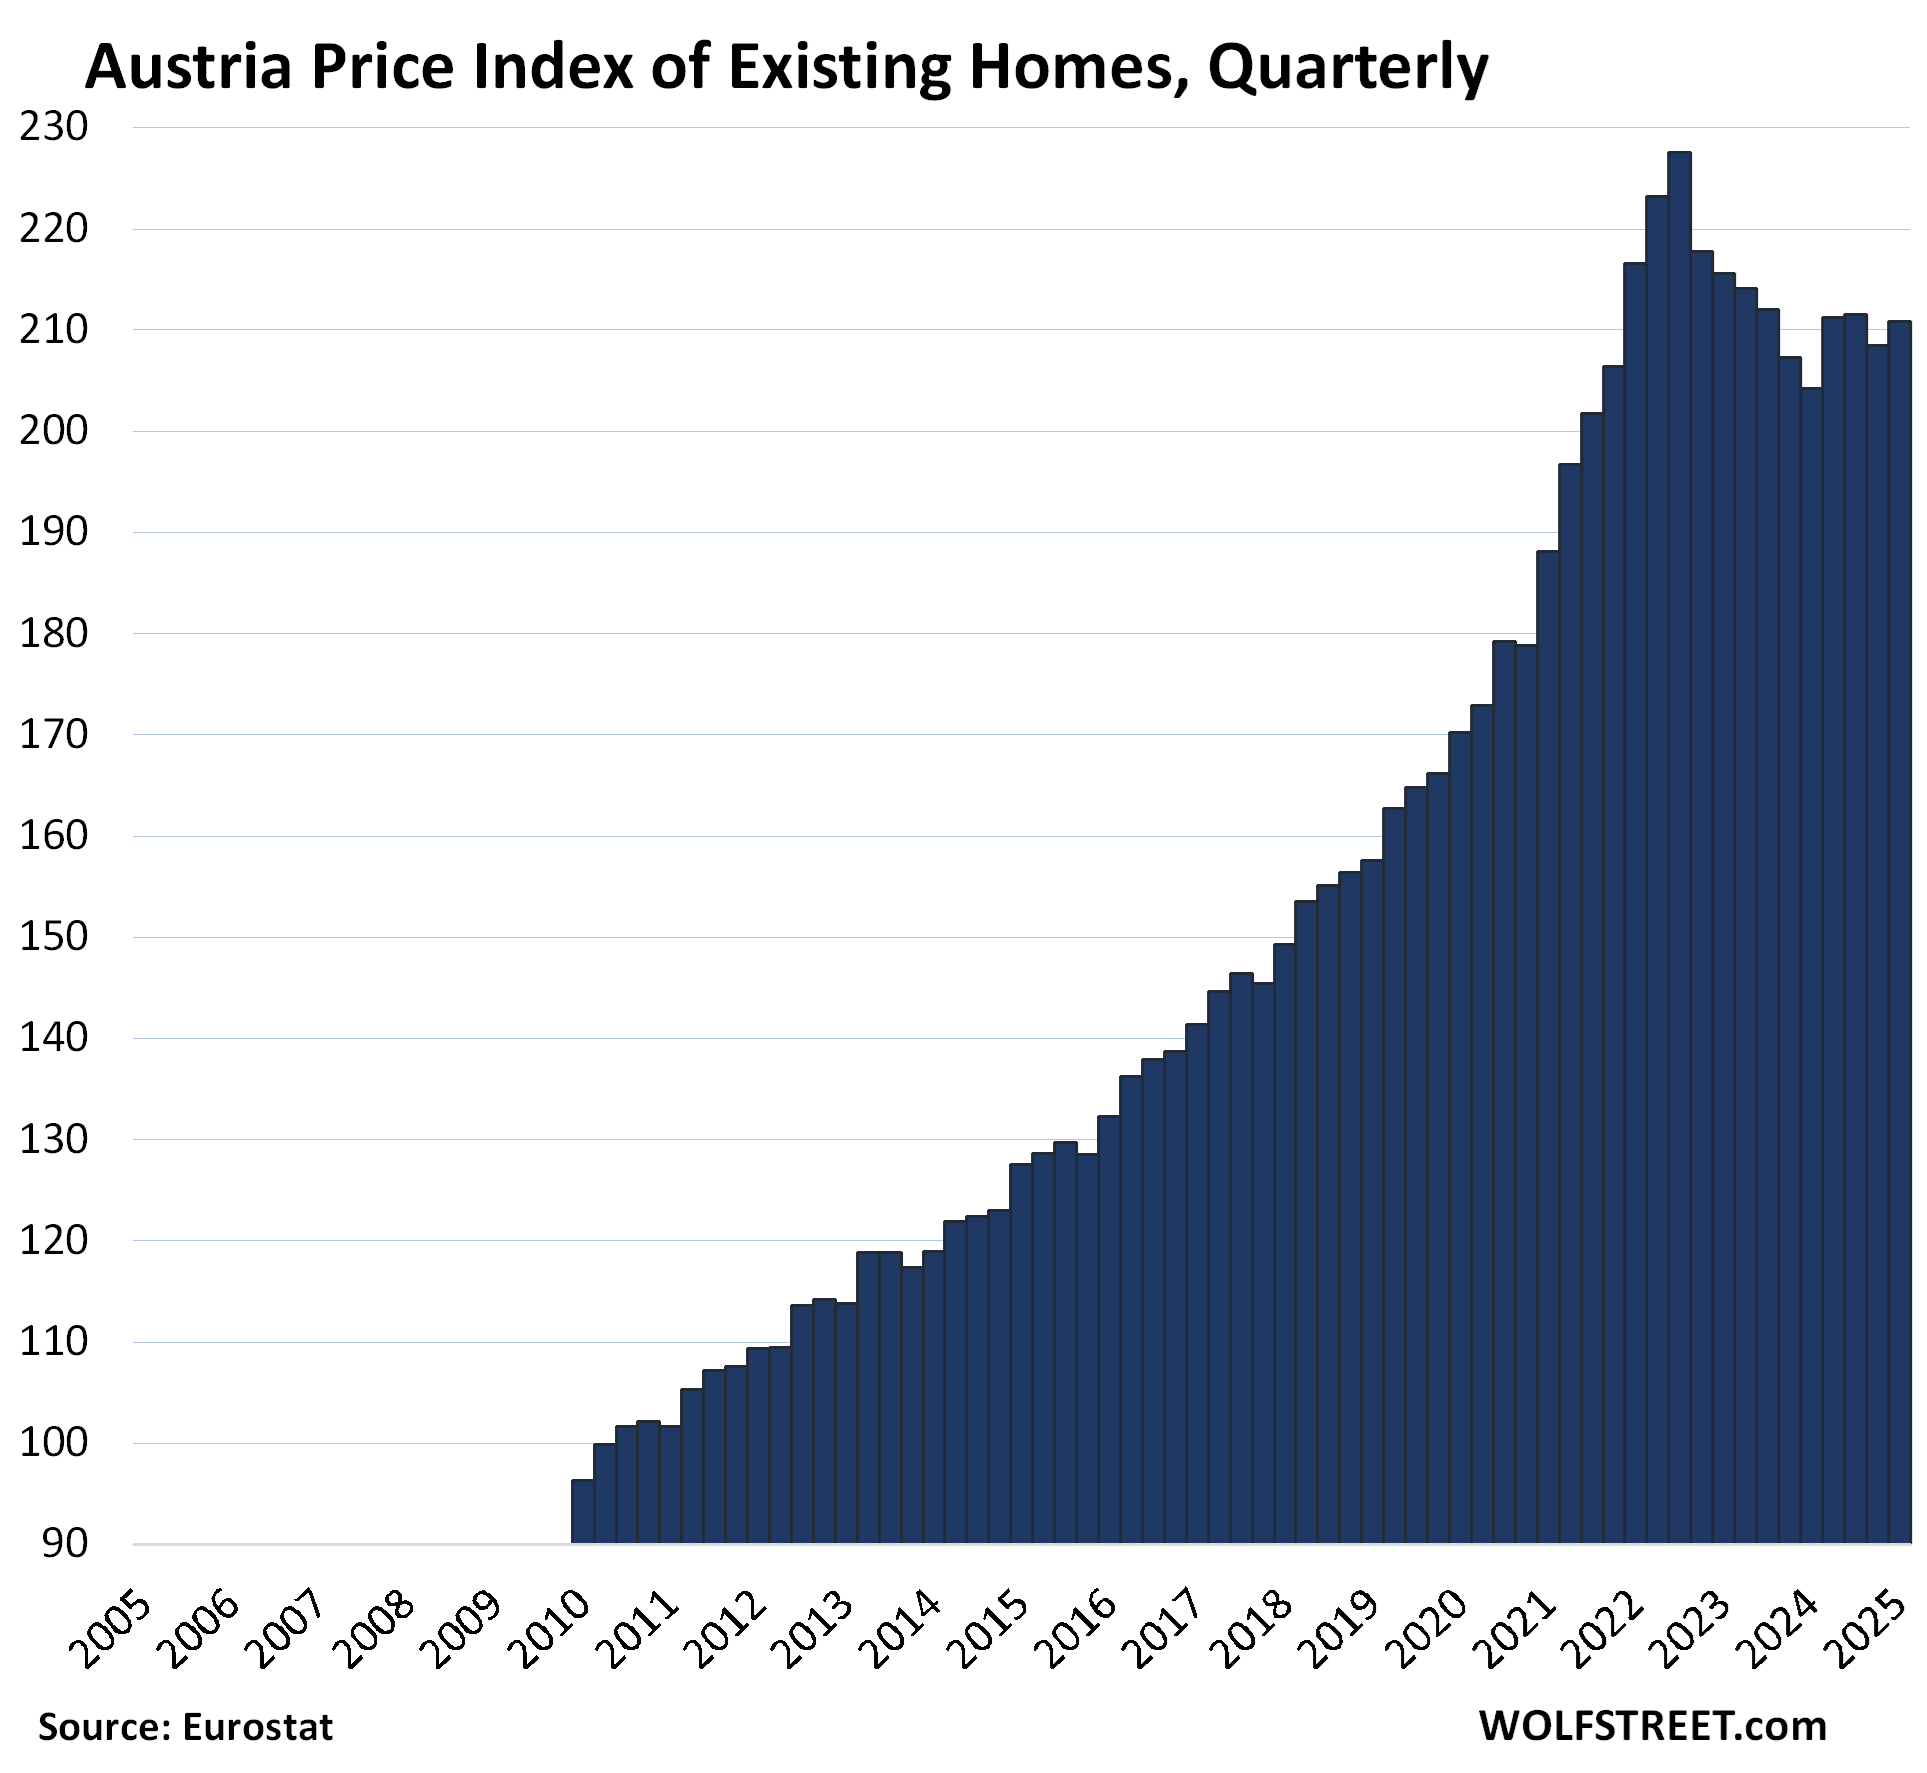
| Austria, Prices of Existing Homes | |||
| 2010 to Peak | QoQ | YoY | From peak |
| 136.2% | 1.1% | 3.3% | -7.3% |
The index is also back where it had been in 2021.
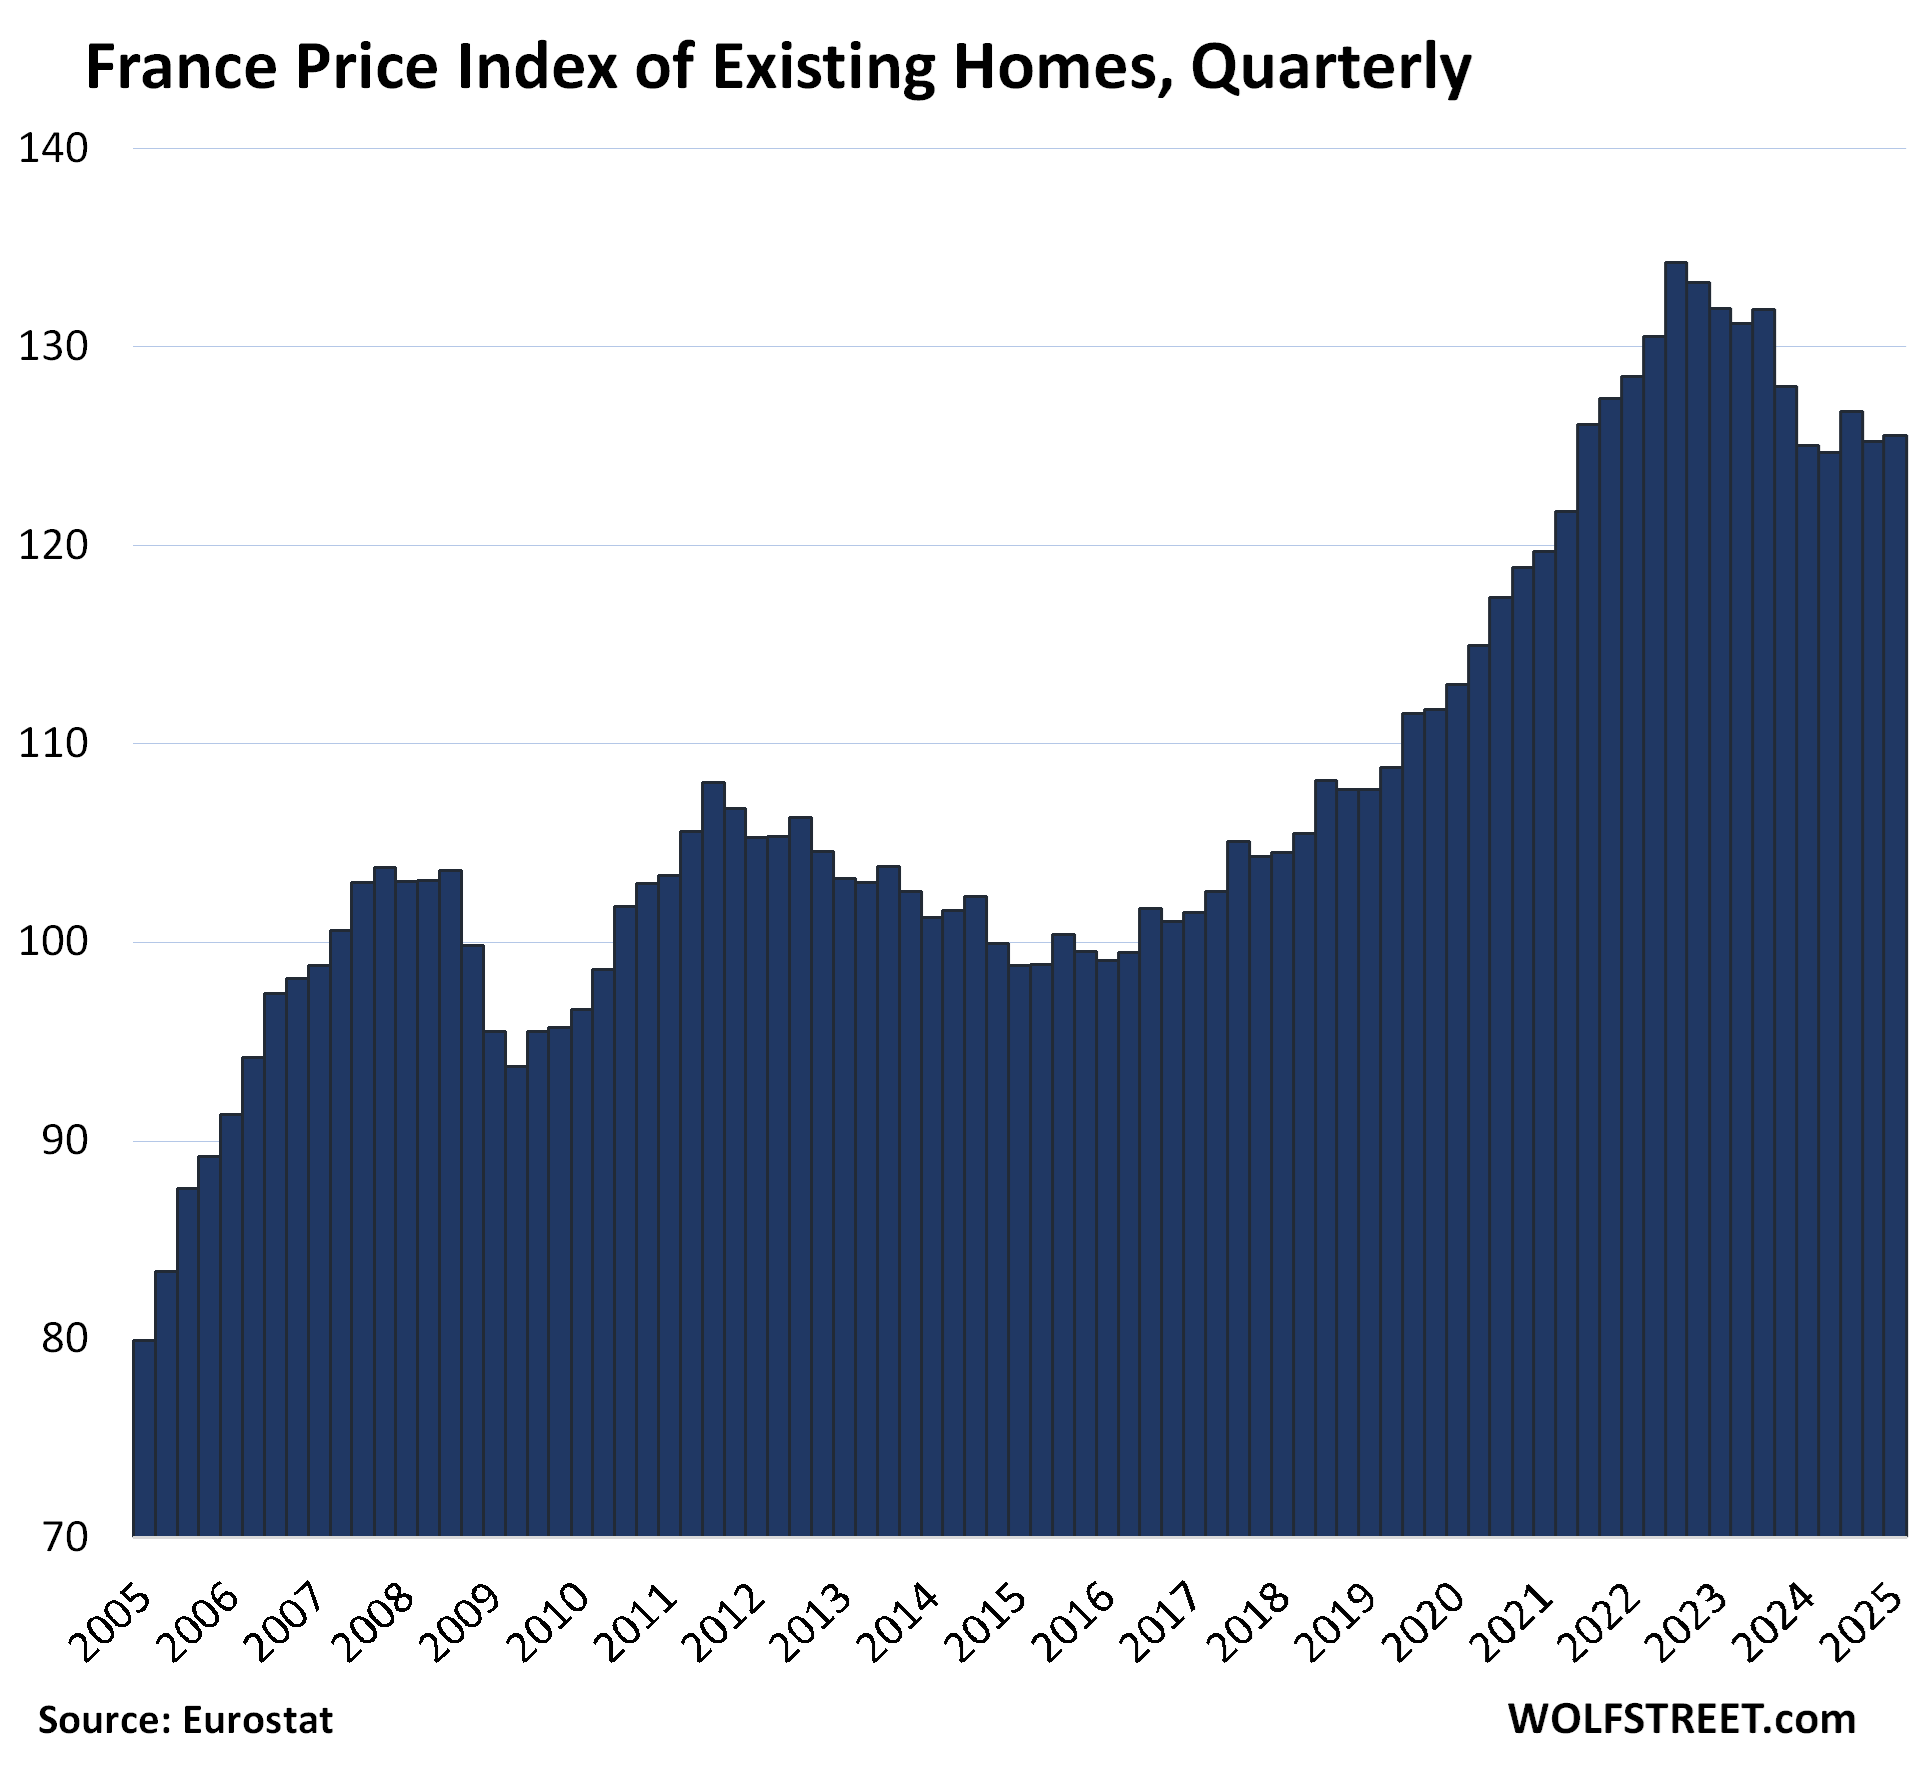
| France, Prices of Existing Homes | |||
| 2010 to Peak | QoQ | YoY | From peak |
| 39.0% | 0.3% | 0.4% | -6.5% |
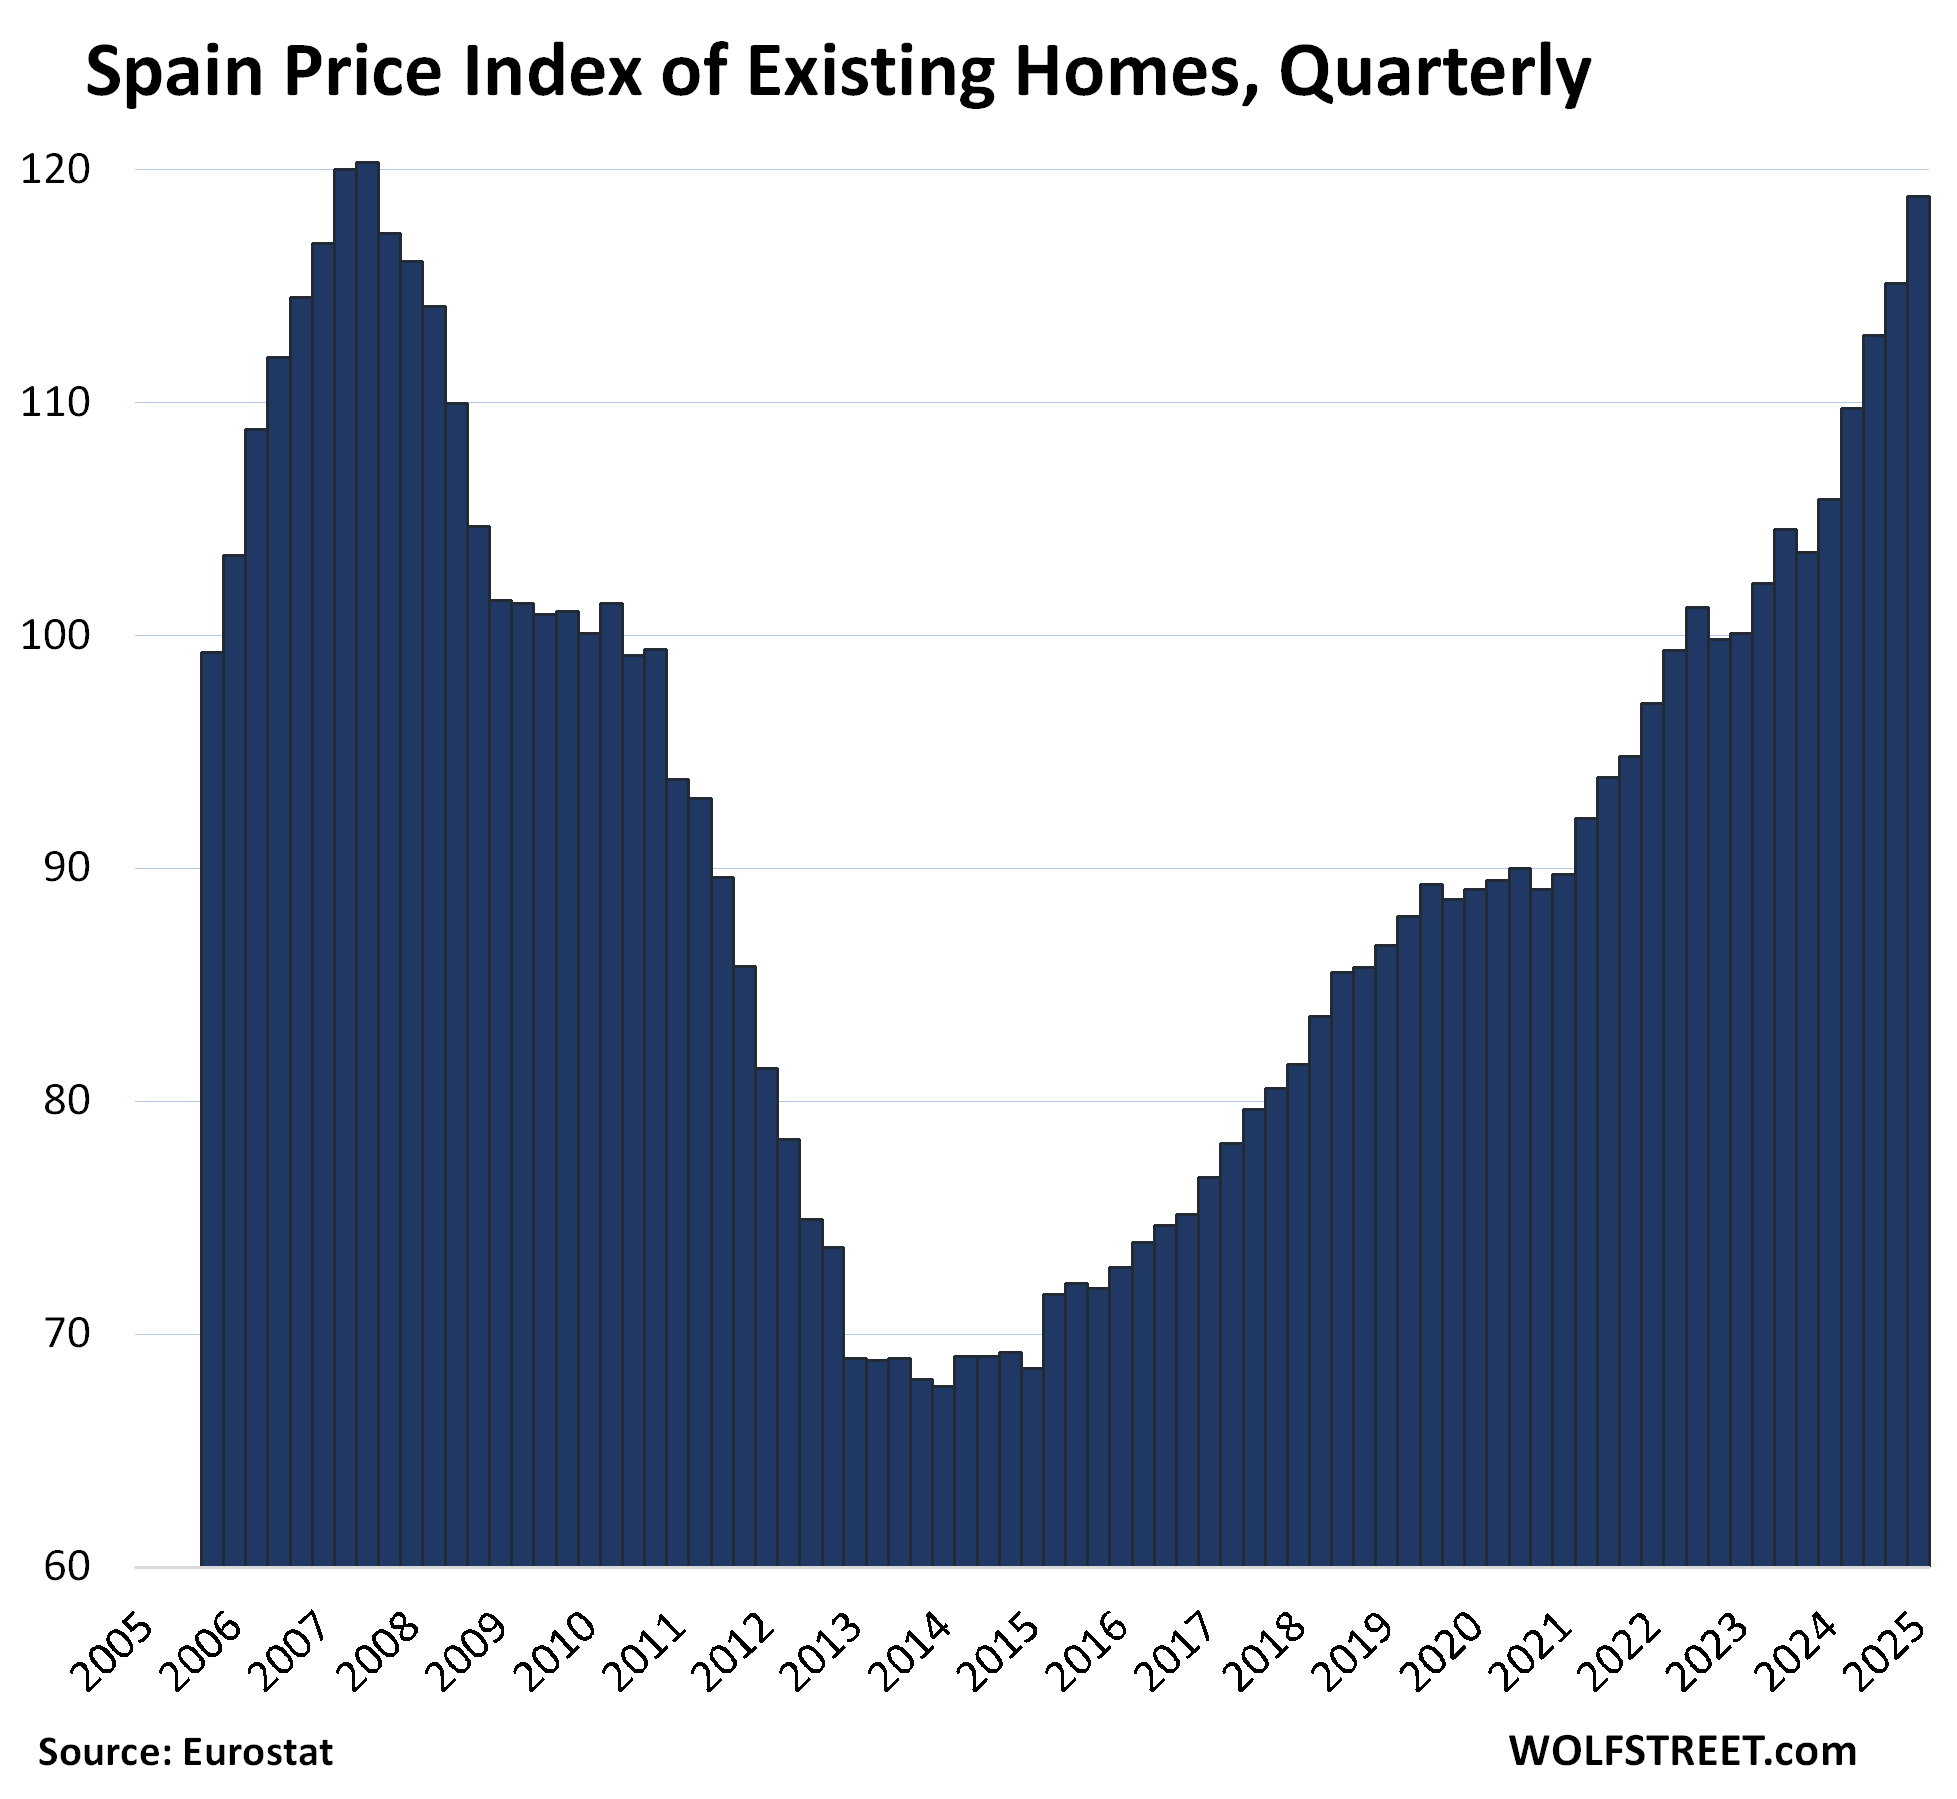
| Spain, Prices of Existing Homes | ||
| QoQ | YoY | From peak |
| 3.2% | 12.3% | -1.2% |
Home prices are almost back to the peak 18 years ago.
Of the 16 markets, the other 9 have made new highs:
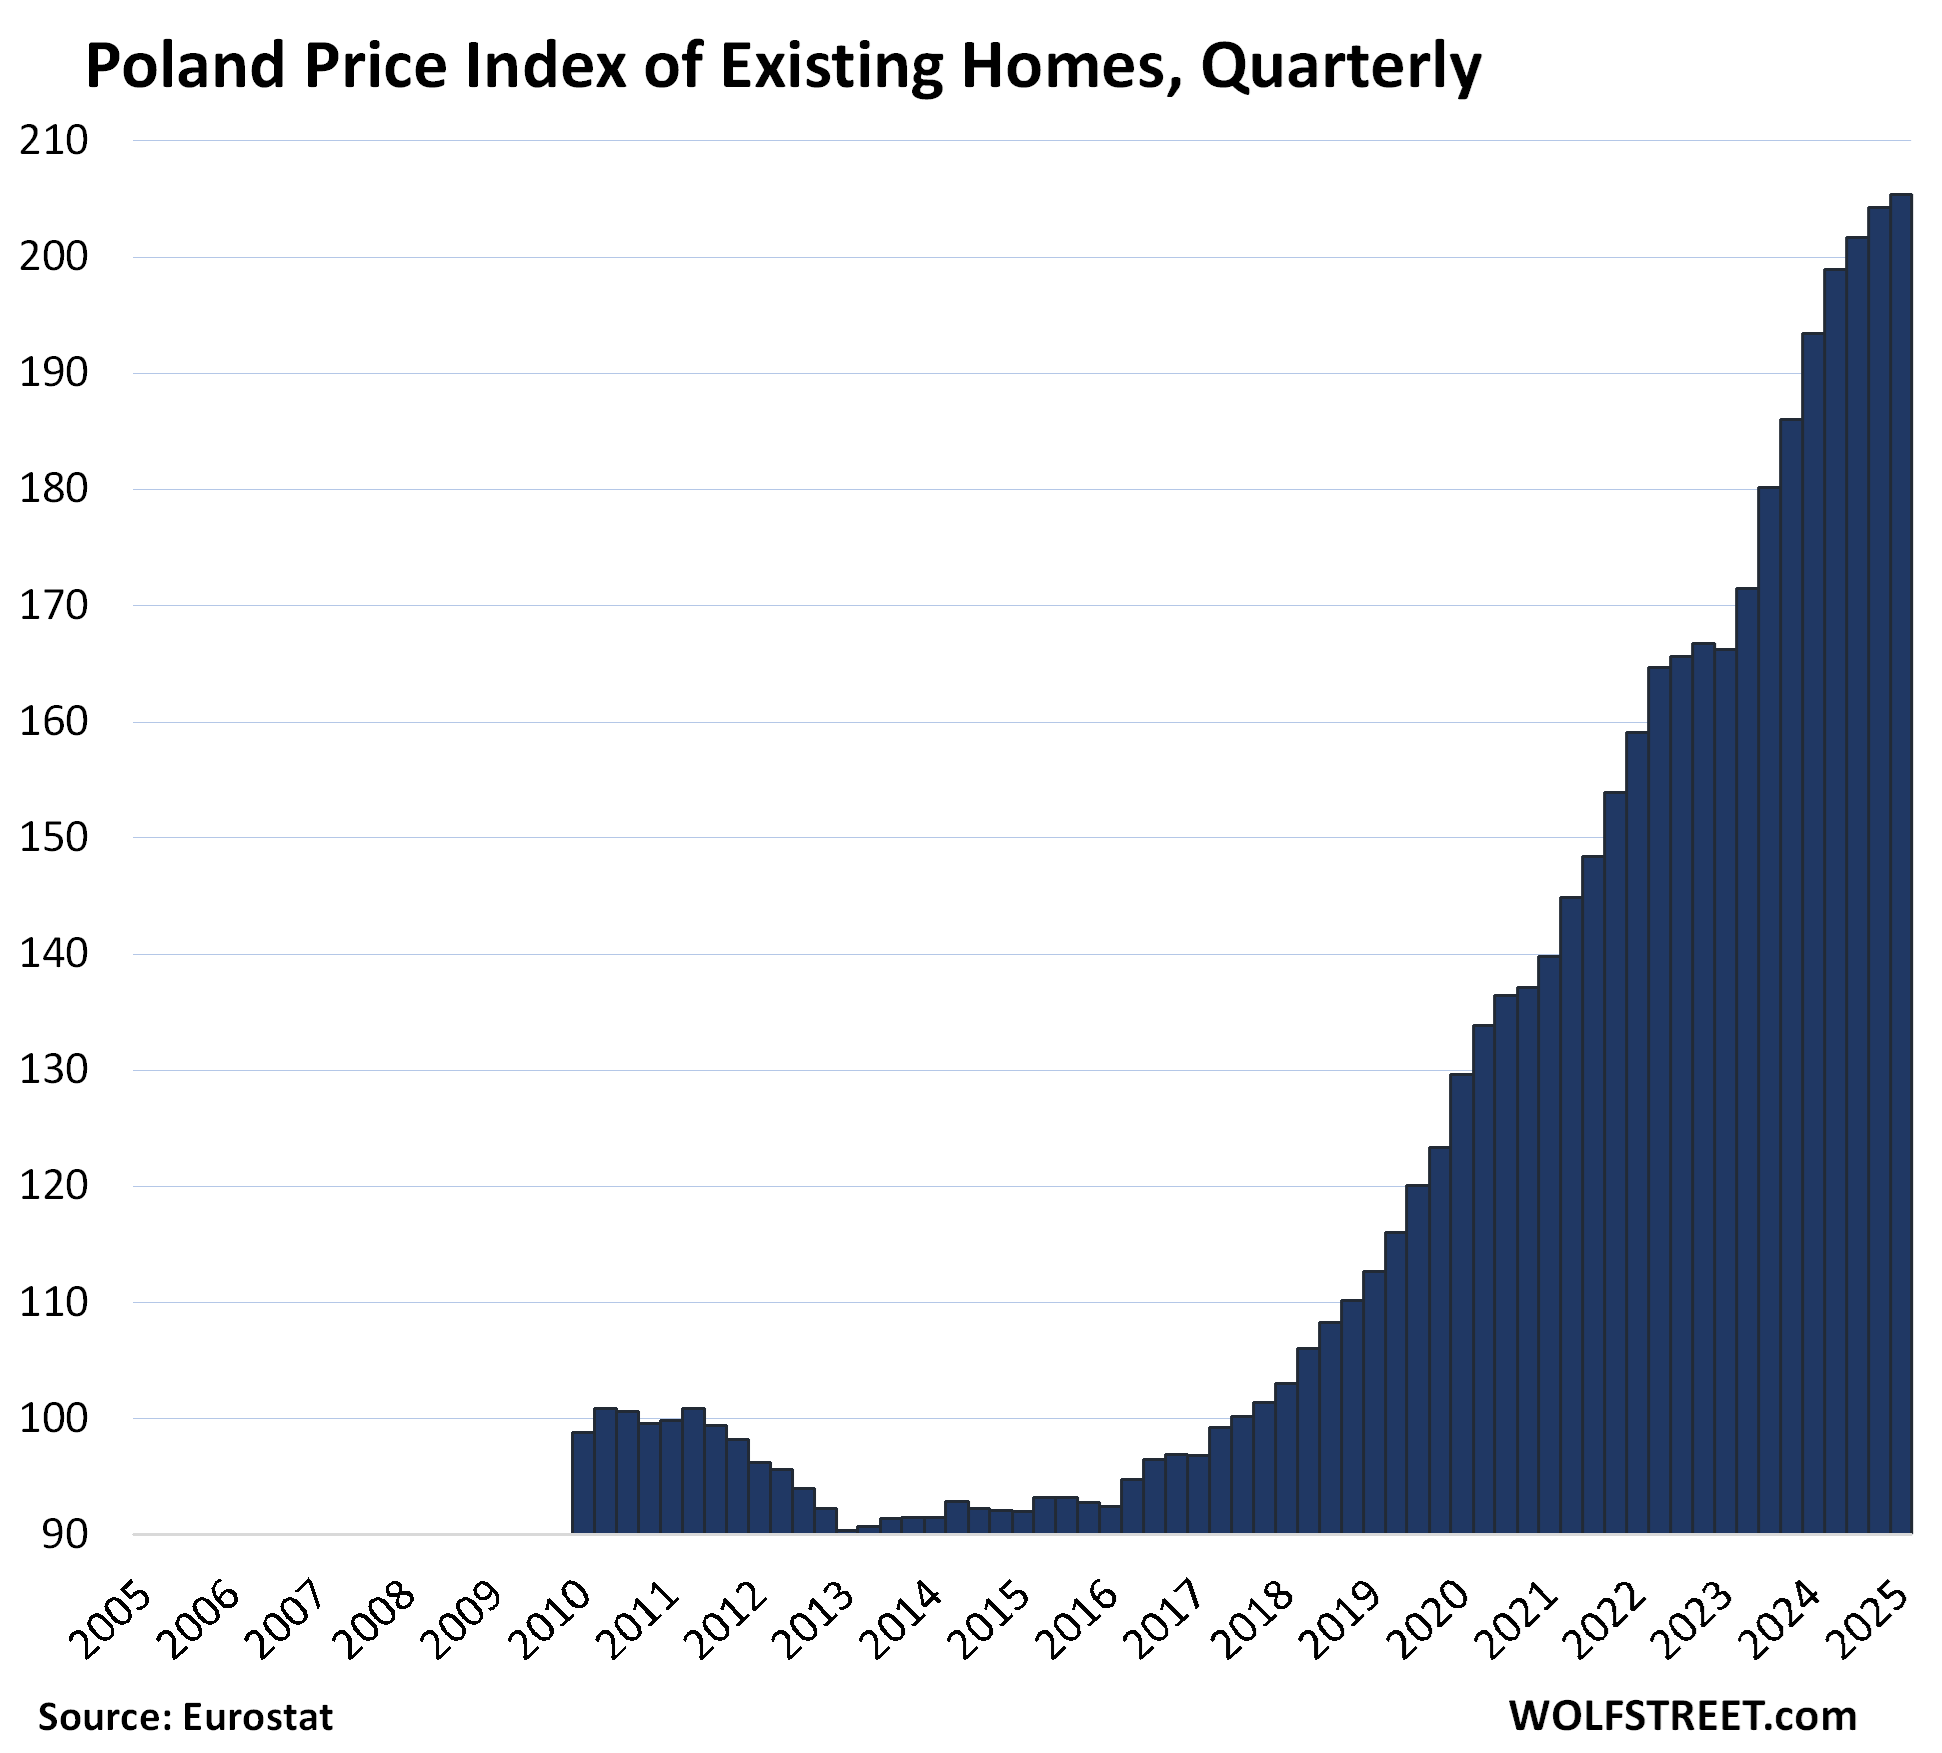
| Poland, Prices of Existing Homes | |||
| 2010 to Peak | QoQ | YoY | |
| 107.8% | 0.5% | 6.2% | New high |
The Eurostat data for Poland begins in 2010:
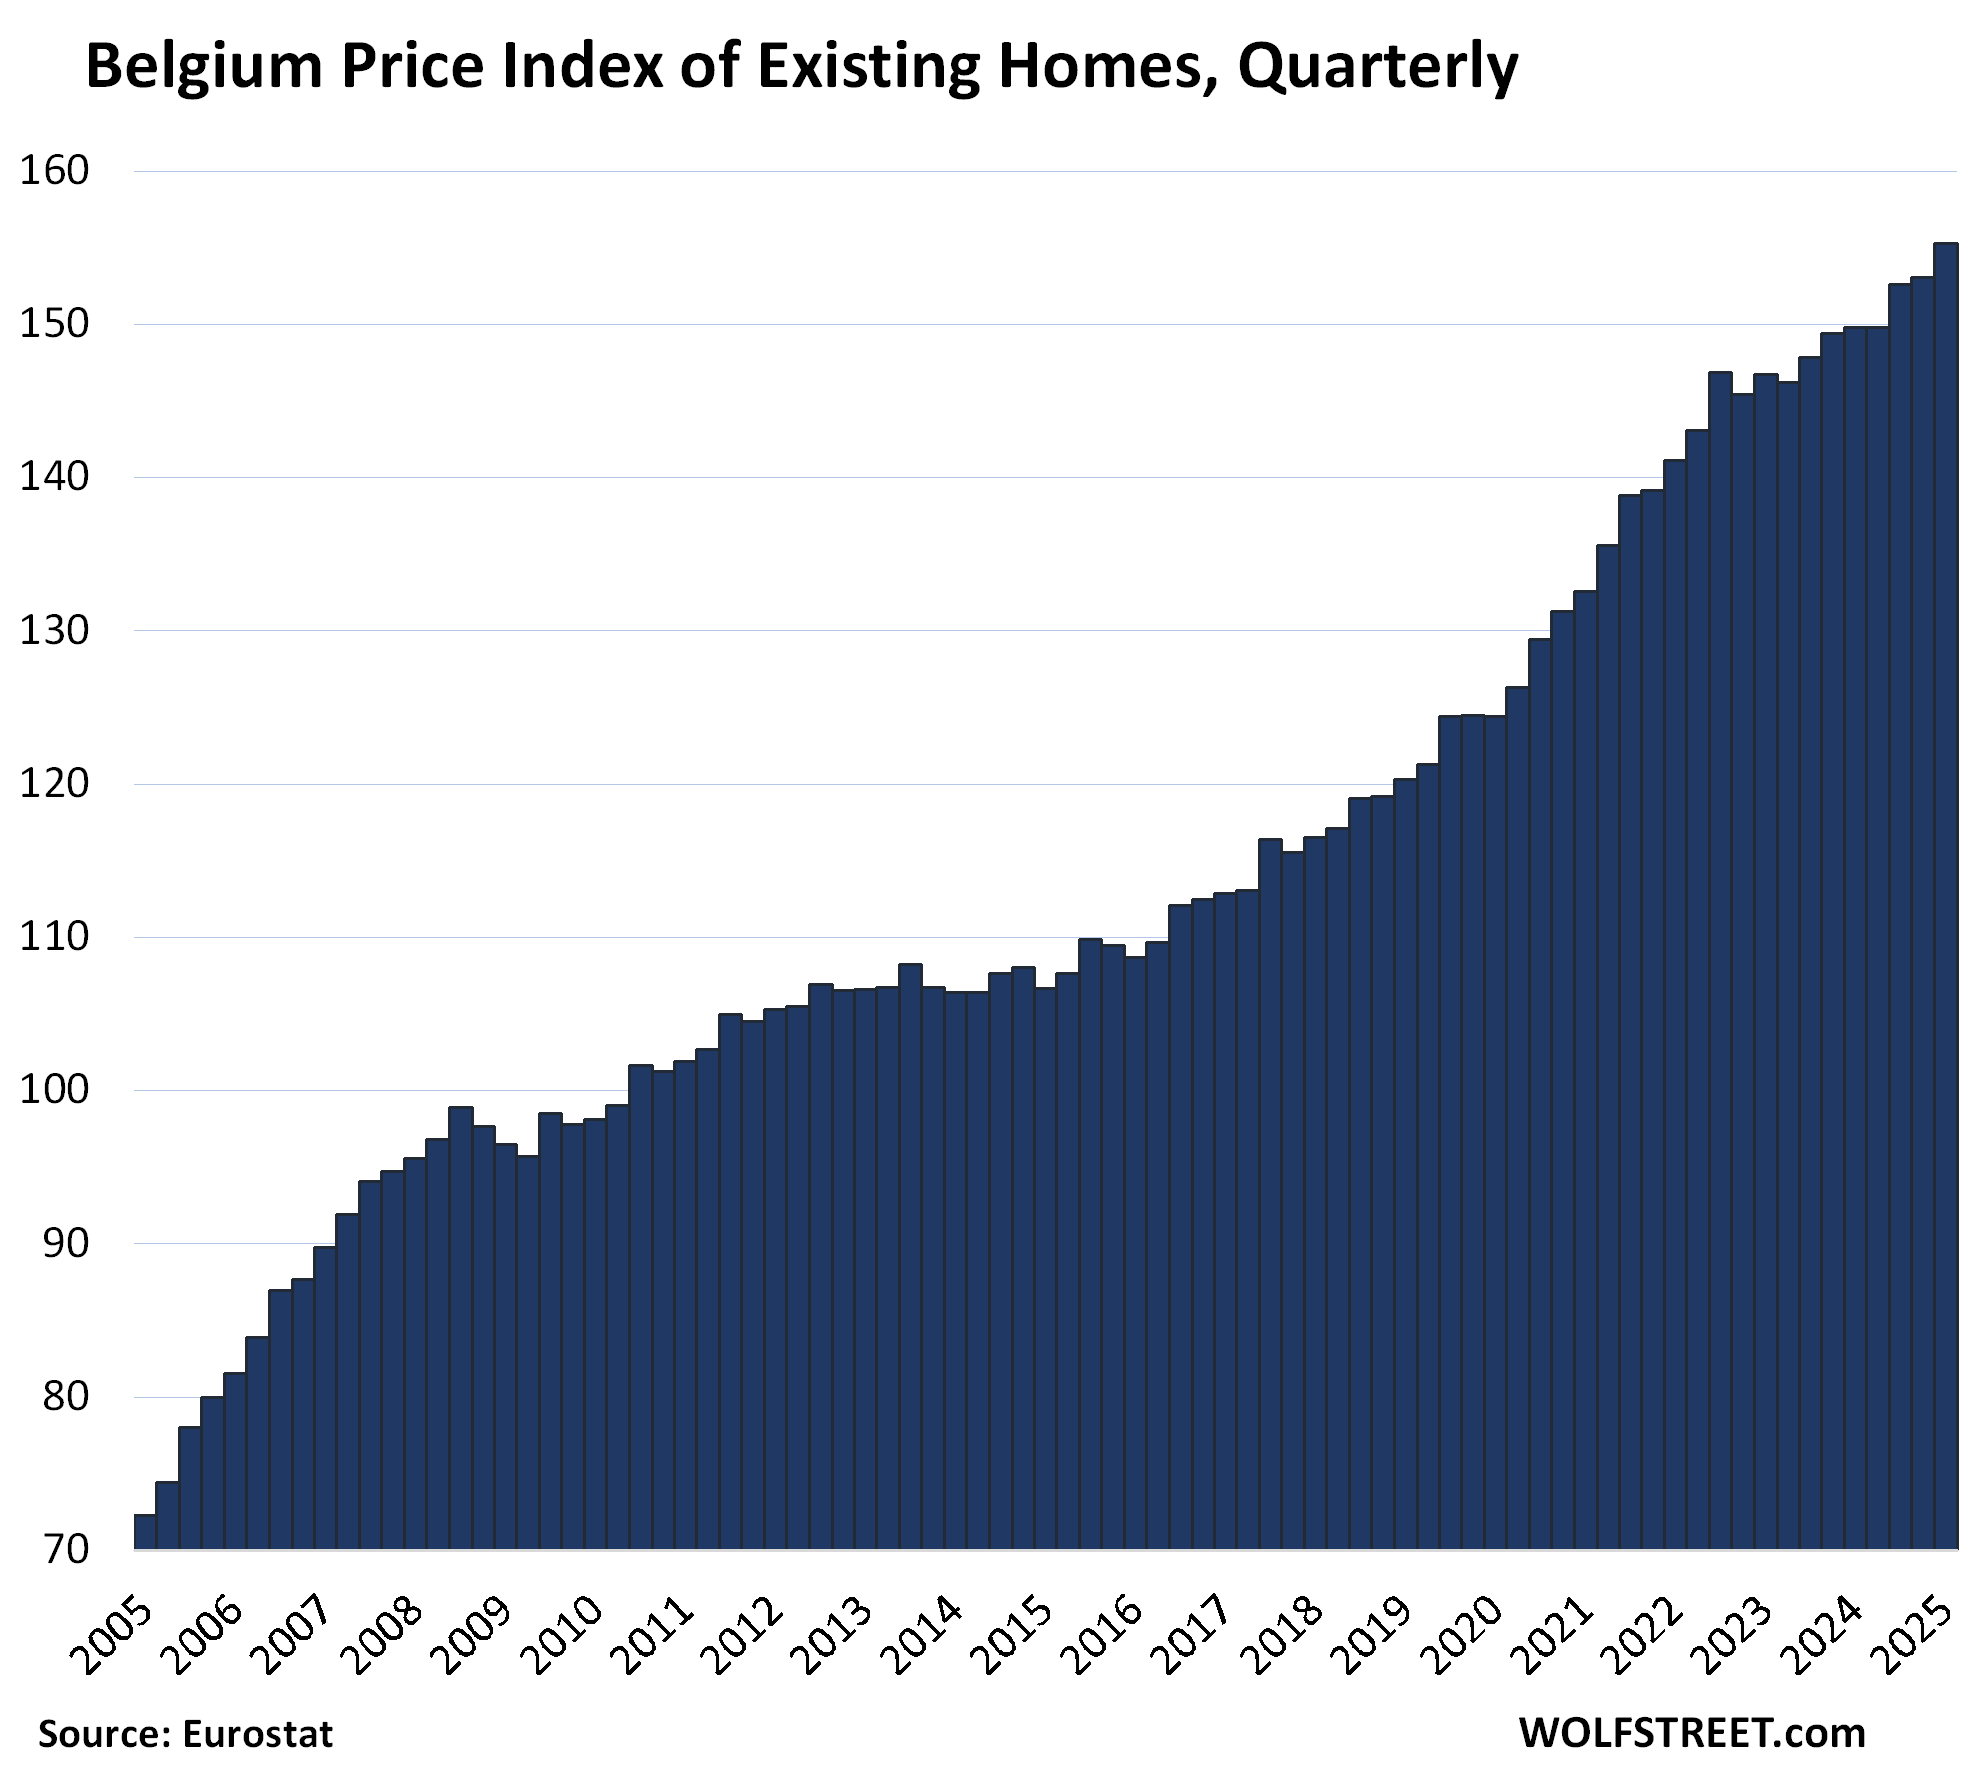
| Belgium, Prices of Existing Homes | |||
| 2010 to Peak | QoQ | YoY | |
| 58.2% | 1.4% | 3.6% | New high |
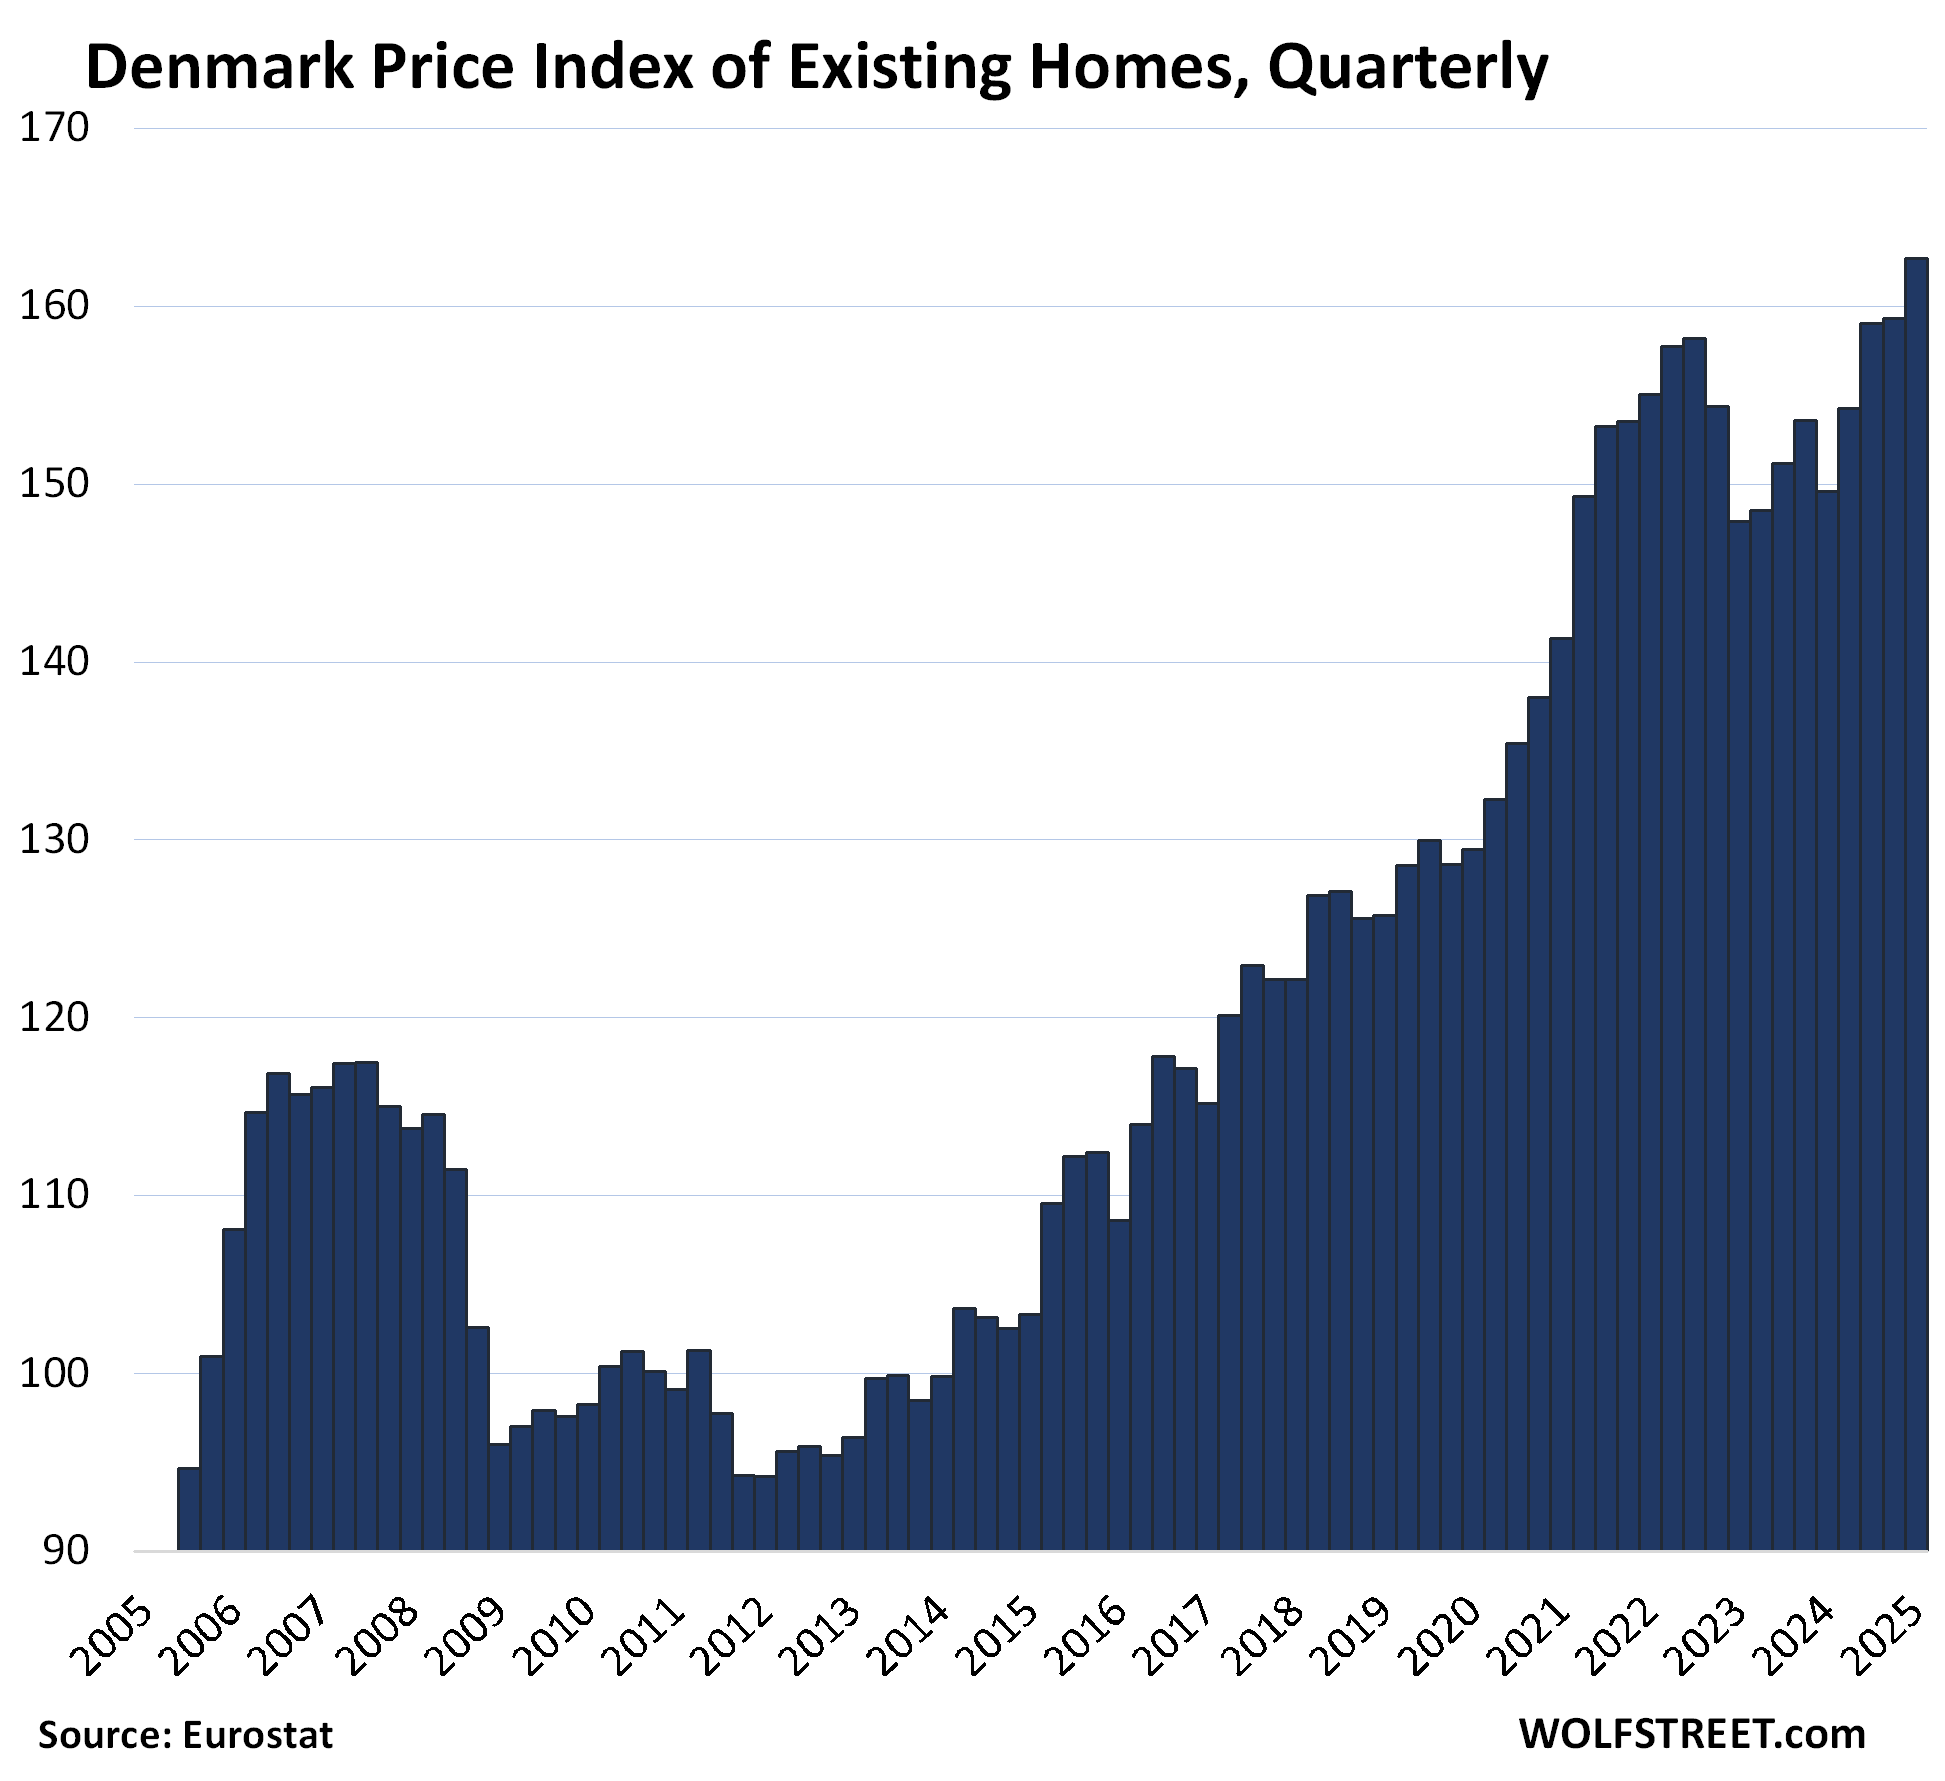
| Denmark, Prices of Existing Homes | |||
| 2010 to Peak | QoQ | YoY | |
| 65.5% | 2.1% | 8.8% | New High |
| Norway, Prices of Existing Homes | |||
| 2010 to Peak | QoQ | YoY | |
| 111.5% | 5.7% | 7.3% | New High |
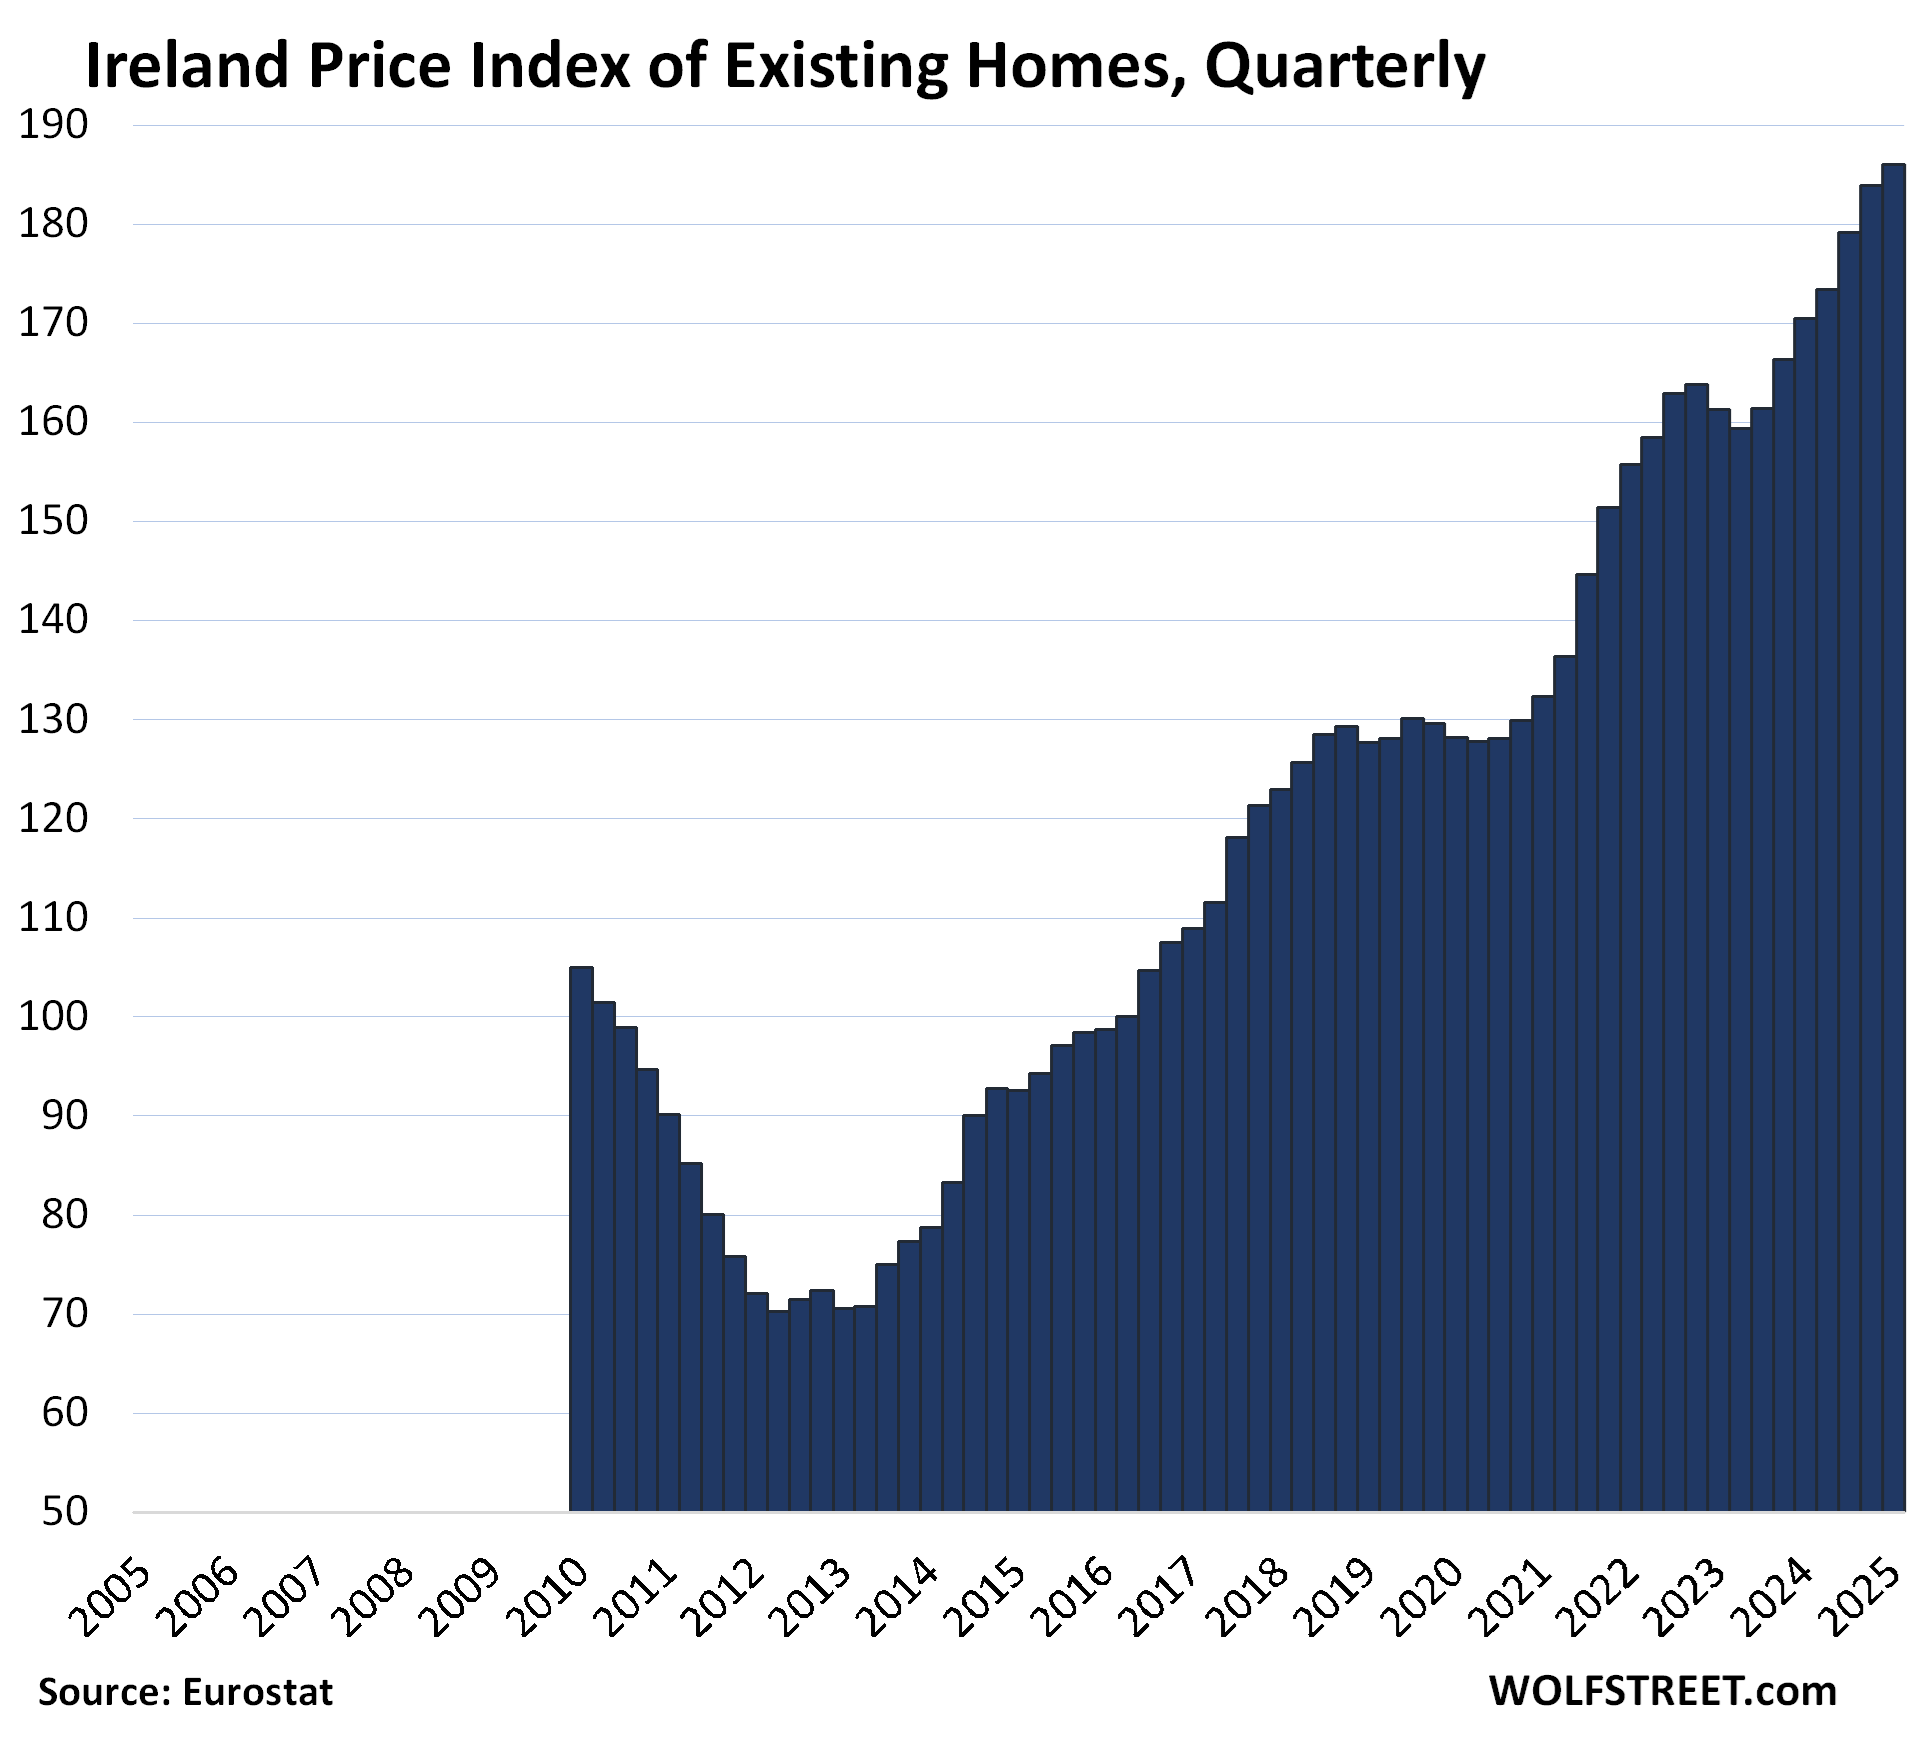
| Ireland, Prices of Existing Homes | |||
| 2010 to Peak | QoQ | YoY | |
| 77.2% | 1.1% | 9.1% | New High |
The Eurostat data only goes back to 2010, and Ireland’s troubles started earlier. But within the data, from 2010 to 2012, the index plunged by 33%.
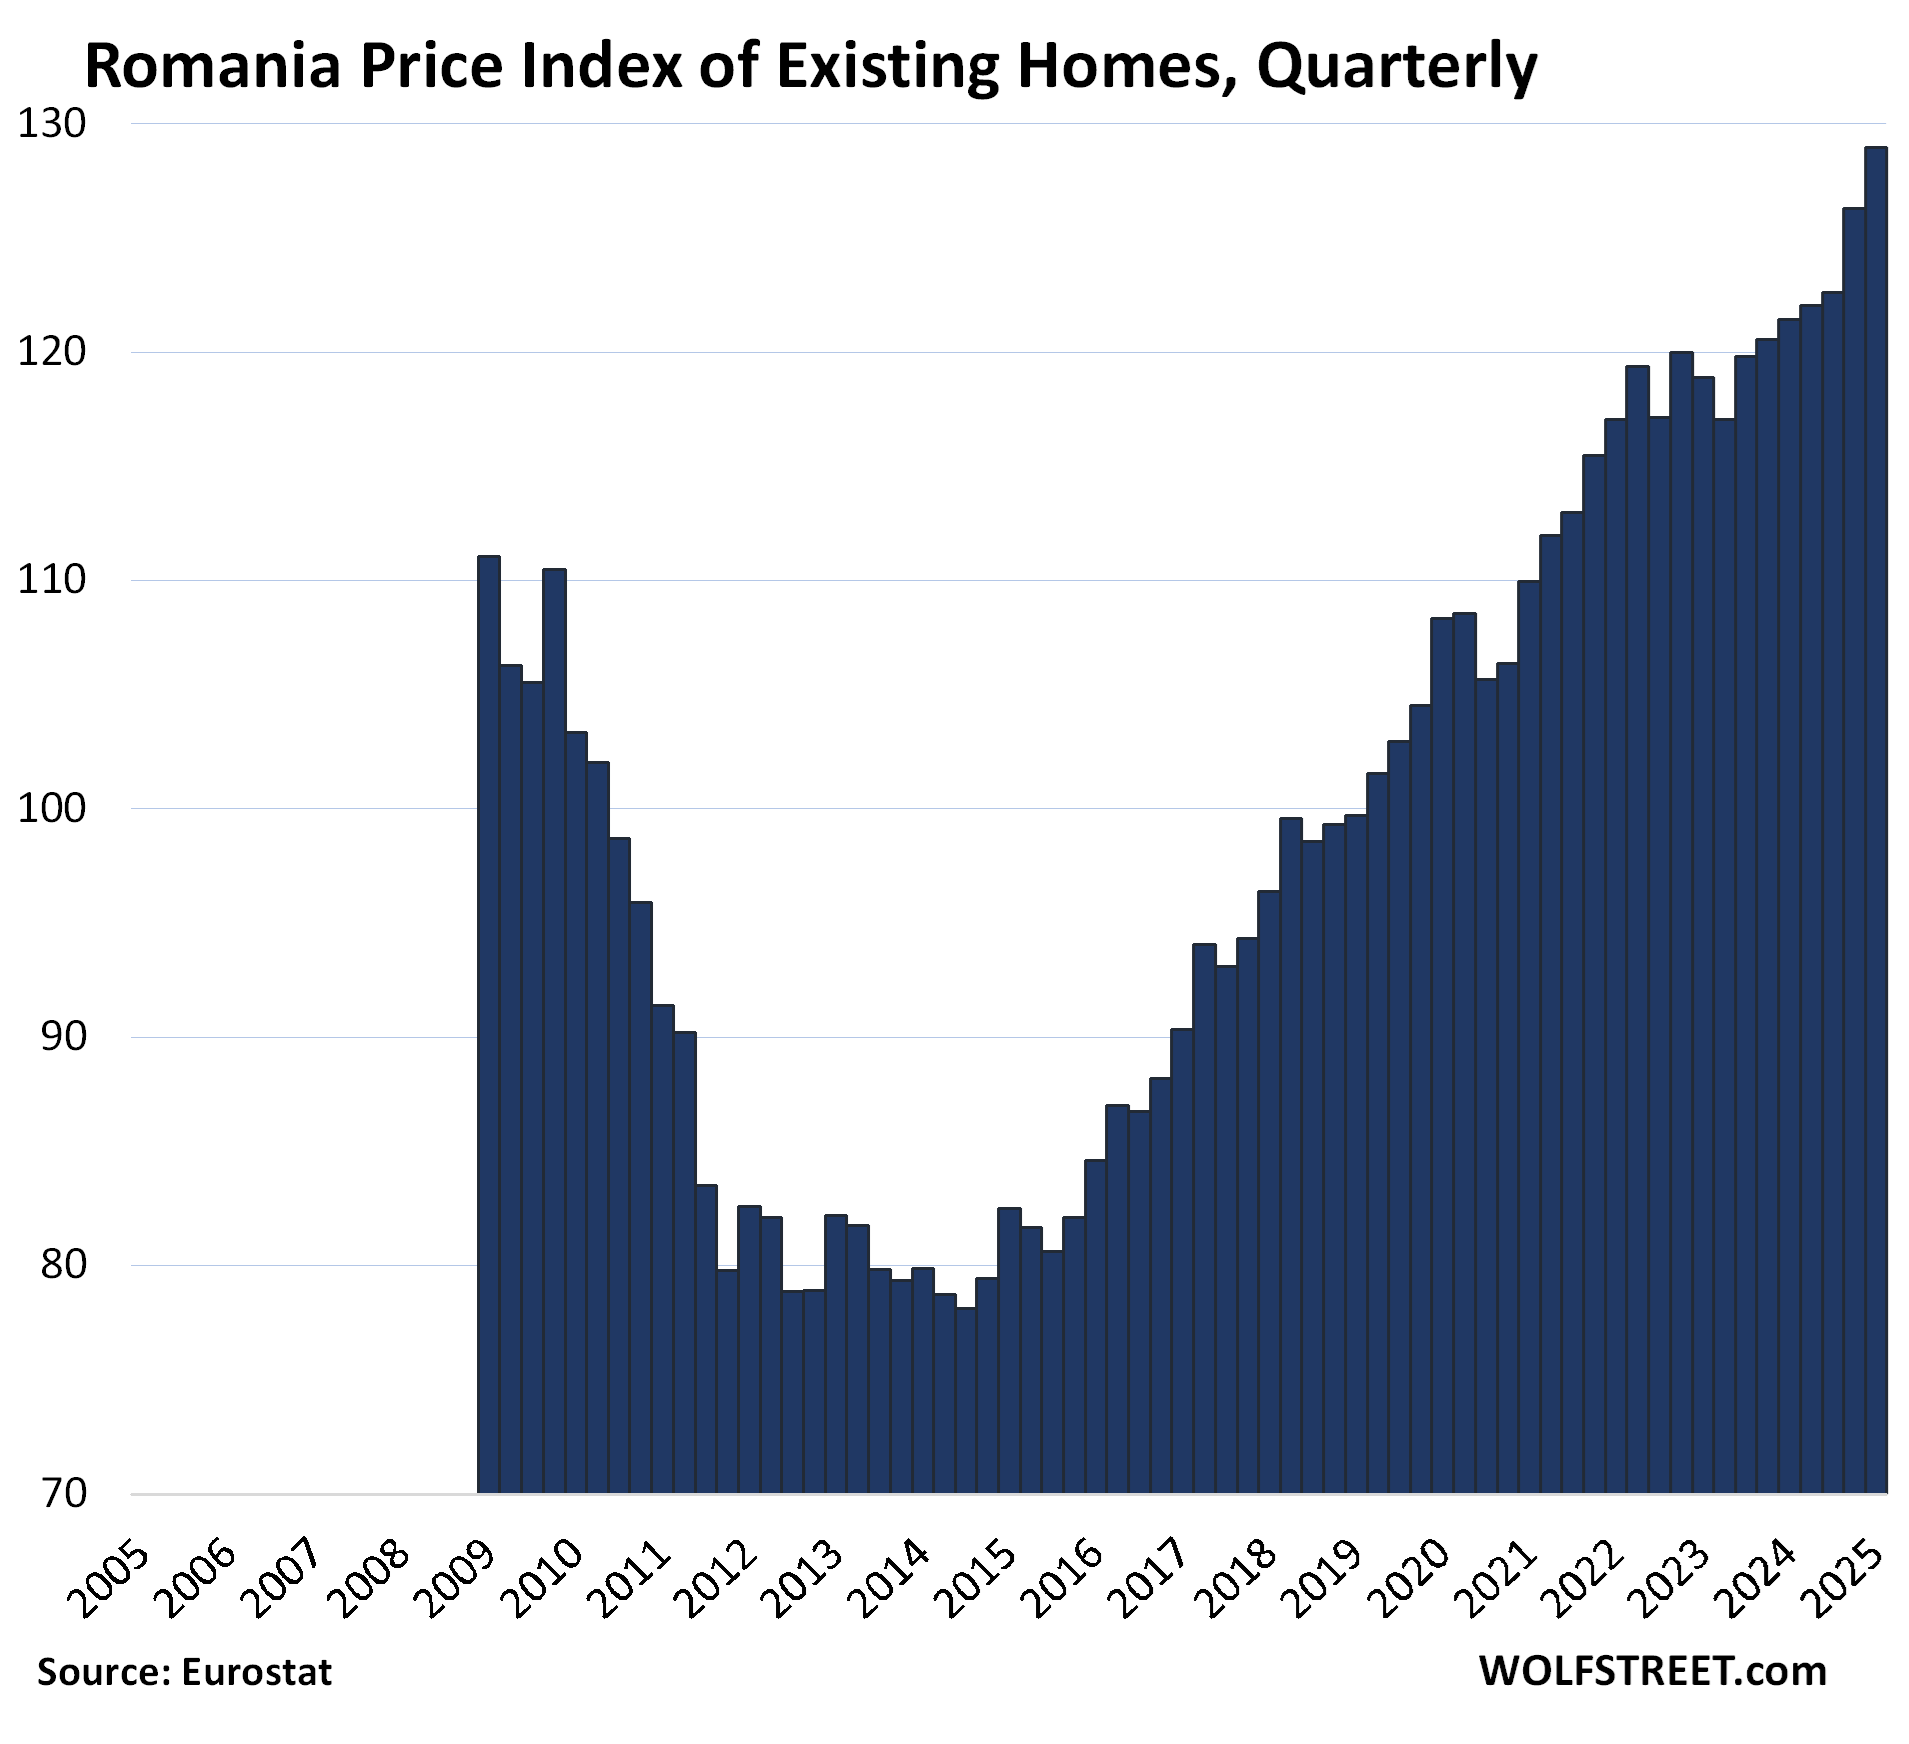
| Romania, Prices of Existing Homes | |||
| 2010 to Peak | QoQ | YoY | |
| 24.8% | 2.1% | 6.2% | New high |
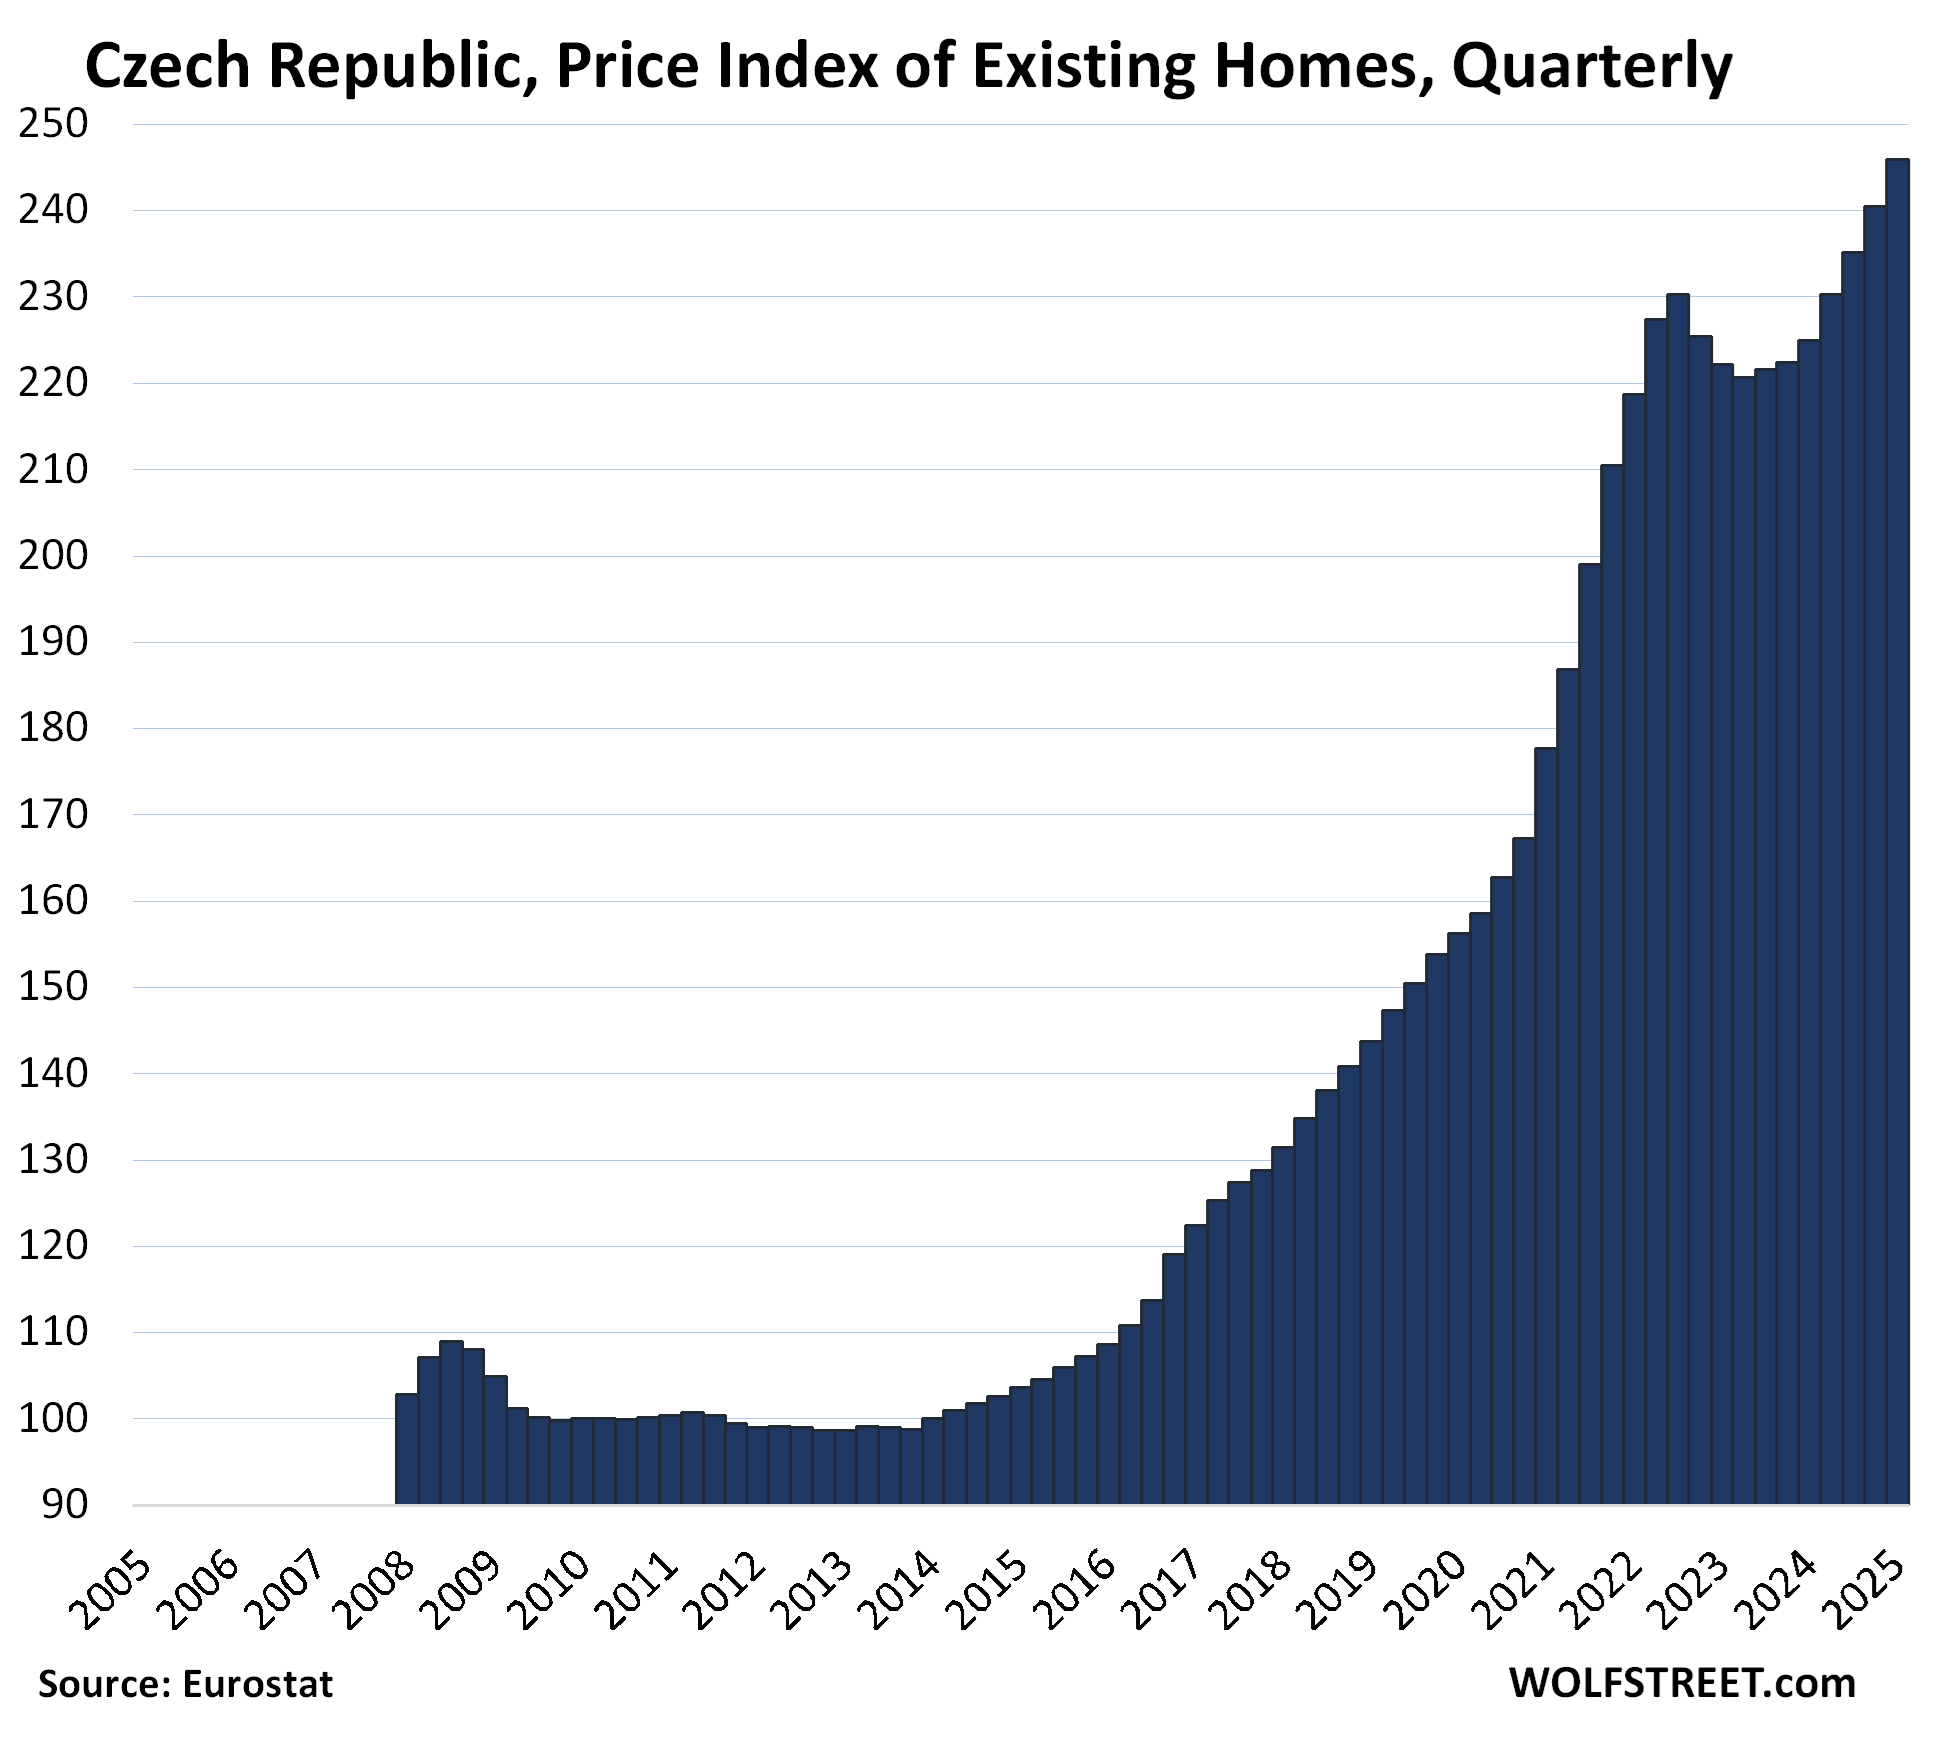
| Czech Republic, Prices of Existing Homes | |||
| 2010 to Peak | QoQ | YoY | |
| 145.9% | 2.2% | 9.3% | New high |
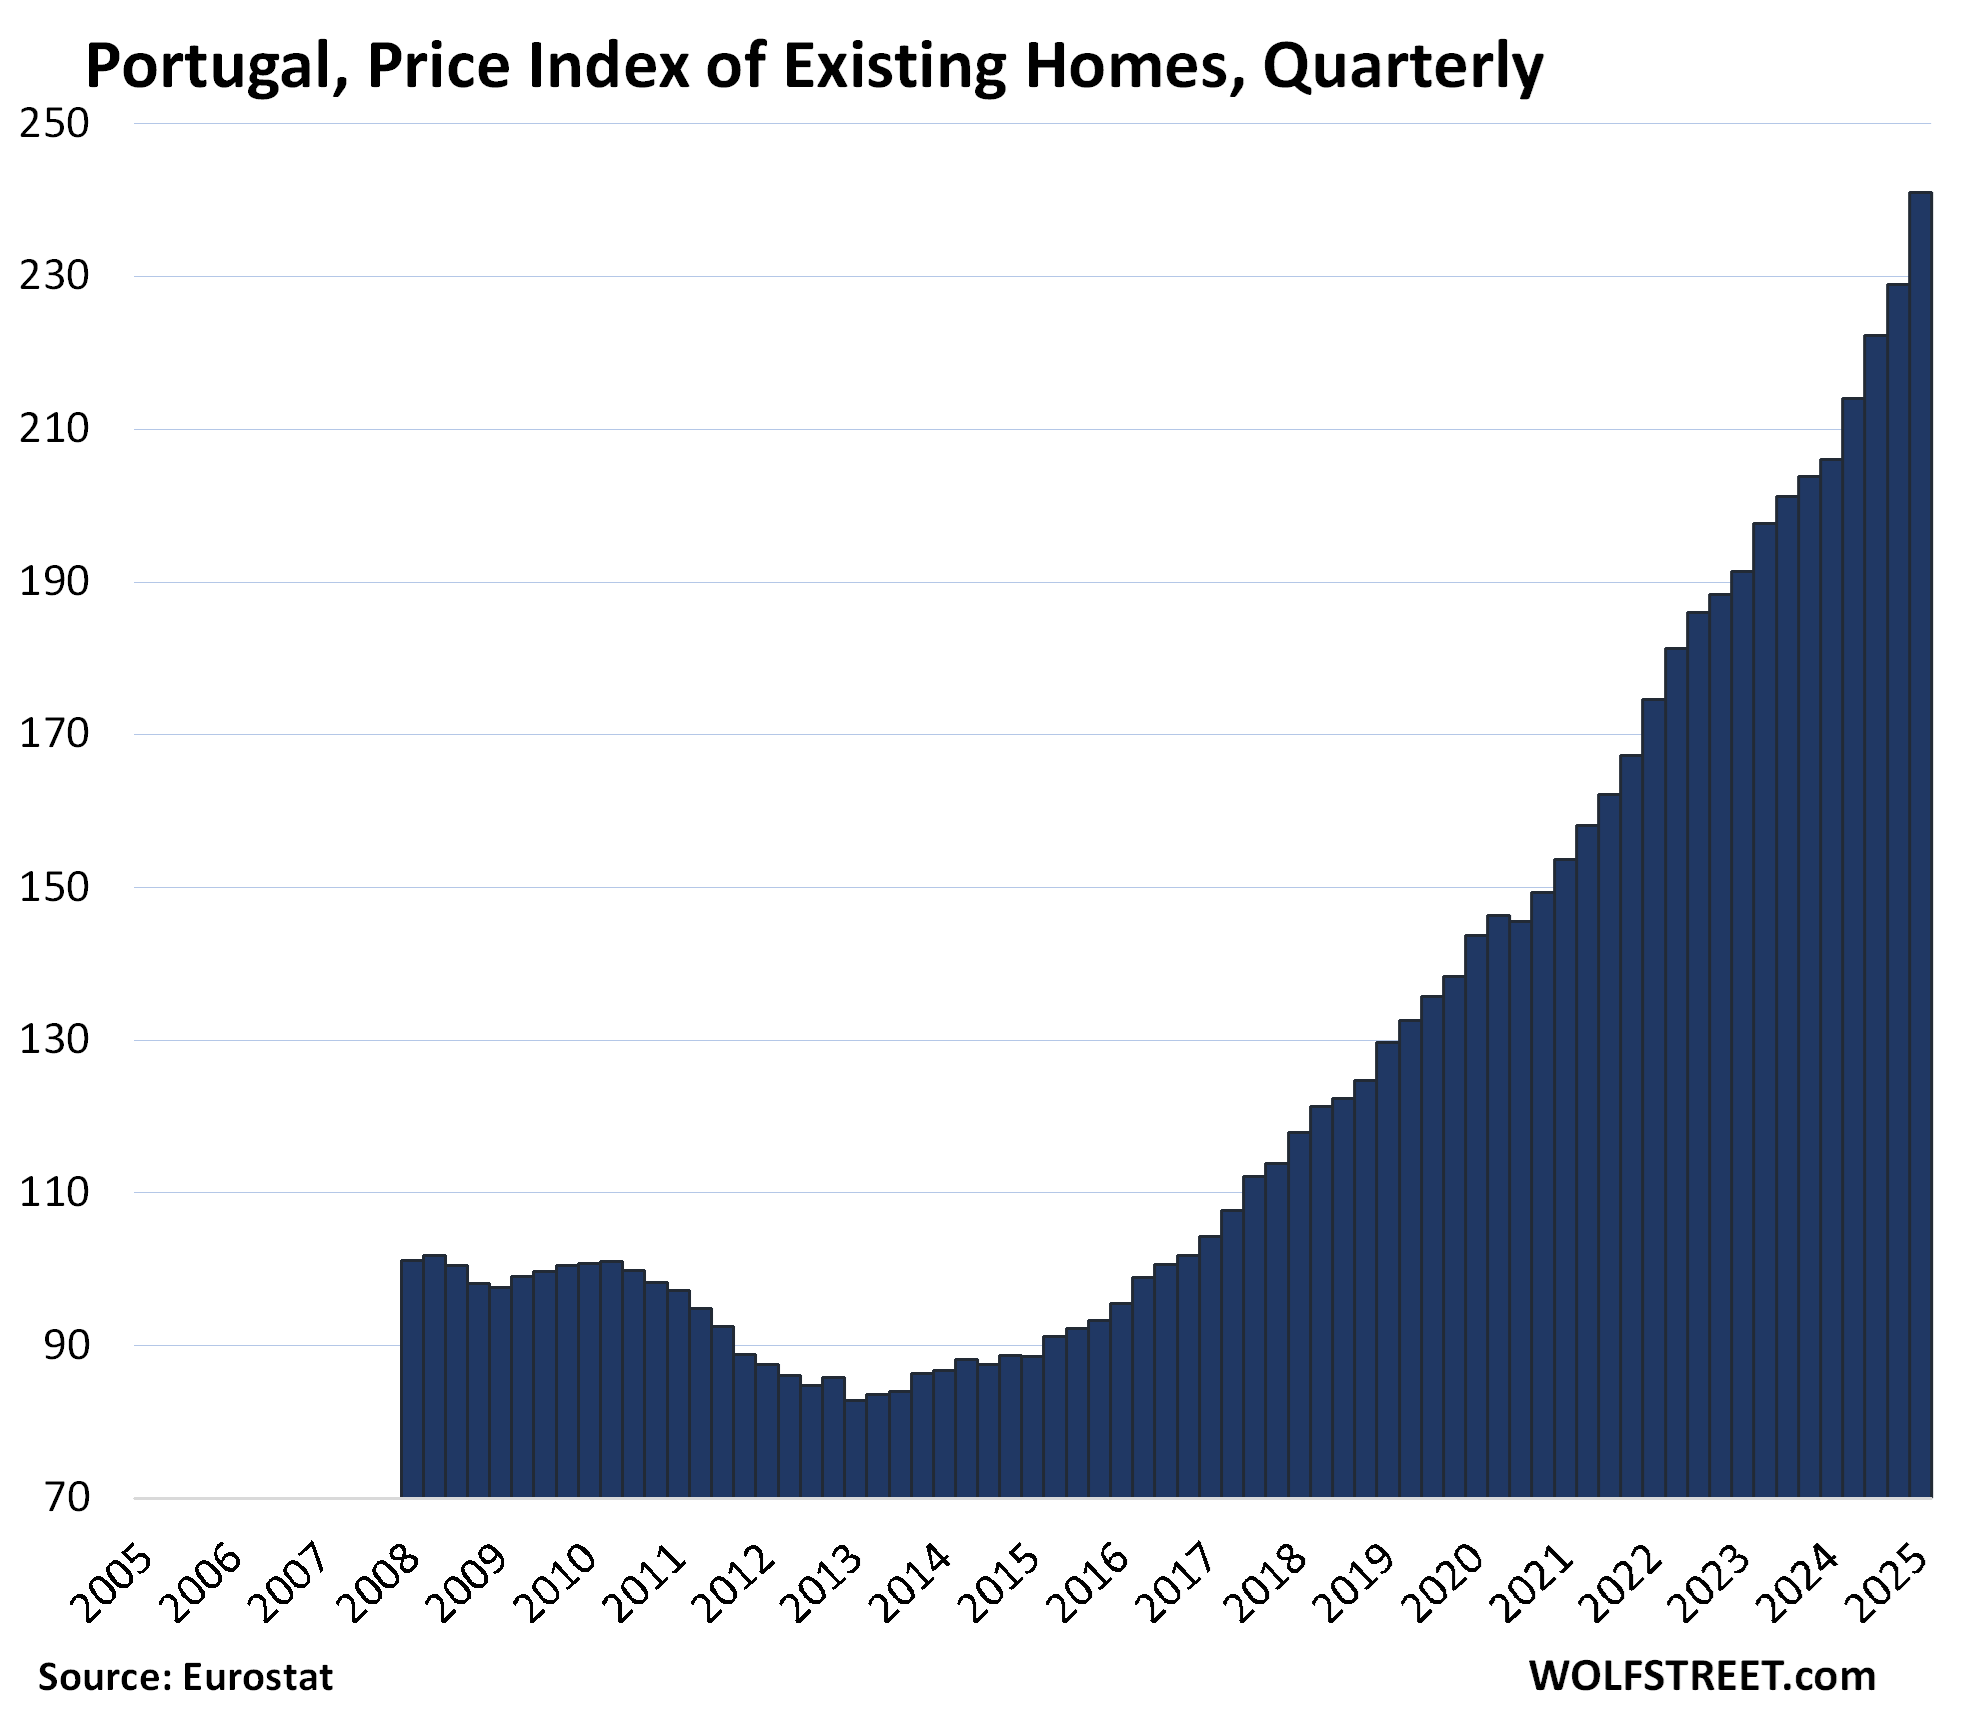
| Portugal, Prices of Existing Homes | |||
| 2010 to Peak | QoQ | YoY | |
| 139.1% | 5.3% | 17.0% | New high |
From 2010 to 2013, the index fell by nearly 20%. From that low point in 2013, the index has nearly tripled.
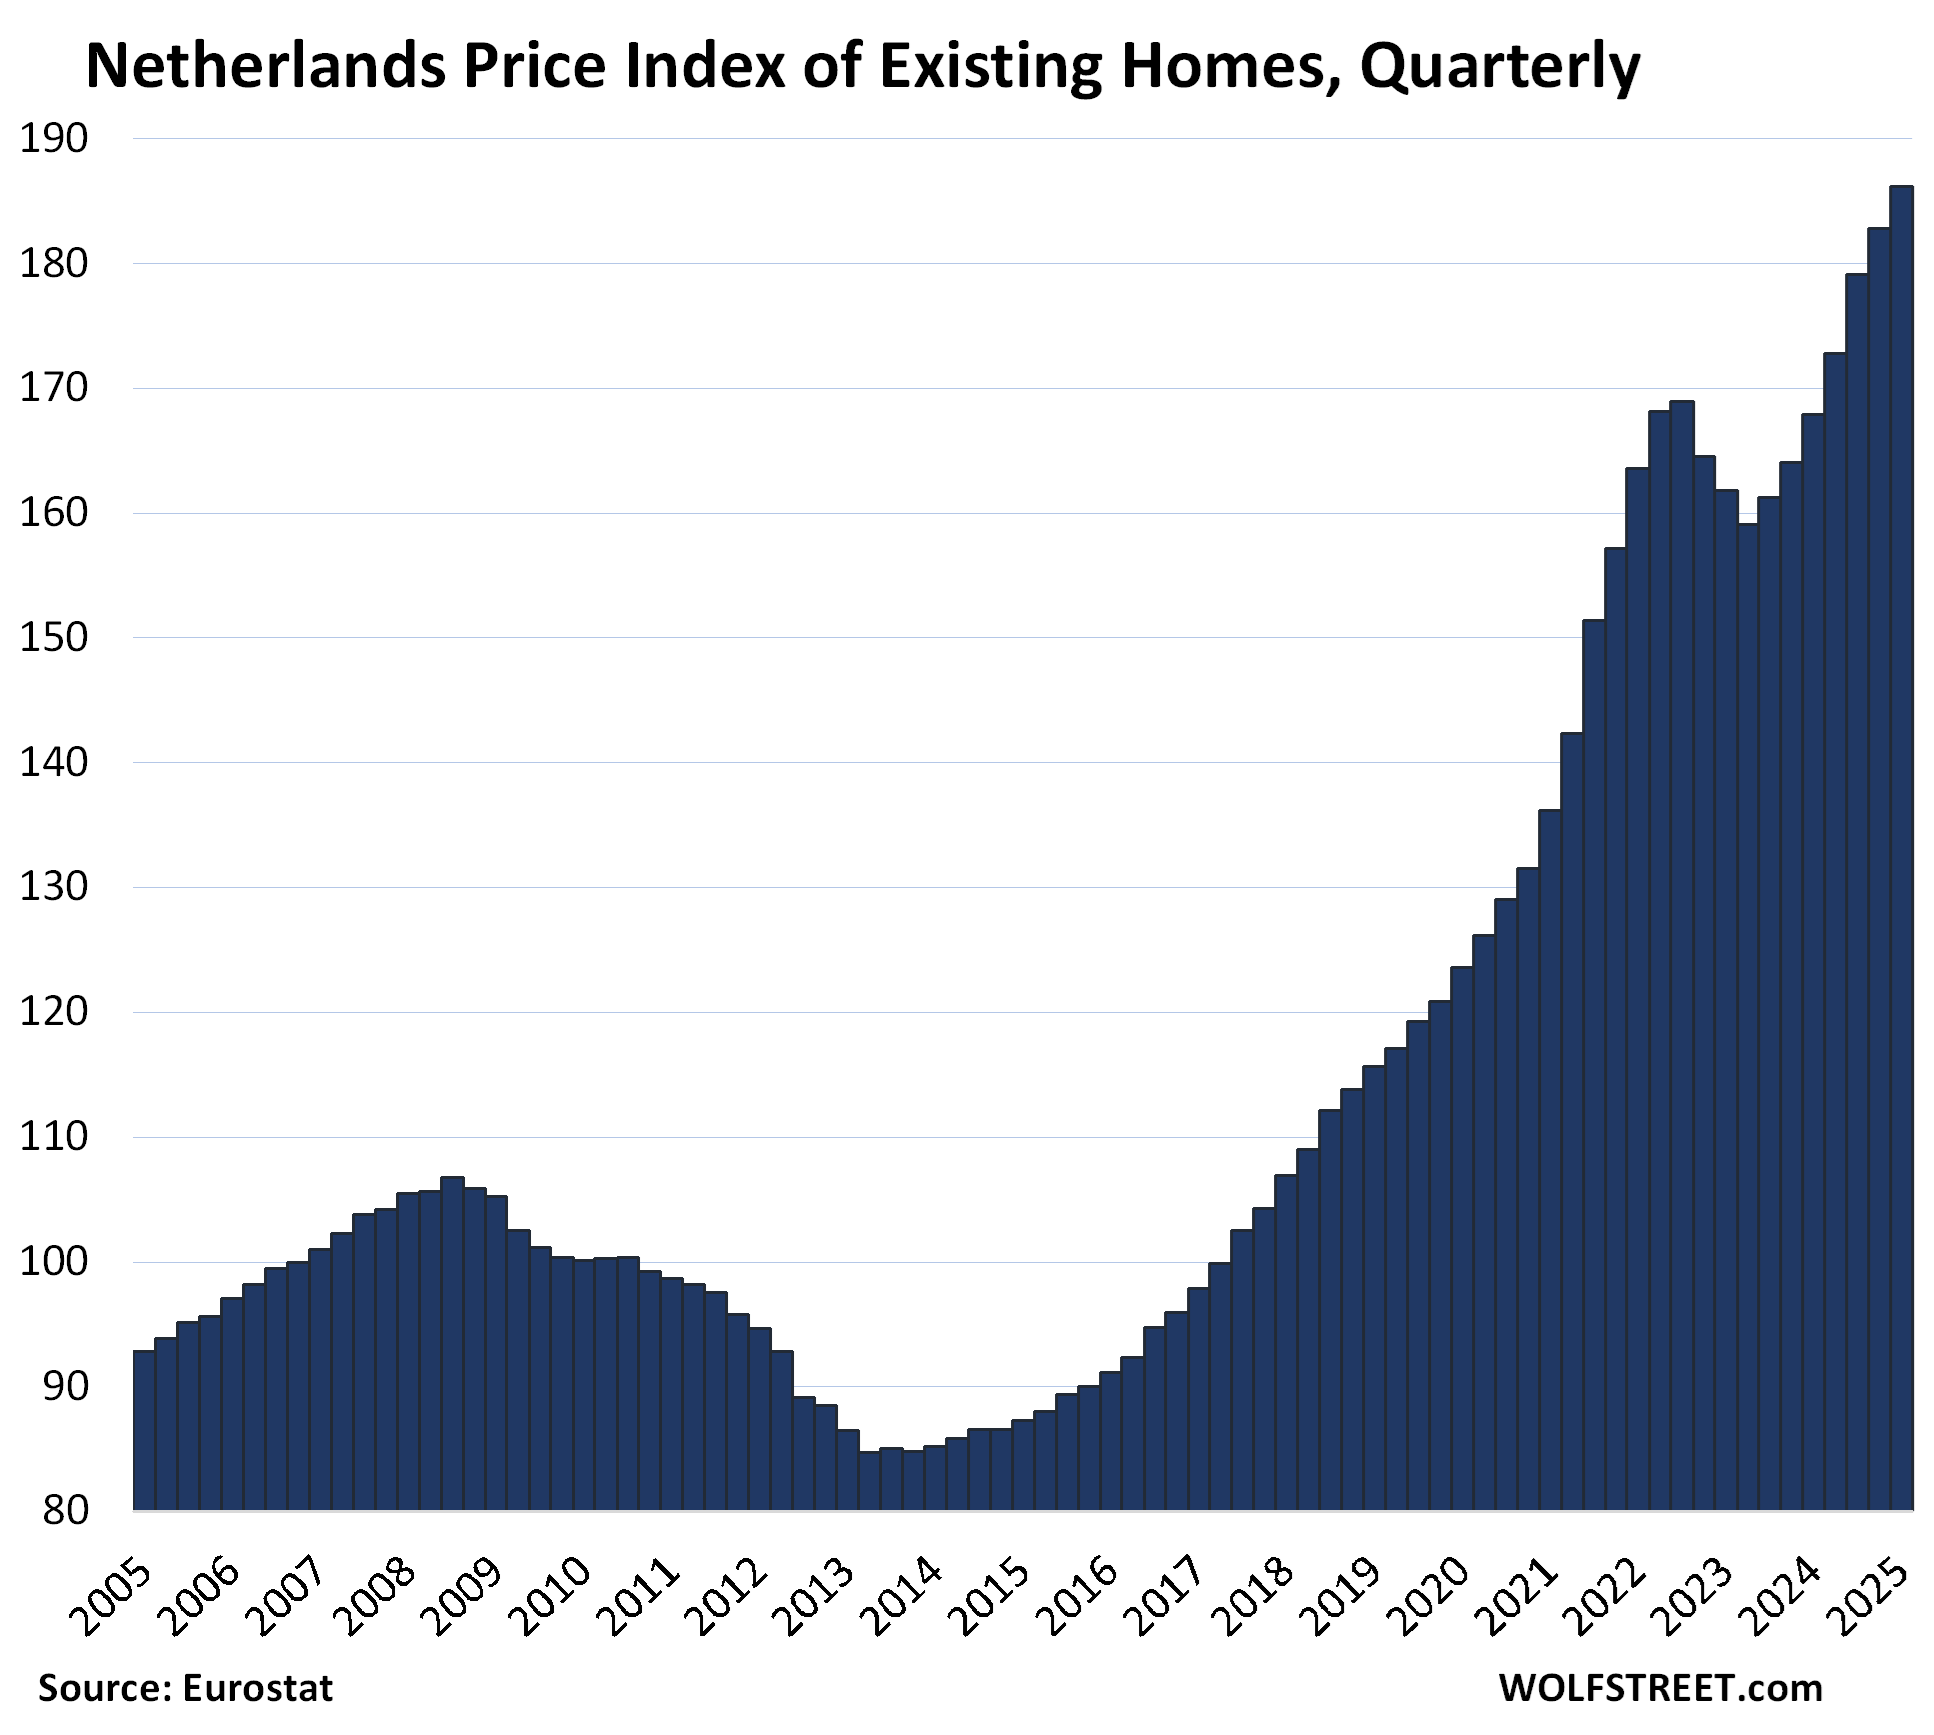
| Netherlands, Prices of Existing Homes | |||
| 2010 to Peak | QoQ | YoY | |
| 85.9% | 1.8% | 10.9% | New high |
Enjoy reading WOLF STREET and want to support it? You can donate. I appreciate it immensely. Click on the mug to find out how:

![]()
No wonder the Portuguese hate the foreigners buying up all their property. Up 17% YoY after several years of YoY growth is crazy.
Yes, they come in with their American wealth and make the local housing market unaffordable for locals. Happening in lots of places. Not always Americans though, but Chinese buyers and others too. Mexico City has some protests going on over the issue right now (apparently popular with Digital Nomads). Chinese buyers also drove up local markets in the US, though that has cooled in recent years. There is a lot of the going around.
Yeah you see a lot of those Chinese buyers even now in SoCal, especially in SGV and Irvine, doesn’t seem to ever slow down unfortunately…
The entire swath from Monterey Park to Diamond Bar (east of downtown Los Angeles) has gone Chinese/Korean. I sold a house in Diamond Bar and ALL the prospective buyers were Chinese.
Only 5% of the house transactions are made by foreigners. Do not follow ruzzian propaganda against the European establishment.
That’s the average across the US. Foreign investors favor a few specific markets, and the purchases by foreign investors concentrate in those markets and the percentages of sales are much higher in those markets. But as I said, buying by foreign investors has cooled.
Portugal real estate bubble is crazy. The prices in Lissabon are inflated even more than the article suggests. The prices in the country side are quite low but the appriciation in the costal cities, especially Lissabon is insane.
Lissabon is more expensive than Berlin or Vienna but salaries are half. Golden Visas and remote working expats + AirBnB + over tourism + prices go up mentallity.
Low rates caused quite a bit of distortion in most markets.
Can we blame all of these on supply shortages too?
In Europe? In the large urban centers maybe, but Italy is still full of $1 homes. And not just Italy – the countryside is still super affordable throughout Eastern & Southern Europe.
In many case it’s more of a “move to the city” bubble rather than a housing bubble. While suburban & rural living is gaining huge popularity in Europe too, at the same time the largest cities had a population growth of +10% (sometimes +15%) in just 15 years. A lot of that is immigration from the Middle East, Ukraine, the Balkans, other EU countries, etc – demand that is kind of unpredictable.
Move to the City seems to be a trend in a lot of places around the world these days. Japan and South Korea are probably the most blatant examples, but the US has dealt with the same issue. I saw a US map a few years ago that showed how jobs sprang back in larger metro areas within a few years of 2008, while a lot of rural counties took a decade to get back to parity. I’d be shocked if Europe hasn’t been dealing with similar dynamics, especially given how their population pyramids are shaped these days.
The thing people forget is that, even in the United States, with only a few exceptions, you can drive 40 miles outside of our large cities and be in the middle of nowhere.
There’s plenty of space. It’s just that people largely want to be near the action, and the jobs are in dense areas, so even if you live outside, you generally have to commute into crowded areas.
Interesting data for Europe, wonder if majority of their population have the same house humping mentality that housing will always go up and a sense of shame (or throwing away money mentality) in renting as a lot of people have in the US. At least they don’t have this beast call the 30yrs fixed mortgage to harden their belief..
That is exactly the mentality we have in the Netherlands. Even 30yrs fixed pay-interest-only mortgages with government subsidy on the interest. Tough market for starters/young people
A big difference in housing markets is if the buyer can “assume” the mortgage of the seller, which sort of happens in Canada but never in the US. It would be nice to see the most recent average home price in the various countries discussed by Wolf. I wouldn’t mind buying a house in rural France, Germany, Italy, or Greece, away from the invasion.
This is a good solution, but if you are retired or have enough money, it is difficult to find work in small towns and villages in Europe.
Property prices in the provinces of European countries have not yet jumped to insanely ridiculous levels.
A good solution? A good solution for what? Isn’t there a certain point in life when you realize you’re not accomplishing anything by buying property? Maybe you’re not there yet.
“Be as simple as you can be; you will be astonished to see how uncomplicated and happy your life can become.”
– Paramahansa Yogananda
There are a lot of differences between US and EU.
In EU cities are much more compact, you walk to the school, walk to the grocery store, etc.
Because of that US is mostly flat (single family homes) as you drive everywhere, EU is mostly multi family homes.
That makes supply lower (as no land in the cities), and demand higher (good location means 10-15 minutes walk to school, park, restaurants, etc.)
As for price, for Poland ratio between property price and average salary is even declining last few years.
Rent to price is 7-8% for last 20 years, so there is no bubble.
Additionaly, government regulations on buildings energy-efficientcy made old property cheaper but the new one grown in price.
My apartment in central Stockholm, Sweden is up 1200% since I bought it in 1993. I wouldn’t mind seeing prices fall.
In gold, your apartment is flat. Since 93, gold’s up 1000% in USD, and SEK lost another 17% to the dollar. Sweden tax capital gains?
If you used a mortgage — nice, you beat this debt game.
What about the apartment priced in S&P 500? What about gold priced in S&P 500 over this period. Gold is up 730% over this period, the S&P 500 is up 1,300% over this period. The apartment is up 1,200% (according to Volvo P-1800).
So the apartment beat gold and is just a little behind the S&P 500.
But pricing one asset in another asset… does that even make sense? These three are very different assets with very different costs and risks.
what will happen in nz and aussie ?
Are these in USD figures or local currency figures?
1. Eurostat doesn’t do dollars.
2. These are not currency figures at all, but an index where the index value was set at 100 for 2010. The local indices are constructed from local currency, which for most of these is the euro, but for some it’s the local currency.