The new and improved Standing Repo Facility (SRF) sprang into action for one day at quarter-end on June 30.
By Wolf Richter for WOLF STREET.
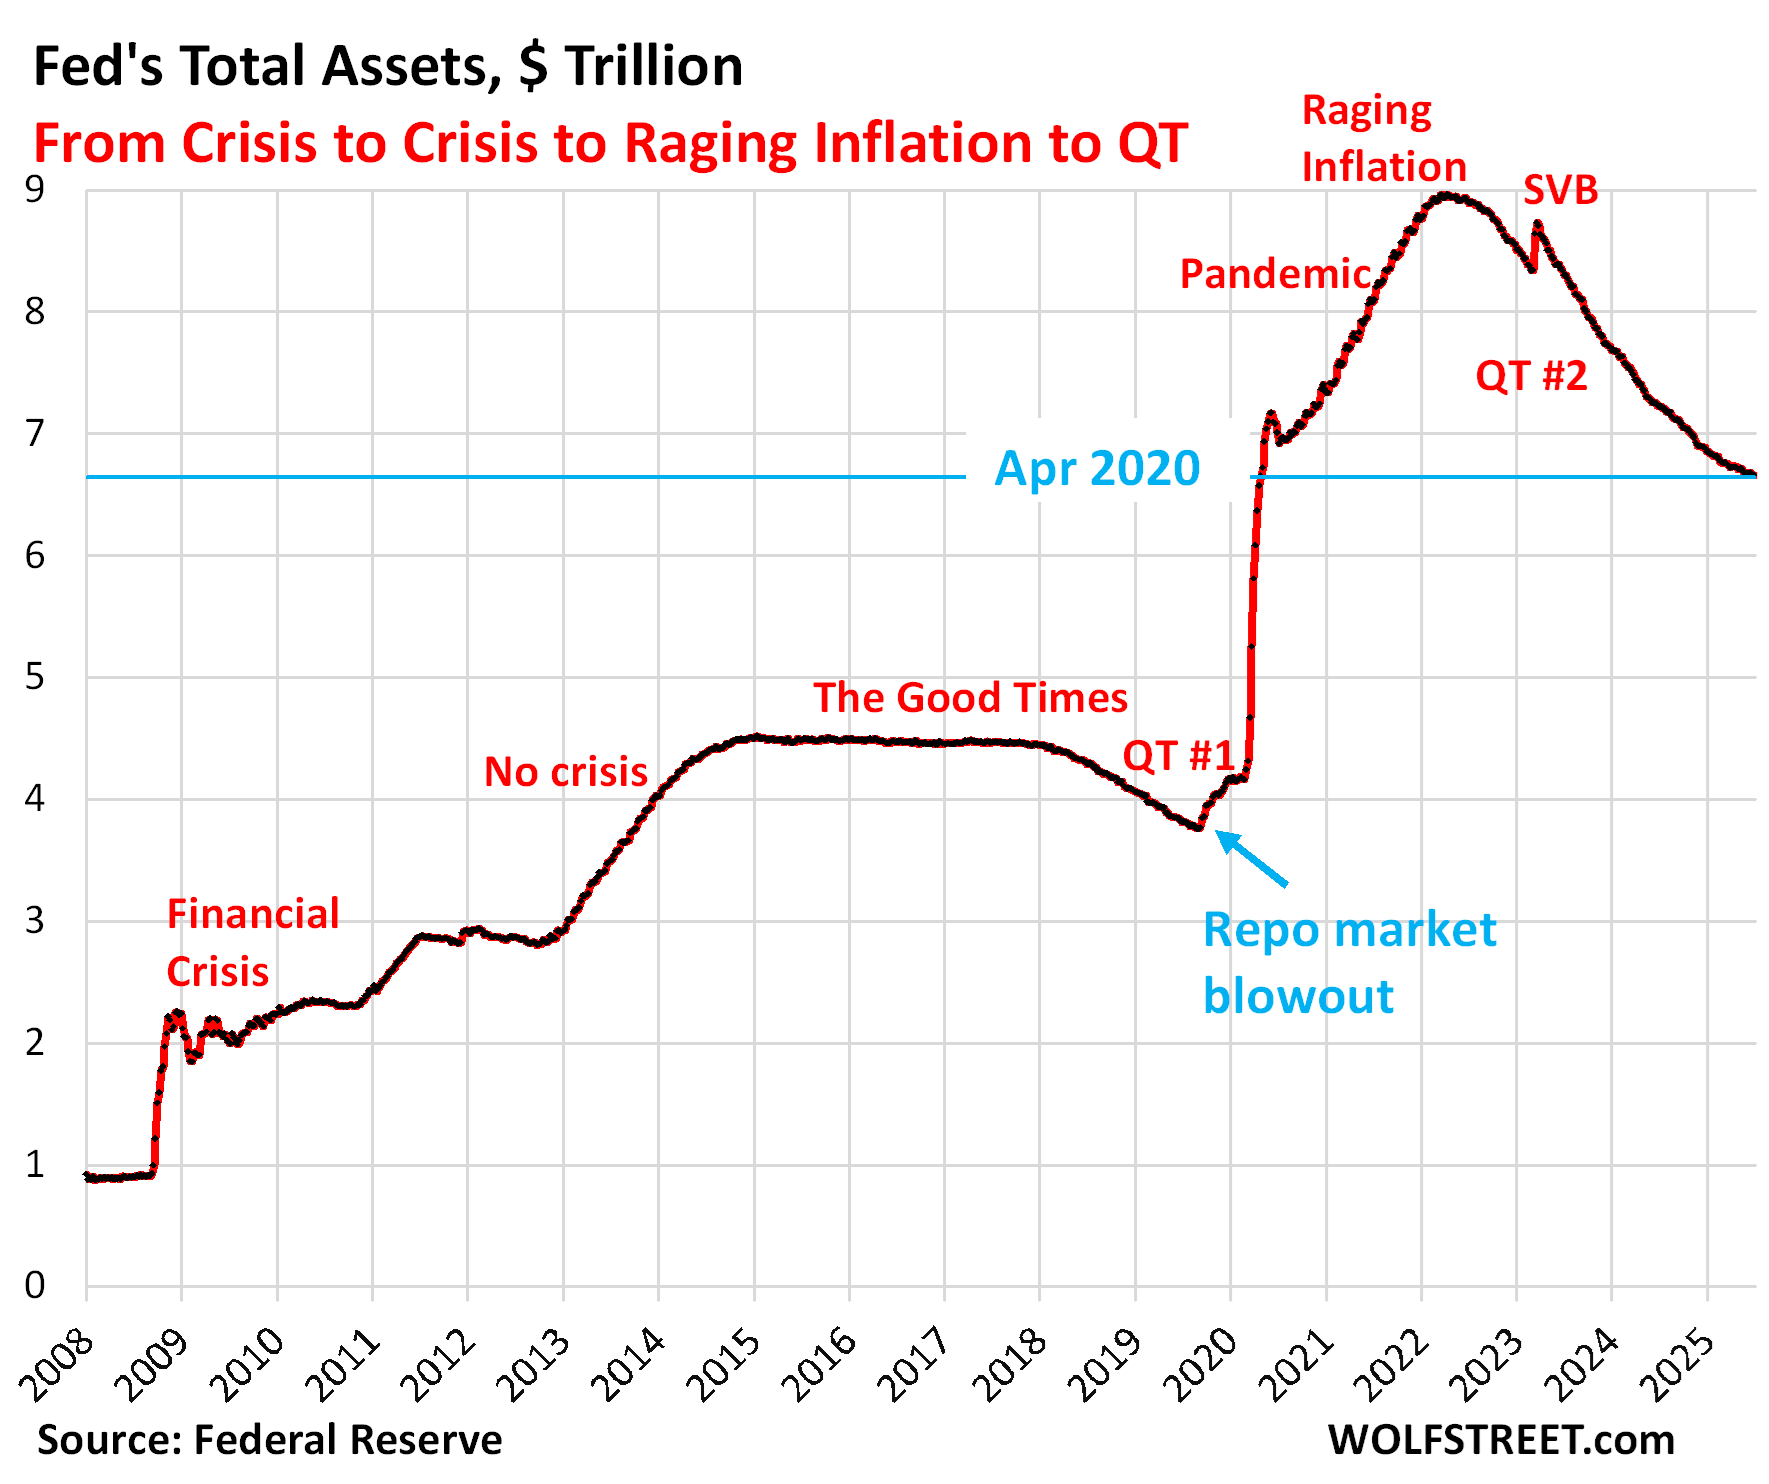
Total assets on the Fed’s balance sheet declined by $13 billion in June, to $6.66 trillion, the lowest since April 2020, according to the Fed’s weekly balance sheet today. Since peak-balance sheet at the end of QE in April 2022, the Fed’s QT has shed $2.31 trillion, or 25.7% of its total assets.
This completes the third year of official QT, and nothing has imploded yet, outside of a few regional banks in 2023. QT kicked off officially in June 2022 amid a massive surge of inflation. But the balance sheet had already started to decline in April, and by the end of May was already down $50 billion.
In terms of Pandemic-era QE, the Fed has shed 48.0% of $4.81 trillion in assets it had piled on from March 2020 through April 2022.
QT assets.
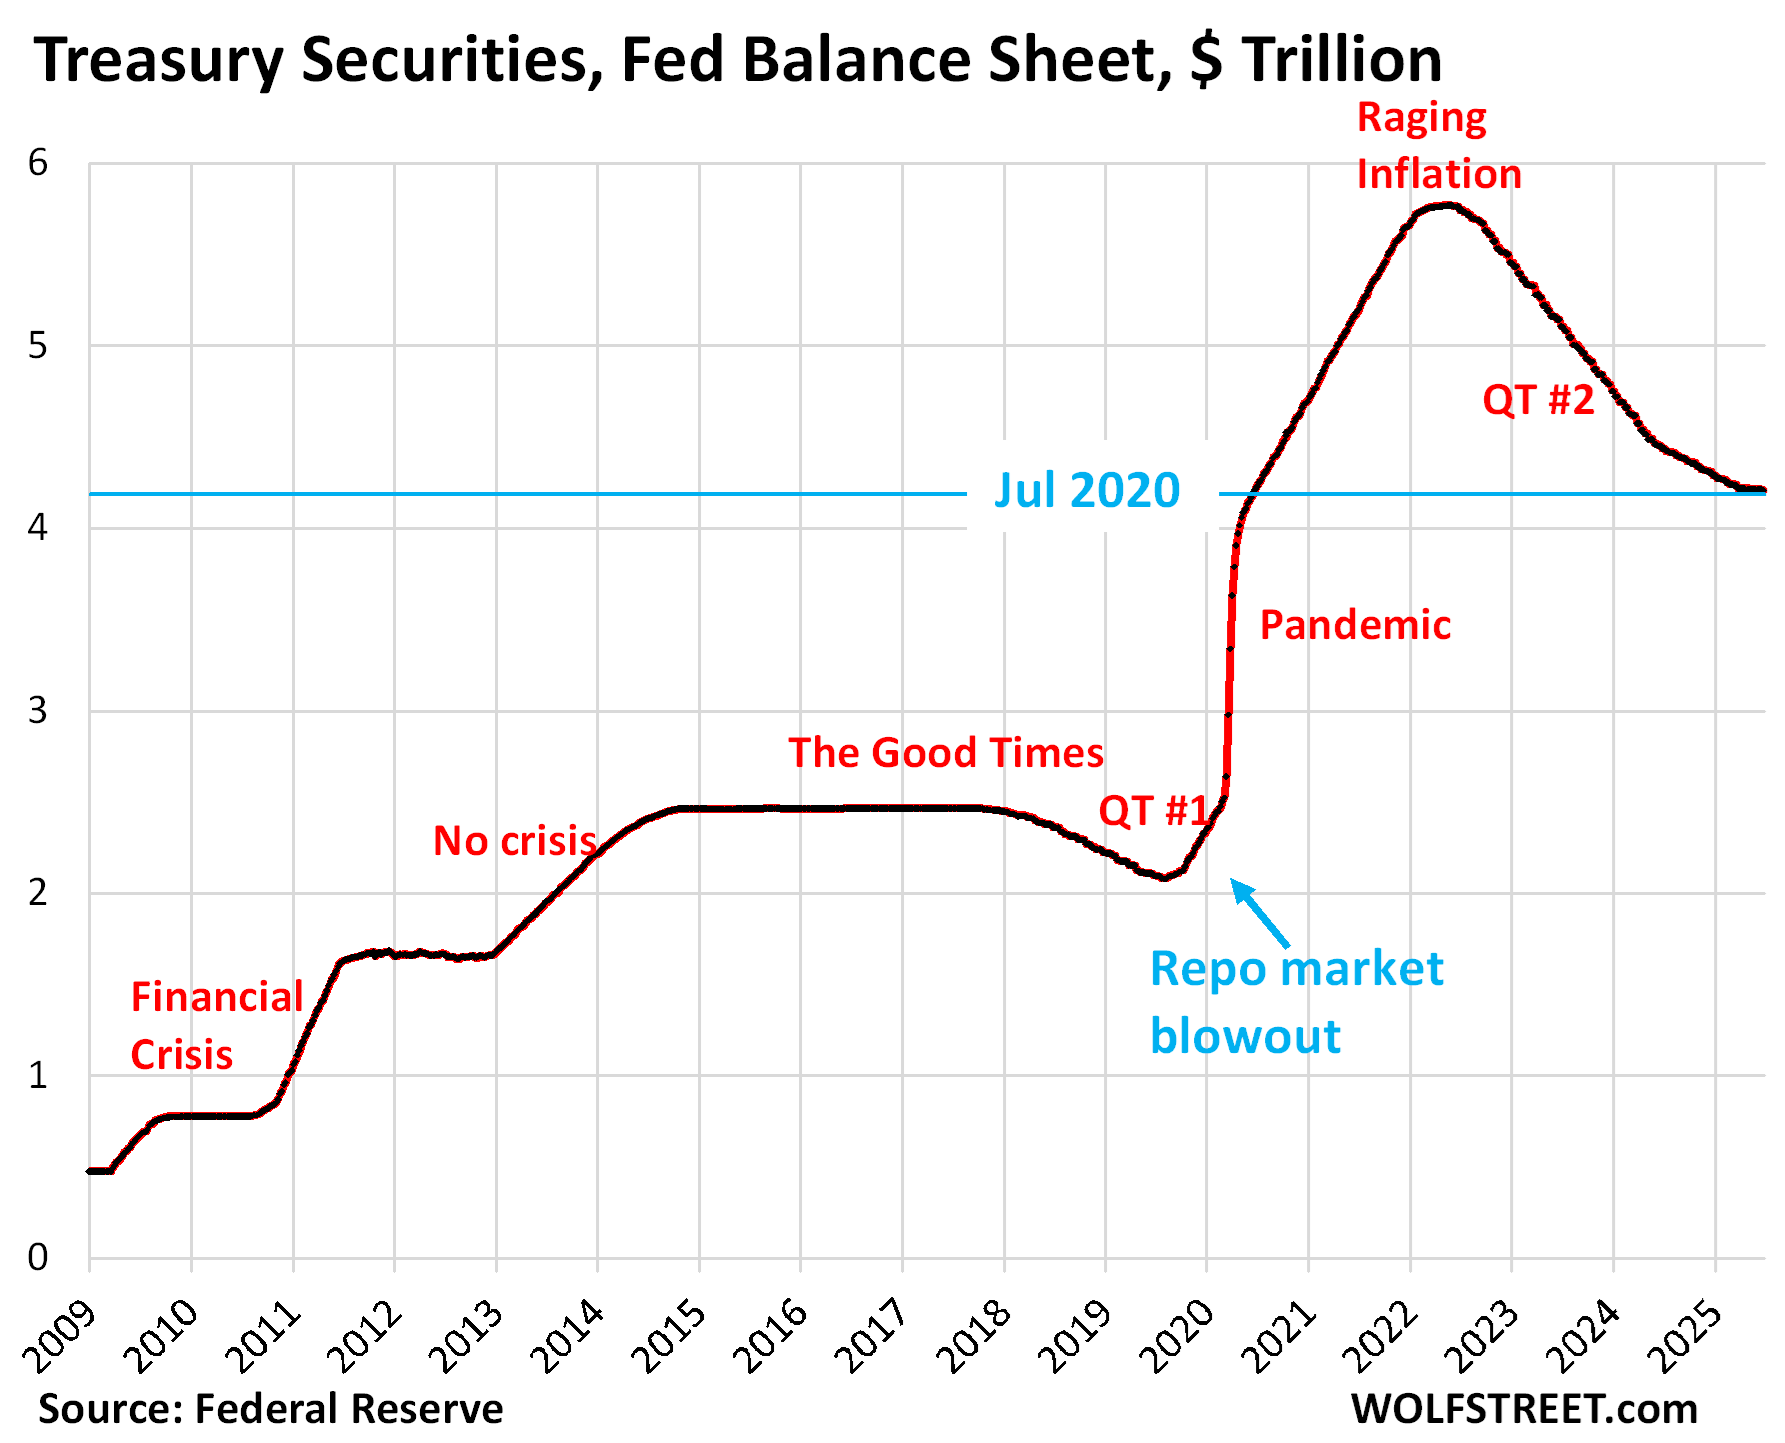
Treasury securities: -$3.8 billion in June, -$1.56 trillion from peak in June 2022 (-27.0%), to $4.21 trillion, the lowest since July 2020.
During pandemic QE, the Fed had piled on $3.27 trillion in Treasury securities. It has now shed 47.7% of that.
The Fed recently slowed the Treasury part of QT to just $5 billion a month. Included in the Fed’s Treasury holdings are $428 billion of Treasury Inflation Protected Securities (TIPS), of which $112 billion is inflation protection that TIPS holders receive and that is added to the TIPS balance to be paid when the TIPS mature. So the Fed’s TIPS balance grows with the inflation protection. In June, the Fed received $1.2 billion in inflation protection, which was added to the TIPS balance, which had the effect of reducing the roughly $5 billion in Treasury roll-off to $3.8 billion.
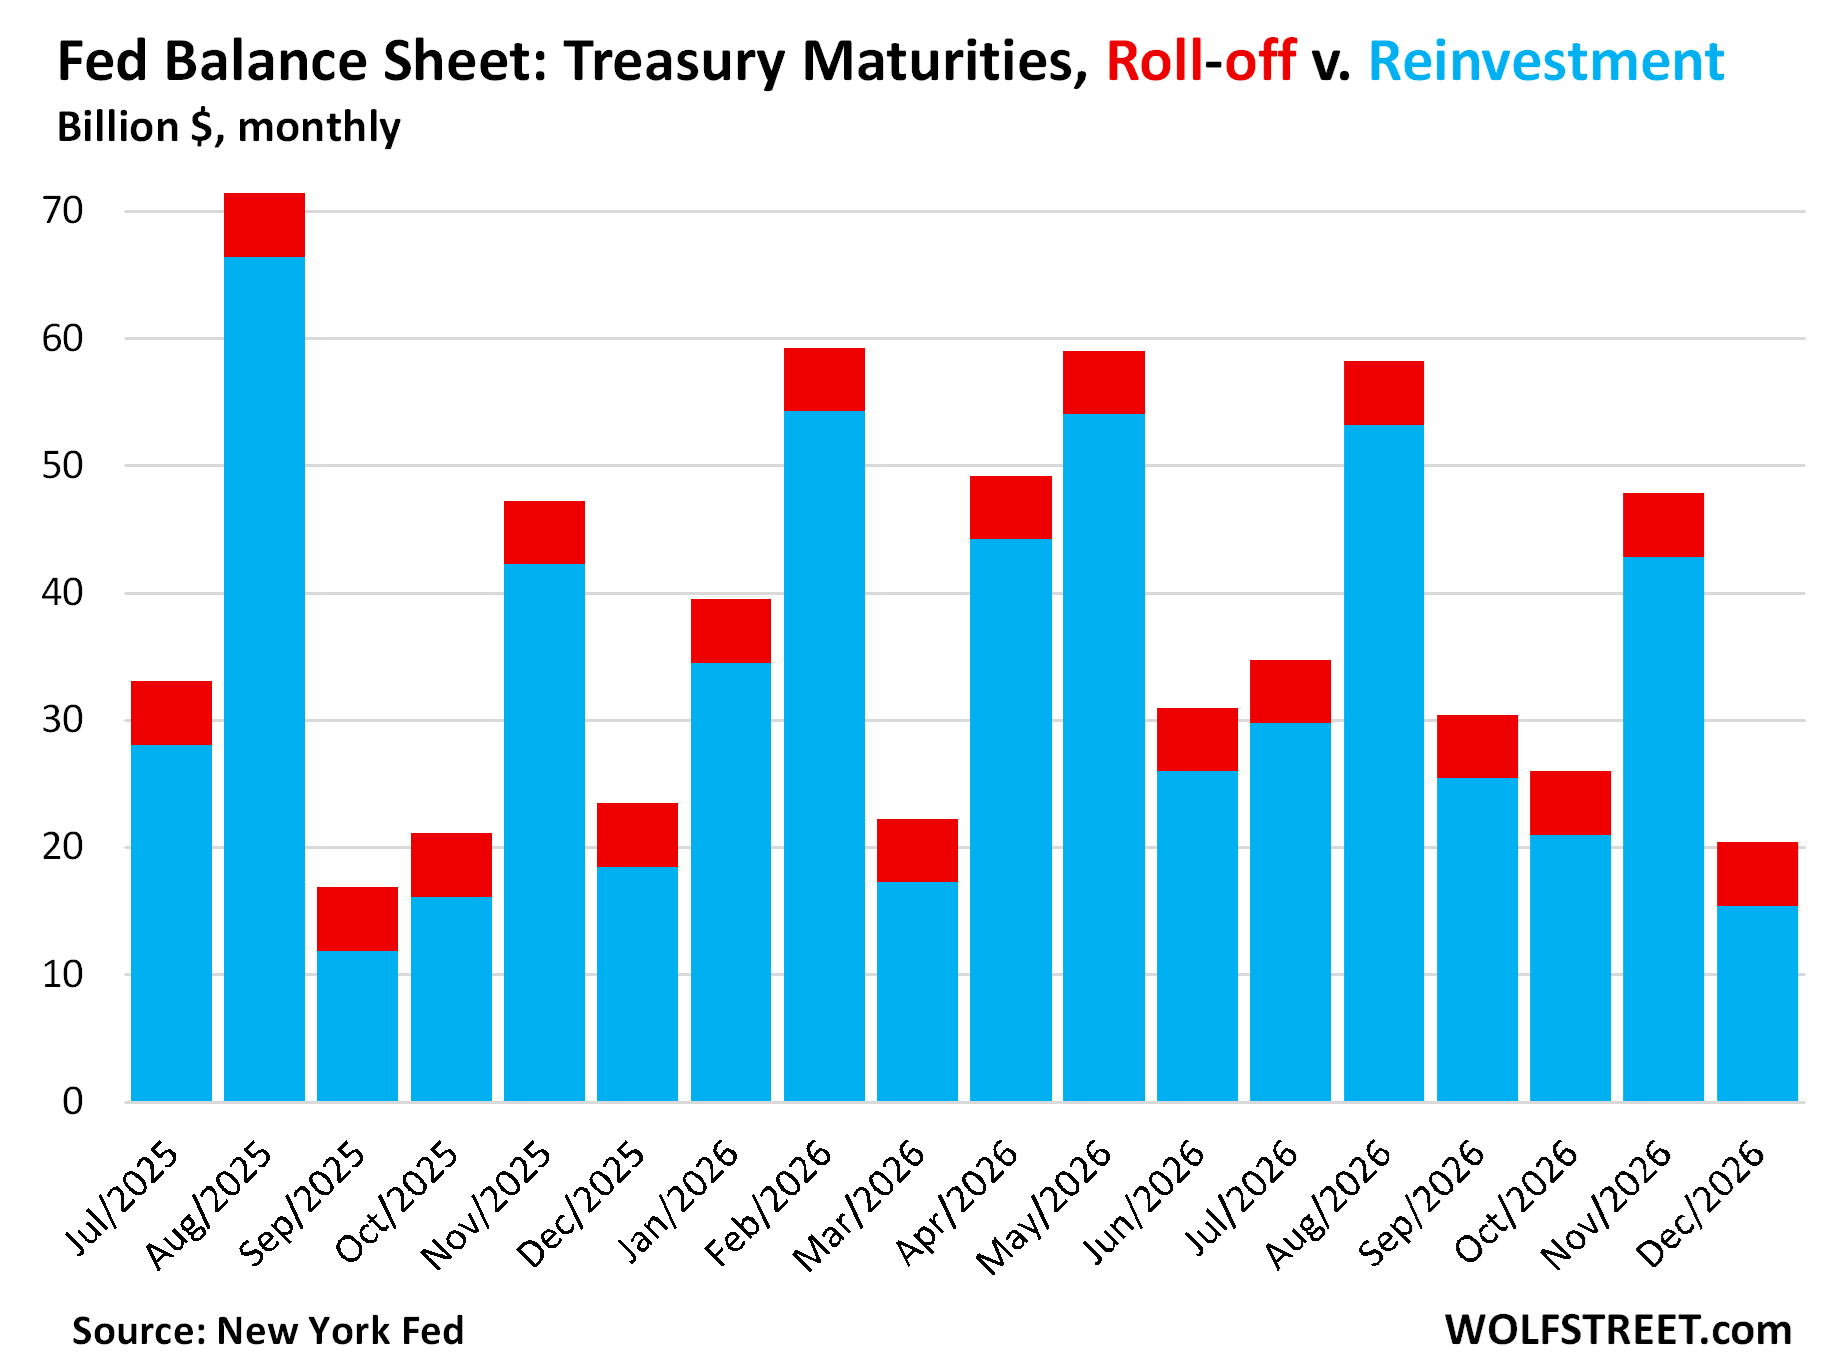
Treasury maturities, reinvestment, and roll-off.
Treasury notes (2- to 10-year) and Treasury bonds (20- & 30-year) mature mid-month and at the end of the month, and the Fed gets paid face value. The amounts vary widely from month to month.
If the Fed doesn’t do anything, its Treasury holdings will shrink by the amounts of those maturities each month.
To limit the monthly shrinkage of its holdings – and thereby the liquidity drain on the financial markets – it reinvests a portion of the proceeds into new securities that it buys at Treasury auctions.
The remainder “rolls off” the balance sheet and reduces the balance sheet. As of April, the roll-off has been lowered to $5 billion a month (red in the chart below). The remaining amounts of the maturing securities each month are re-invested in new securities.
So…
In July, $33 billion in Treasuries will mature. The Fed will reinvest $28 billion by buying new Treasuries at auction; and it will allow $5 billion to “roll off” the balance sheet.
In August, $71 billion will mature. The Fed will reinvest $66 billion and allow $5 billion to “roll off.”
In September, $17 billion will mature. The Fed will reinvest $12 billion and allow $5 billion to “roll off.” Etc. etc.
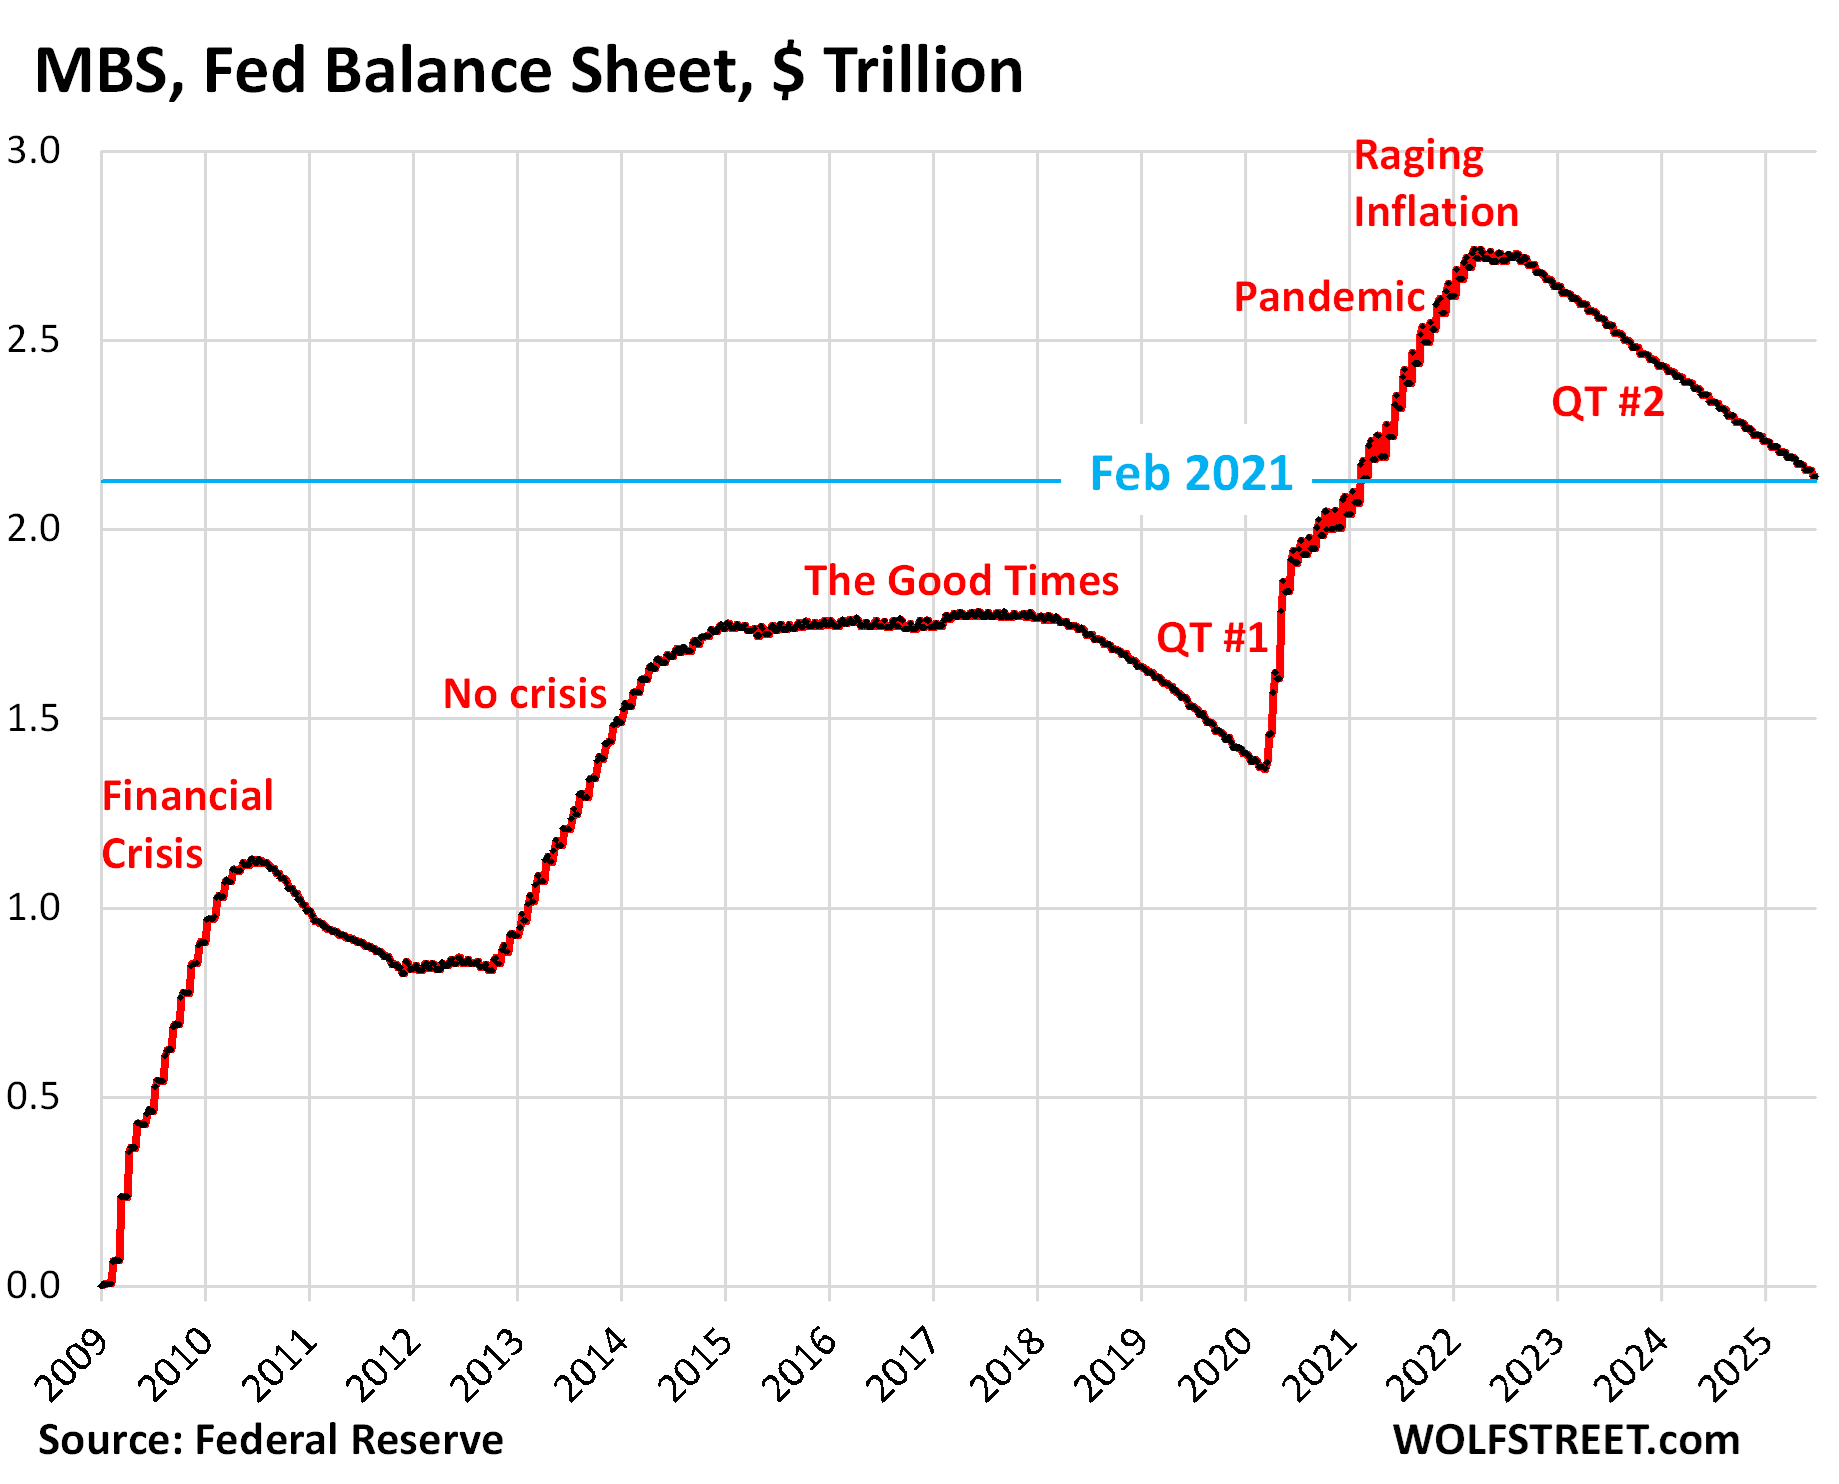
Mortgage-Backed Securities (MBS): -$17.7 billion in June, -$602 billion from the peak, to $2.14 trillion, where they’d first been in February 2021.
The Fed has shed 22.0% of its MBS since the peak in April 2022, and 43.8% of the $1.37 trillion in MBS that it had added during pandemic QE.
The Fed holds only “agency” MBS that are guaranteed by the government, where the taxpayer would eat the losses when borrowers default on mortgages.
MBS come off the balance sheet primarily via pass-through principal payments that holders receive when mortgages are paid off (mortgaged homes are sold, mortgages are refinanced) and as mortgage payments are made. But sales of existing homes have plunged and mortgage refinancing has collapsed, and far fewer mortgages got paid off, and passthrough principal payments to MBS holders have slowed to a trickle. As a result, MBS have come off the Fed’s balance sheet at a pace that has been mostly in the range of $14-18 billion a month.
The pace of the MBS reduction is not limited by the Fed. If pass-through principal payments were to become a torrent again during a refi boom, the Fed would re-invest any pass-through principal payments above $35 billion a month in Treasury securities, and total QT would reach $40 billion a month, the theoretical maximum under the current QT regime.
Bank liquidity facilities:
The Fed has three bank liquidity facilities. There was little activity in June. The Fed has been exhorting banks to start practicing using these facilities with “small value exercises,” or at least get set up to use them, and pre-position collateral so that they could use them quickly.
- Central Bank Liquidity Swaps ($37 million)
- Standing Repo Facility, or SRF ($0 million).
- Discount Window: $6.4 billion, up by $3.5 billion from a month ago. A year ago, it was at the same level. During the SVB panic, it had spiked to $153 billion.
The SRF swung into action on June 30 for one day. The weekly balance sheet presents the Fed’s holdings as of the close of business on Wednesday. The balance sheet is then published on Thursday afternoon. On today’s balance sheet, reflecting Wednesday July 2, the balance of the SRF was zero.
On June 30, at the end of the quarter, the SRF was active for one day and had an overnight balance of $11 billion. Those repos matured the next day and were unwound, and by the end of the day, the balance was back zero. On Wednesday July 2, the day of the Fed’s weekly balance sheet, the balance was also zero.
The Fed has been urging approved banks to use the SRF and has worked on improving it, including by adding a morning auction as of June 26 just in the nick of time for the quarter-end, in addition to the classic afternoon auction. The idea is that banks can draw on the SRF and then lend the proceeds to the regular repo markets when liquidity pressures push up repo rates above the Fed’s minimum bid rate (currently 4.5%), to profit from the spread.
And this apparently happened at the end of the quarter for one day. The daily SRF data from the New York Fed shows this action: $11 billion for one day on June 30.
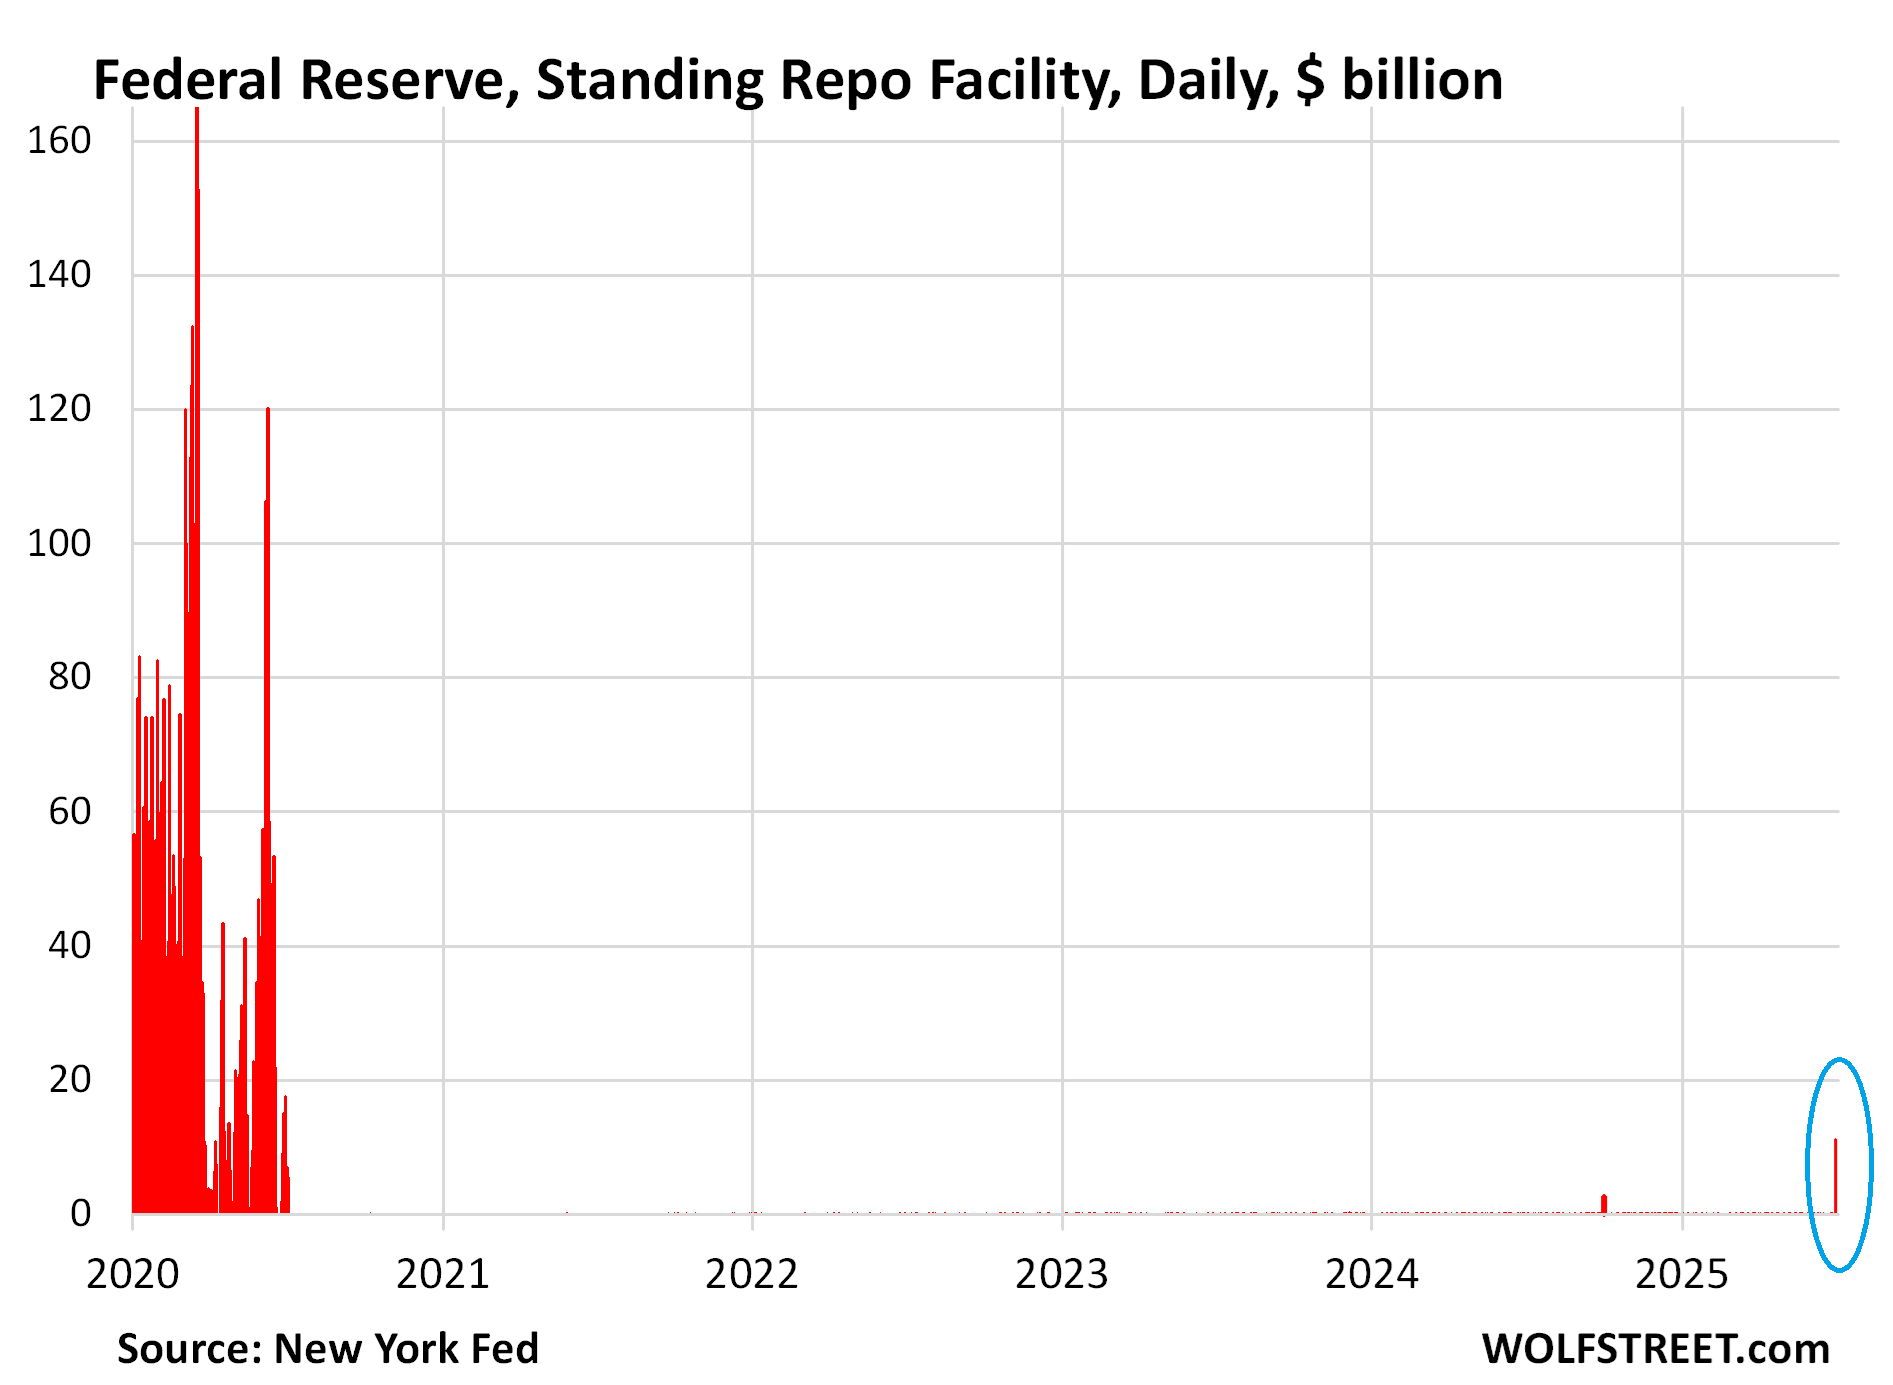
The SRF was revived in July 2021, after Bernanke had killed it in 2009, and is designed to avoid another repo market blowout, like the one in the fall of 2019, when repo market yields exploded 10% as banks refused to lend to the repo market. To calm it down, the Fed then ended up undoing a big part of the 2017-2019 QT. This taught the Fed a lesson, and now it has the SRF to avoid that fate.
Enjoy reading WOLF STREET and want to support it? You can donate. I appreciate it immensely. Click on the mug to find out how:

![]()
Perhaps dumb question but how does the recent debt ceiling increase play into the picture? I assume not much as demand seems high for treasuries and if not just would mean higher yields.
https://wolfstreet.com/2025/05/11/how-the-debt-ceiling-is-now-pouring-liquidity-into-financial-markets-only-to-suck-it-back-out-very-fast-later-this-year/
Thanks!
So… we all live happily everafter???
CNBC
4 Hours Ago
‘As Ethereum powers Wall Street’s future, the Cannes buzz shows how far it’s come’
So the answer is no.
Zingier than a 1/4 of July firework. Thanks for the belly laugh.
I also have a dumb question about the graphical inference that both the plan for the expenditure and the actual expenditure of funds occurred simultaneously. Shifting the actual perpetrator of the broadside against the budget from Trump to the hapless, Biden’s reign.
An increase of 3T from 4 to $7 T is breathtaking. Spawning a multitude of obnoxious billionaires.
Wolf, are treasury interest payments offsetting QT? Yes, the Feb balance sheet is decreasing, but does that translate into pure liquidity draining or do other factors offset it, like treasury interest payments or other?
Also, any ideas why the ON RRPO balance has slowly been growing over the last several months? Was declining consistently but has a slight upwards trend in recent months that I don’t understand.
1. “are treasury interest payments offsetting QT?”
No, the Fed destroys the cash it receives from interest payments (the Fed doesn’t have a “cash” account; instead it creates cash to pay for something and destroys cash when it gets paid).
But TIPS pay interest PLUS inflation protection. The Fed destroys the interest, but the inflation protection is added to the principal and not paid in cash, so the Fed cannot destroy it until it receives it when the TIPS mature.
In mid-July, $8 billion in TIPS mature and the Fed gets paid the $8 billion plus the added $2.8 billion in inflation protection as part of the redemption (total nearly $11 billion). In theory, Treasury QT should then be over $6 billion ($5 billion in QT, minus ca $1.3 billion in inflation protection from other TIPS, plus redemption of $2.8 billion in inflation protection). But I’m not sure how the Fed will actually deal with it. That’ll be in my next balance sheet report on Thursday, August 7.
2. “why the ON RRPO balance has slowly been growing over the last several months”
Read this:
https://wolfstreet.com/2025/05/11/how-the-debt-ceiling-is-now-pouring-liquidity-into-financial-markets-only-to-suck-it-back-out-very-fast-later-this-year/
All these years I thought the Fed keeps the interest & sends it to the Treasury.
Also… I read both articles. And re-read them. Your just going to have accept some of your loyal followers are not to bright.
The Doctor dropped me on my head when I was a baby…or something like that.
1. The Fed cannot keep the interest because it doesn’t have a cash account.
2. It didn’t send the Treasury any interest. It sent (“remitted”) its “operating profit,” which is a lot less than the interest.
3. Remember, the Fed doesn’t have a cash account. It destroys money that it receives and creates money that it pays, routinely. So it destroys the interest when it receives it. And when it comes time to pay the Treasury its operating profit, the Fed in turn creates that money (it just credits that amount to the TGA* account).
Central-bank accounting is really weird due to the lack of a cash account.
*TGA = Treasury General Account, the government’s checking account at the New York Fed, which is a liability on the Fed’s balance sheet.
Federal Reserve balance sheet erosion of actual value due to inflation. 2% of $6.66 trillion dollars is $133.2 billion per year or $11.1 billion per month not compounded.
So, the Fed has taken 3 years to reduce their massive balance sheet by a measly 25%. My bet is that they are far more likely to hit $10 trillion before they ever get it down to $1 trillion. And those “regional bank failures” in 2023 were some of the largest in US history, and resulted in the US govt essentially guarantees all bank deposits. But no worries there. Our bankrupt Uncle Sam can always borrow more money.
Well, it’s never going down to a trillion again because it can’t – Wolf has explained this. However, you are correct, “up like a rocket, down like a feather” is the FED’s modus operandi. It’s disgusting, quite frankly. They’re disgusting.
While I agree with your outrage, I’m also a fellow passenger with zero ability to change things by myself. Worse than that I depend on all the other people agreeing about the structure of our society. And I tend toward being anti-social, not liking my fellow travelers enough.
Whether a social Democracy, which I argue we have generally been, or an authoritarian aristocracy.
The Fed’s assets cannot ever get back to “$1 trillion.” The Fed’s assets ALWAYS grew before QE with cash in circulation (liability on the Fed’s balance sheet). A balance sheet has to balance: assets = liabilities + capital. ALWAYS. As the Fed’s liabilities grow, it’s assets HAVE to grow.
The Fed NOW has five big liabilities. Three of them are demand-based and the Fed doesn’t control that demand. Only the first two — reserves and ON RRPs — are a reaction to QE/QT;
1. Reserves (cash that banks deposit at the Fed). Always must have a substantial balance, see below.
2. Overnight reverse repurchase agreements (ON RRPs) with domestic counterparties (cash from money market funds and other domestic entities). That can and will go to near zero.
3. Currency in circulation (paper dollars in pockets and under mattresses globally) – demand based, as you step up to the ATM, you want the ATM to have the paper dollars that you want to withdraw.
4. Treasury General Account (TGA), the government’s checking account. Demand based. That balance is decided by the US government. Before 2009, it was with JP Morgan and other banks, but during the Financial Crisis, it was moved to the New York Fed. So that instantly increased the Fed’s balance sheet.
5. Reverse repurchase agreements with foreign official counterparties. Where they park their dollar cash. Demand based.
Please read this:
https://wolfstreet.com/2024/03/23/the-feds-liabilities-how-far-can-qt-go-whats-the-lowest-possible-level-of-the-balance-sheet-without-blowing-stuff-up/
Reserves CANNOT go to zero because those are the banks’ account balances at the Fed with which they pay each other trillions of dollars every day in transactions. When you buy stocks through your broker, that cash you pay to settle the purchase goes through the banks’ reserve accounts, even if your broker is not a bank. When a big merger closes and $500 billion in cash are paid, that $500 billion goes through the reserve accounts, from one bank to the other bank. Given the trillions of dollars a day in banking transactions, the reserve balances will always be significant, but they can be a lot lower than today. That’s what QT can accomplish.
25% from peak in three years is quite impressive. They have completely undone MBS holdings under Biden.
@wolf – any insight on why MBS exploded 2013 – 2015 under Obama?
“any insight on why MBS exploded 2013 – 2015 under Obama?”
They didn’t. They exploded from zero to trillions in 2009-2014. QE ended in Dec 2014. QT started in 2017, and MBS began shrinking.
Your MBS chart shows QT beginning sometime in 2020, right?
Typo? Do you mean “QE”? MBS continued to decline until the beginning of March 2020 — that’s what the MBS chart shows. In Mach 2020, the Fed kicked off pandemic QE and the MBS balance spiked.
The balance sheet is now down to what probably shoulda/coulda/woulda been the post pandemic peak, that created the wild excesses that (probably) drove the first wave of inflation to the crest.
At the current pace, the unwinding of the 12 year MBS experiment will be completely unwound in a total of approximately… 12 years?
The next wave of inflation will be the continuous erosion of confidence in any type of fiscal responsibility, as evidenced by a complete lack of concern for a balanced budget, let alone overall debt reduction (or even leveling for that matter?).
Which will happen more quickly? Inflating away my purchasing power or the government debt? Rhetorical question.
I think Powell and the Federal Reserve Board policies have been correct during the unwinding of the world wide, not just domestic, QE craze.
IMO, the only sure thing is the short term treasury. They are likely to cut a quarter pct in September, as telegraphed. The long terms are just as likely to drop in price as increase in coordination with the decrease in the FFR.
The long term is a leveraged bet whereby being wrong can decimate a portfolio. Since we’re talking about the cessation of QE. People invested in long term treasuries lost 45 + % when the free market doubled the expected interest rate. Just saying.
I’m probably full of the stuff that makes the grass grow green.
Is this a bad event? Does it represent a liquidity concern with the banks? I’m confused by the number of times it shows up on your last chart. The previous times were during crunches.
If you are convinced, like I am, that QE is a terrible and destructive policy, then the SRF (last chart) is a good thing. That’s how the Fed used to deal with crises, such as 9-11, before QE.
Repos are overnight and unwind the next day. If they’re not renewed, they vanish automatically and don’t cling to the balance sheet for years and decades, like long-term Treasuries do.
So if there is a liquidity squeeze somewhere, the banks can borrow at the SRF, supply liquidity to the squeezed area where rates are high, and make money off the spread. When the liquidity squeeze is over, the SRF goes back to zero.
The Fed should have never done QE. It should have just kept the SRF active and let it resolve on a temporary basis the urgent problem.
During 9-11, the stock market, the bond market, and other markets shut down for days, and that was a huge issue, and the Fed’s SRF supplied lots of liquidity, and after three weeks, it was all resolved, and nothing clung to the balance sheet. That’s how crises are supposed to be handled.
I’m glad to see the SRF back in operation. It tells me that the Fed is looking for ways to permanently get away from QE and go back in a modified version to how it used to do things before QE.
Nice, well said. Which brings home the philosophy:
” It tells me that the Fed is looking for ways to permanently get away from QE and go back in a modified version to how it used to do things before QE.”
Me too.
Trump wants QE again, I think. Thankfully he save two billion small farmers in Iowa.
If Trump doesn’t watch out, he’s going to get inflation out the wazoo. Just about everything this administration and Congress are doing is inflationary. Americans HATE inflation and are very unforgiving about inflation, as we have seen with Carter and Biden. So good luck restarting QE and low interest rates.
QT seems to be indirectly nibbling away at the overall personal savings rate — which dovetails with tariff-induced uncertainty, which is obviously slowly unfolding — and hovering like a dark cloud on the distant horizon.
That environmental backdrop, is metaphorically (meteorologically) similar to seasonal hurricane forecasting.
Obviously, a ton of people with beach homes, sprinkled along coastal areas — make an ongoing generational bet, that a hurricane won’t totally obliterate their investment — but, in taking that bet, most people turn to insurance coverage — because like Russian roulette — people win and lose.
Where was I?
The point being, there are ongoing churning dynamics that can result in future probable impacts — and even though it may seem patriotic to deny that a hurricane is headed to Florida this year — the probability suggests being prepared for the reality of risk, is wise!
I think a problem in predicting inflation or tariff or QT or hurricane dynamics — is that more and more people are becoming complacent and tuning the subject of risk completely out — then absurdly, betting the farm on unlikely outcomes. FOMO & YOLO remain the dominate narrative and it’s the foundational framework for unbridled greed — probably because the Fed has nurtured a culture of risk-taking — and rewarding failure through QE.
Overall, the management of QT has been carefully implemented and policies tweaked for decades — but I’m not exactly confident that a new Fed chair next year, will continue with measured constraint — if anything, QE clouds are forming — and imho, there’s a string of perfect storms brewing.
Also see:
In the “Joker War” storyline, the Joker takes over Wayne Enterprises, uses Bruce Wayne’s money to create a Joker Army, and plunges Gotham into chaos.
Free Market Capitalism is way too hard to understand for 90% of the population.
But we have regulated capitalism as my junior year in high school history teacher in 1970 explained to us.
Free Market Capitalism is unknown since it happened so long ago there is little recorded reference to it. The rest of human history is some aristocracy or group of oligarch capitalists.
“1750BCE.”
“The oldest written customer complaint is the “Complaint tablet to Ea-nasir” and is 3767 years old, acquired by the British Museum (UK) in London, UK, in 1953.
The tablet was discovered in the ancient city of Ur (southern Iraq). The tablet describes the complaint to the merchant, named Ea-Nasir, from a customer, named Nanni. The complaint is in relation to the wrong grade of copper being delivered to Nanni and suggests the feud between buyer and seller had been going on for a long time.”
Reference: Guinnessworldrecords.com.
The early 1900s Sherman Act and Clayton Act, know as the US Anti-Trust Laws, were written to prevent such a heinous thing as unbridled capitalism from ever happening again, but they totally failed to be enforced and now we have a situation far worse than back then.
That reminds me: not long ago a shipment of large raw copper ingots turned out to be rocks painted with a copper coloured paint. The victim was I believe chasing an insurance co about it but don’t know status.
Ea-nasir had joined a recently bankrupt copper company (any fault could not be determined because there were too many people involved in the supply chain, the smelting, and any changes made in transport because the route was unknown) with a lobbyist in the court of Ur.
Feud was easily settled in favor of plaintiff….it’s in a tablet that was broken or lost and likely went back to the Ur clay mixing works.
Nanni passed the low quality copper on poorer merchants or end users as was customary…he WAS good at sales.
(just my speculation, obviously, based on many years interacting with businessmen and the government they run.)
It is purposely designed to produce generations of dummies especially financially illiterate dummies. Feds handled crisis differently because 9-11 isn’t a result of irrational even hysterical behavior by consumers. 2008 was not just home buyers but also realtors who played major role if not more to inflate the home price for more commission. QE wasn’t to resolve the issue but to bandit the issue. By design? Perfect opportunity to “kill” rivalry isn’t pure conspiracy. History will tell. Printing paper $$ during pandemic was nothing new but continuation of bandit “crisis”. Only solution is educated public for @ least one generation to reverse the damage, situation of which obviously will not happen. Look @ when dept of education started & then look @ when most kids (later on adult consumers) become so financially dumb. When Feds policies are enacted to deal with a market condition that is caused by irrational consumer m/o on steroids is when you know this is the beginning. QE is not the right strategy in every aspect except from political view & politics by default never is rational.
Loan Originators also played a huge role in 2008-no doc loans, “stated income loans”, giving FHA loans to real estate investors, giving loans to people based on pro-forma “I think you’ll make $X dollars 5 years from now- let’s go with that”.
It’s incredible how all these years later poor people still get blamed for the crisis though!
Always easiest to punch down….learned that by age 4 or 5.
Total bank reserves are essentially flat for the last 13 months. That’s indicative of a tight money policy. If you were targeting N-gDp you’d ease policy rates in September when long-term money flows peak.
There are countervailing forces acting on the economy. The supply shock in oil has kept prices down.
“reserve balances have become steadily more evenly distributed”
“Larger banks hold fewer reserves per unit of asset compared to smaller banks.”
https://www.richmondfed.org/publications/research/economic_brief/2025/eb_25-18
Bank reserves should become increasingly more important in their role.
Oil is less than 5% of the global economy and increasingly irrelevant as many sources of energy are utilized.
Did u here about the Big Beautiful Budget? All Fed incentives for wind and solar gone. It’s ‘drill baby drill’.
The US is already drowning in oil, and many frackers are under major financial strain and likely to go out of business.
And most of the rest of the global economy is using oii. Even trolling.
Out (of) damned spot.
In the U.S. consumers spend an average of .0257 of their income on gasoline. I guess the pundits should stop publishing “core” inflation.
Gasoline is only one component of energy. Of course natural gas and electricity are also fairly abundant and cheap for many of us.
However, energy is also an input into almost everything, and often at multiple levels and places.
I live in a geographically isolated area with relatively high consumption (Colorado mountains/ tourist destination).
I try to remind folks that there’s nothing “green” (in the environmental/ energy sense) about this neighborhood.
I have had people complain about the sprinter van we use for rides around town, being a large diesel powered vehicle, and how “excessive” it is. This, while the owner flies their private jet to and from their large, mostly unoccupied home here.
The amount of diesel it takes to get TP and cereal here is ridiculous.
I have 100 US dollars that I’m willing to bet that the Fed will reduce the FFR by 25 bpts in September. They have already said that’s what they are planning on doing.;
No. The Federal Reserve did not say at all that they were going to cut the FFR by 25 bpts in September.
Even if they do, rates will go up.
Despite QT stocks, crypto, real estate, bonds, precious metals, and of course treasuries – are all still bubble territory – where would the 10y yield be without the Fed controlling the long end rates? The government is going to need a whole lot more money soon. Where will it come from? Who would take out a new loan at the current short term rate to buy long term government debt? Who would sell their bubble assets, incur capital gains taxes and buy government debt? This is one big mess.
The Federal Reserve NEVER ‘controlled’ long term interest rates. Where did you ever come up with the notion that it did?
Where do you think long term interest rates would be at without QE?
The very same as they are now.
The Fed bought treasuries on the open market to the tune of several trillion dollars, thereby lowering their yield. Other long-term loan interest rates are based on the “risk-free” treasury rates and trend lower as a consequence. That’s how QE was intended to stimulate the economy, when a Fed funds rate close to zero did not have the desired effect.
What about operation twist?
Nothing at all to that.
Well, things certainly didn’t work out that way at all, did they?
Buying TRILLIONS in MBSs affects long rates
I understand what you said until I came to the reasoning behind not selling overpriced assets for fear of paying a pittance to the muck who it all possible.
“In July, $33 billion in Treasuries will mature. The Fed will reinvest $28 billion by buying new Treasuries at auction; and it will allow $5 billion to “roll off” the balance sheet.”
Is this reinvestment a miniature form of Quantitative Easing? Is it a semantic argument, i.e., a matter of degree where massive purchase of new Treasuries by the Fed is QE, whereas small amounts is a normal operating procedure? Thanks.
Why does this nonsense keep getting posted here? QE = INCREASE OF SECURITIES HOLDINGS for the purpose of pushing up reserves. The Fed’s securities holdings are DECREASING = QT.
Not trolling you Wolf, it’s just a fact that QT has been slowed drastically and IMO unnecessarily especially when viewed alongside the provisions of the BBB.
$13B in QT is wholly inadequate. So bad in fact I’m beginning to favor sales of MBS from the balance sheet.
QT was $36 billion in May, it was $13 billion in June. It will be close to $30 billion in July.
That would be QT where the Federal Reserve owns LESS not more, but the $33 billion amount is entirely trivial in a market where there is a total of $37 TRILLION outstanding in US Treasuries.
It’s complicated, IMO. The Fed could crash the public markets by imposing an onerous QT regime. Or they can finesse it, as I, think they have wisely chosen to do.
QE was destructive in the ways that your complaint doesn’t even touch upon.
Whatever name you want to call it… in my opinion, not allowing 100% of treasuries that mature to roll off is harmful interference and should not be happening as it is suppressing rates on newly issued treasuries.
QE should have never been done in the first place.
Oh so let the markets break?
Great Depression 2.0.
lol that’s absurd
sufferinsucatash,
You’re just ignorant of how the Fed used to handle crises. During 9-11 when markets DID break — the stock and bond markets, and many other markets, were shut down for days because the infrastructure to handle trades was destroyed — the Fed handled this with a huge and sudden injection of liquidity via repos (SRF). When the crisis was over after a few weeks the repos matured and come off the balance sheet. Nothing clung to the balance sheet. And the dotcom bust continued, which would eventually take down the Nasdaq by 78%.
Repos is the classic way to inject liquidity. This can be supplement with purchases of 1-6 month T-bills, that then mature and come off the balance sheet.
QE was the purchase of long-dated securities that stick to the balance sheet for years and decades and distort markets for years and decades. That was experimental monetary policy, and it led to the biggest most absurd asset bubbles ever and finally lots of consumer price inflation. QE should be buried and stay buried.
Kinda semi related:
The dollar increased in value by about 33% since QE started in November 2008.
Wait —- that’s not fair, I’ll do pandemic era….
The Federal Reserve’s post-pandemic quantitative easing (QE) program, often referred to as QE4, began in March 2020.
The Federal Reserve began implementing quantitative tightening (QT) in June 2022.
The dollar gained approx 4.45% during that round of QE.
By comparison, QT from June, 2022 to 4th of July 2025 — Dollar has declined 4.68%
Seems like a wash, but who knew? The bigger picture actually tells the more revealing reality, of the GFC crash and ongoing buildup of the deficit — behind the Quantitative Magic and the ongoing game of pushing the deficit higher.
Ultimately, the wet foam being sprayed on GDP is debt — and even though the Fed is kinda tamping down their balance sheet — the Treasury is a perpetual volcano of nonstop lava that’s flowing faster than ever.
The phrase “increased in value,” is deceptively undefined.
Is this compared to other currencies, the S&P, gold, BTC, RE, or broccoli?
My dollars have NOT increased by 33% in “value” (although I probably don’t have any “2008” dollars left?) since 2008.
$1 put into the S&P at that time is 6-8+ times more valuable, but I can’t see a direct correlation to any increased “value” of “33%.”
CPI has increased 50%. I believe these are the fundamental problems with the constituency (as addressed above), lack of financial education/ knowledge in an increasingly financialized society and culture.
I am a “victim” of this phenomenon and am trying (for the sake of my children?!?) to right this wrong.
Re: Is this compared to other currencies, the S&P, gold, BTC, RE, or broccoli?
The USD value is an index that has a fluctuating price, based on daily trading — it can be measured against anything, including broccoli.
There’s no undefined deception in that relationship between time and price — it’s just a pure fact as to how mkt value of USD changes.
Your dollars are changing in purchasing power every day — which is why stable currencies are an important function in investing.
The current administration wants a lower dollar value — but I don’t want my purchasing power to decline — so I’m shopping around and planning ahead.
In the bigger picture, the growing deficit is likely to decrease the value of the dollar, because of inflationary forces.
Right… but the DXY is NOT up 33% from Nov. 2008 until today.
Nov. 2008: High: $88.46 Low: 83.9
A 33% increase from the low is $111.58, last seen Oct. 2022 (although it was close in Jan 2025 peak).
I understand currency fluctuates, and I also understand how to read the DXY chart, published daily.
Wolf,
Perhaps I’m missing something, but it seems to me that the relationship between Q(E/T) and inflation isn’t as straightforward as it might appear.
The Fed has implemented several rounds of QE, and when that liquidity was directed at (and ended up) in banks, QE didn’t seem to have much of an impact on inflation. It could be that banks simply sat on the extra liquidity. The same might happen—or is likely to happen—during the reverse process of QT.
However, when QE assets were directed to the U.S. government, the extra liquidity wasn’t just sitting there. The funds were distributed directly to us in the form of checks, and that liquidity influx certainly fueled inflation.
So, it seems to me that what really matters might not just be Q(E/T), but rather what happens to the extra liquidity once it’s injected into the system.
I’d love to hear your thoughts on this.
What do you mean by ‘QE assets’ you claim were ‘directed at the US government?’ Do you understand that all QE involved was the Federal Reserve purchasing existing US Treasuries from the books of banks who then put the purchase proceeds in their Excess Reserves accounts inside the Federal Reserve which ballooned to more than $3.5 trillion?
Firstly, if you haven’t noticed, all money from the Fed goes to the banking system. That is the way it works.
As far as QE goes that is Trump’s wet dream. Which tells us a little bit about who he will replace the non=compliant Powell with one of his sycophants, willing to grovel for a buck.
The best example is the current speaker of the house.
This is probably a naive way of looking at it, but we still have 2 more years of MBS QT before we’ve (inflation adjusted) undone all the terrible horrible inflationary MBS QE that happened since 2019.
The economy is doing OK, but where would we be if we had reversed all the pandemic QE and kept the debt to GDP ration constant? We need continual stimulus to avoid recession.
Better to look at nominal GDP adjusted amounts.
Nominal GDP I believe is a better way to get an idea of where the balance sheet should be.
Regardless the June 30 standing repo activity combined with recent debt ceiling increase make me think qt ends soon.
Wolf,
I am a bit confused by your Standing Repo Facility chart that seems to show a lot of activity in 2020, despite the SRF not being revived until July 2021.
Overall, the Fed has done a decent job as a central bank, and even though the pandemic resulted in crazy QE — the QT process has been like watching paint dry — and that controlled management has been smooth.
On the other hand, Treasury and administrative policies in the last five years are absolutely insane — and this recent budget, including a highly deceptive and manipulated Doge effort to fu d fraud and abuse was nothing short of pathetically stupid.
The efforts of the Fed to balance QE and QT look like actual competence and expertise — compared to the incompetence and circus-like idiocy of where we are now, with an expanding deficit and greater servicing costs — which will continue to grow like cancer.
It’s mind blowing that vast majority of people that support this stupidity have no idea what’s going on!!!!!!!
For the fiscal year through May 2025, the U.S. Treasury paid $776 billion in interest expense on the national debt. The average interest rate on this debt was 3.294%. Servicing costs next year, over $1 trillion and trump and bessent are geniuses…
Interest payments are projected to be the fastest-growing part of the federal budget in the coming years.
Looking at interest payments in a vacuum is goofball material. You need to look at interest payments in terms of what the government has to pay them with (tax receipts):
https://wolfstreet.com/2025/05/29/us-government-interest-payments-to-tax-receipts-average-interest-rate-on-the-debt-and-debt-to-gdp-ratio-in-q1-2025/
Just thinking out loud here, would interest payments as a % of GDP be a good measure? I’m thinking of % of tax receipts as a percentage of what we’re actually willing or able to tax, while % of GDP would be as a percentage of what we theoretically could tax.
But when I posted it last time (through Q4 2024), people complained (with some justification), so I didn’t post it in Q1, LOL
Last chart:
https://wolfstreet.com/2025/03/27/us-government-fiscal-mess-debt-deficit-interest-payments-and-tax-receipts-q4-2024-update-on-an-ugly-situation/
Thank you. Looks like the 80s was the worst because of high interest rates and high spending on military spending to bankrupt the USSR, but the rate of rise in the past few years is scary.
Hopefully our leaders get it under control before it passes 5%.
“The Senior Financial Officer Survey (SFOS, 2023), asks both about a firm’s lowest comfortable level of reserves (LCLoR), its tolerance for fluctuations around that level, and its preference for holding reserves above that level”
When filling the TGA, we will watch the EFFR ratio to the remuneration rate.
https://www.clevelandfed.org/publications/economic-commentary/2025/ec-202505-qt-ample-reserves-changing-fed-balance-sheet
Speculators traded a record $6.6 trillion worth of stock in the first half of 2025 which is more than $25 TRILLION a year of stocks being ‘traded’
Don’t forget options
The mutual fund companies don’t trade much, they represent a huge part of the stock market ownership
If true that would be about half the net worth of the SP500…….I wonder at what point there would be a liquidity crunch?
“Looking at interest payments in a vacuum is goofball material. You need to look at interest payments in terms of what the government has to pay them with (tax receipts)”
Lord in Heaven I love this site lol
Thank you Wolf!
Is this the month you do BOJ? :)
Yes, thanks for reminding me. That slipped through my fingers last week. Done.
https://wolfstreet.com/2025/07/07/bank-of-japan-balance-sheet-qt-%c2%a512-trillion-in-q2-%c2%a539-trillion-from-peak-to-%c2%a5717-trillion-sold-nearly-all-its-bank-stocks/
Arigatou sensei!
Doumo arigatou gozaimashita,
I have been very disappointed with the Buffett Indicator as a way to look at mkt valuations — I find the overall concept instructive, in that, aggregate total mkt value in relation to overall GDP — is a great way to look at general economic conditions. It’s rare for a corporation to sustainably outperform the aggregate GDP rate.
Nonetheless, I enjoyed the lesson in this thread about not looking at interest on the debt in a vacuum — suffering another whack on the head from the master.
After pondering that painful lesson, I jettisoned the Buffett Indicator —- and thought in terms of a checkbook, or more specifically a debt to income ratio, commonly used for renters, home buyers, loans and ways to balance debt versus income.
That resulted in using Fred to build a ratio of total mkt equity value — in relation to federal debt and tax receipts.
Probably another hallucination — but it captures dotcom bubble, GFC and the double top unfolding now. It seems obvious, mkts highly overvalued and deficit expanding rapidly. The question is, does the bond mkt blow up first — or will equities collapse?
Households; Corporate Equities and Mutual Fund Shares; Asset, Market Value Levels/(Federal Debt: Total Public Debt / Federal government current tax receipts/1000)
Wolf:
Now that the debt ceiling has been raised and the TGA can return to a normalized level over the next quarter. Do you think the Fed has any desire to increase the rate of QT from treasury security roll off from $5B/month. Given the ample banking reserves, the Fed should have more latitude to more aggressively pursue QT.
Waller was just talking about the future of the balance sheet. He sounded like he had AI summarize my article from March 2024, convert it from article format with charts to speech format, and ran with it. He even came up with the same lowest level: $5.8 trillion, and used the same math to get there.
Here is my article, subtitled: “No one knows, not even Fed, but here is our guess: $5.8 trillion, limited by the liabilities.”
https://wolfstreet.com/2024/03/23/the-feds-liabilities-how-far-can-qt-go-whats-the-lowest-possible-level-of-the-balance-sheet-without-blowing-stuff-up/
Here is his speech:
https://www.federalreserve.gov/newsevents/speech/waller20250710a.htm
Amazing! Waller’s mentioning a $5.8 trillion lower limit was the first time I heard it mentioned by a Fed official. So this was new.
What was not new, but more important:
He talked about how to change QT and the balance sheet composition. It did not include anything about speeding up the Treasury QT, but he said a lot about speeding up MBS QT (by selling them outright). So that’s on the table. If they decide to sell enough MBS to bring the total roll-off to the $35 billion a month cap that is currently in place, it would speed up overall QT from about $20 billion a month to $40 billion a month.
And he talked about replacing a big pile of long-term notes and bonds with T-bills, including by selling them outright to speed up that process. This is a reverse of operation twist.
Those things have been discussed before by Logan and Waller — so that’s something they’re still talking about. I expect Logan to give another speech about it, and eventually we should see something about that in the minutes, followed by an announcement in the FOMC statement.