US year-over-year home-price gain shrinks to +0.4%. Prices drop YoY in 18 of the 33 metros: San Diego, Austin, Tampa, Miami, San Francisco, San Antonio, Dallas, Phoenix, Orlando, Atlanta, Denver, Raleigh, Houston, Seattle… YoY gains nearly vanish in Los Angeles, San Jose, Charlotte, shrink in Boston, Chicago, New York, Columbus…
By Wolf Richter for WOLF STREET.
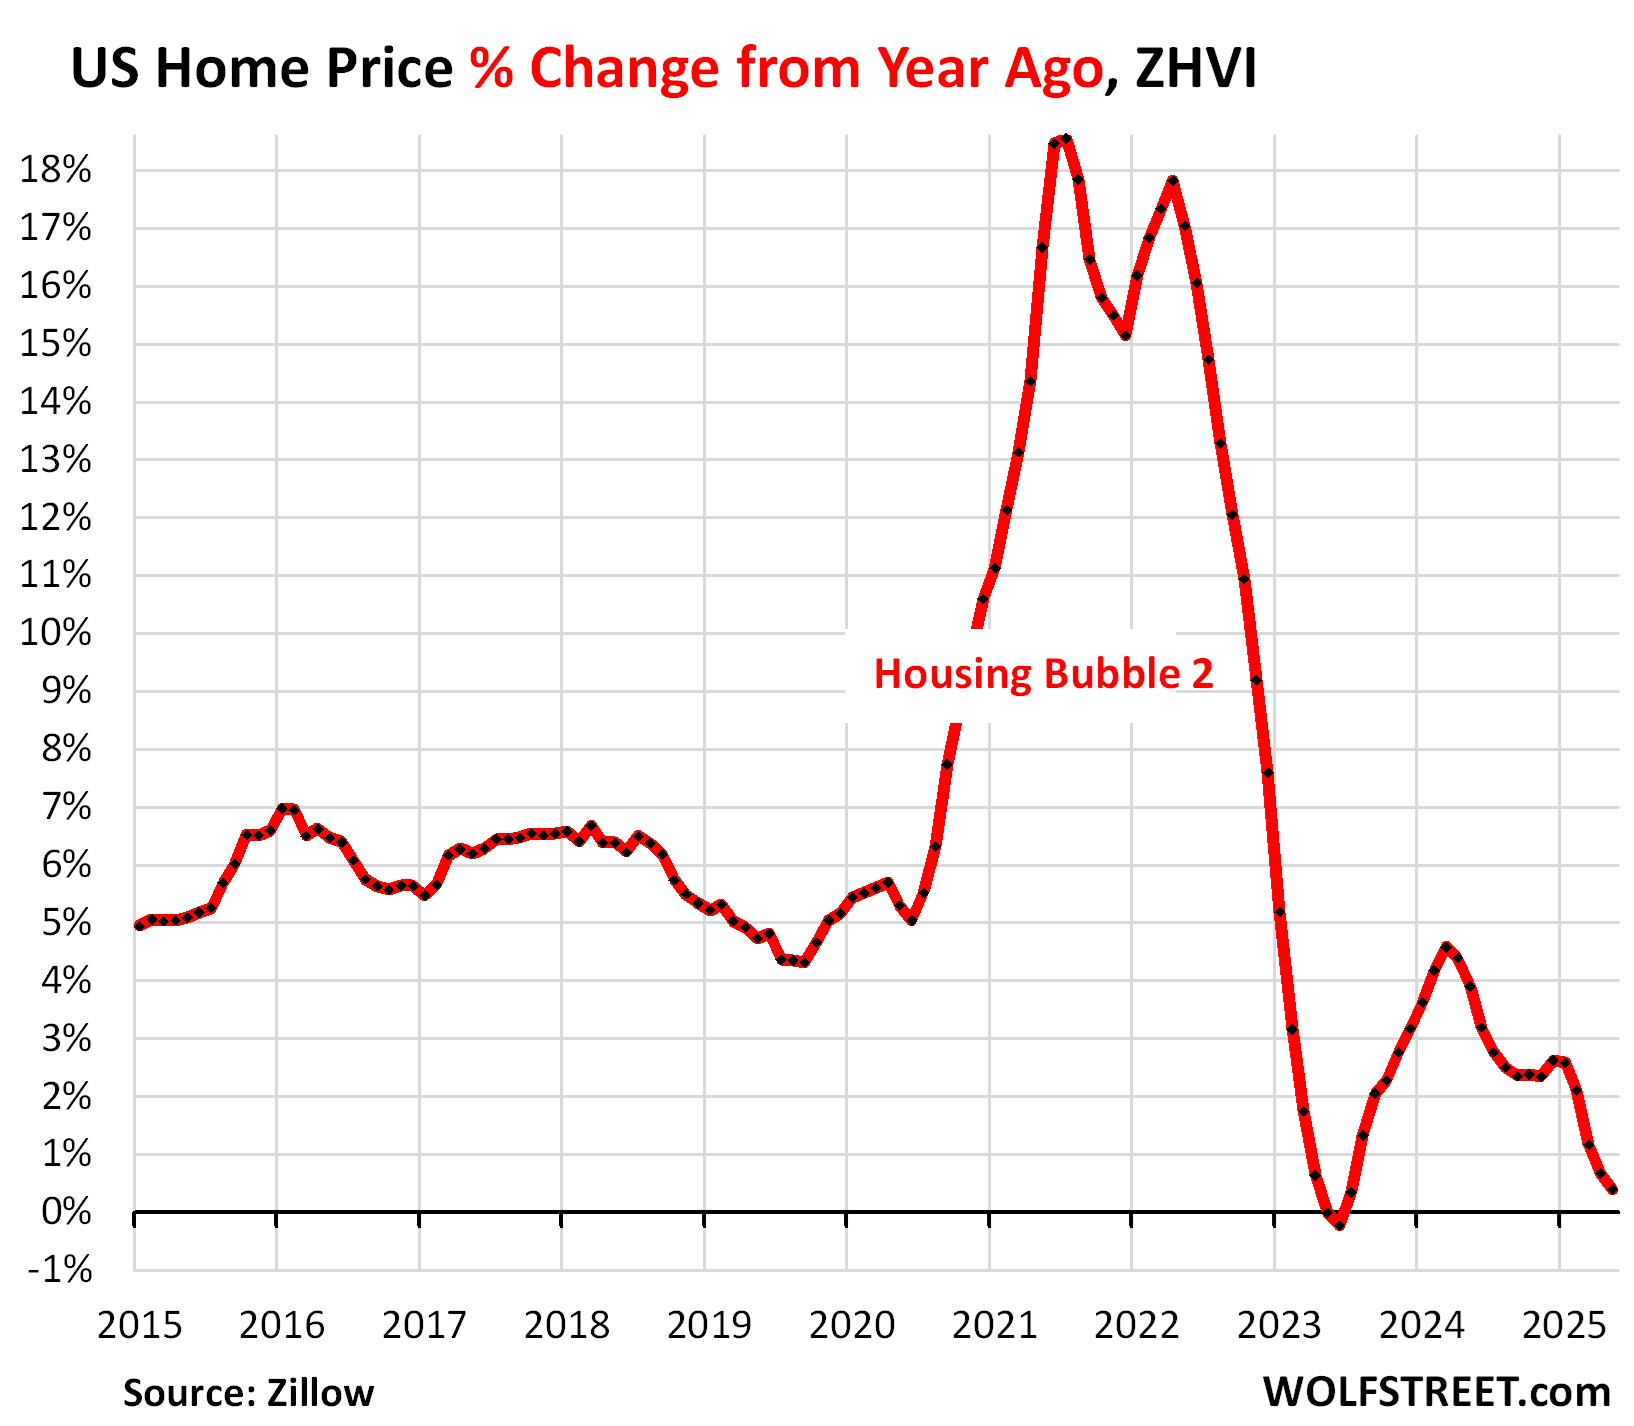
Prices of mid-tier single-family homes, condos, and co-ops in the US whittled down their year-over-year gains further, to just +0.4% in May.
The “spring selling season” is normally when not-seasonally-adjusted US home prices rise on a month-to-month basis, after the declines in the winter, and in aggregate, they did so this spring, but less than normally: In May, they ticked up just 0.6% from April, compared to +0.8% in May 2024, +1.3% in May 2023, +2.0% in May 2022, and +2.6% in May 2021. A similar pattern of below-normal price increases played out in prior months.
In terms of the large expensive 33 Metropolitan Statistical Areas (MSAs) that we track here, 18 showed year-over-year price declines in May, up from 6 at the end of 2024, and those year-over-year price declines worsened from prior months. Even in San Diego, the year-over-year decline worsened to -1.9% in May, from -0.9% in April, as prices dipped month-to-month while inventory ballooned because demand has withered.
All data here is from the “raw” not seasonally adjusted mid-tier Zillow Home Value Index (ZHVI), released today. The ZHVI is based on millions of data points in Zillow’s “Database of All Homes,” including from public records (tax data), MLS, brokerages, local Realtor Associations, real-estate agents, and households across the US. It includes pricing data for off-market deals and for-sale-by-owner deals. Zillow’s Database of All Homes also has sales-pairs data.
To qualify for this list, the MSA must be one of the largest by population and must have had a ZHVI of at least $300,000 at some point.
Some metros that are large enough don’t qualify for this list because their ZHVI has never reached $300,000, despite the massive surge of home prices in recent years, such as the metros of New Orleans, Oklahoma City, Tulsa, Cincinnati, and Pittsburgh.
The growing list of year-over-year price declines.
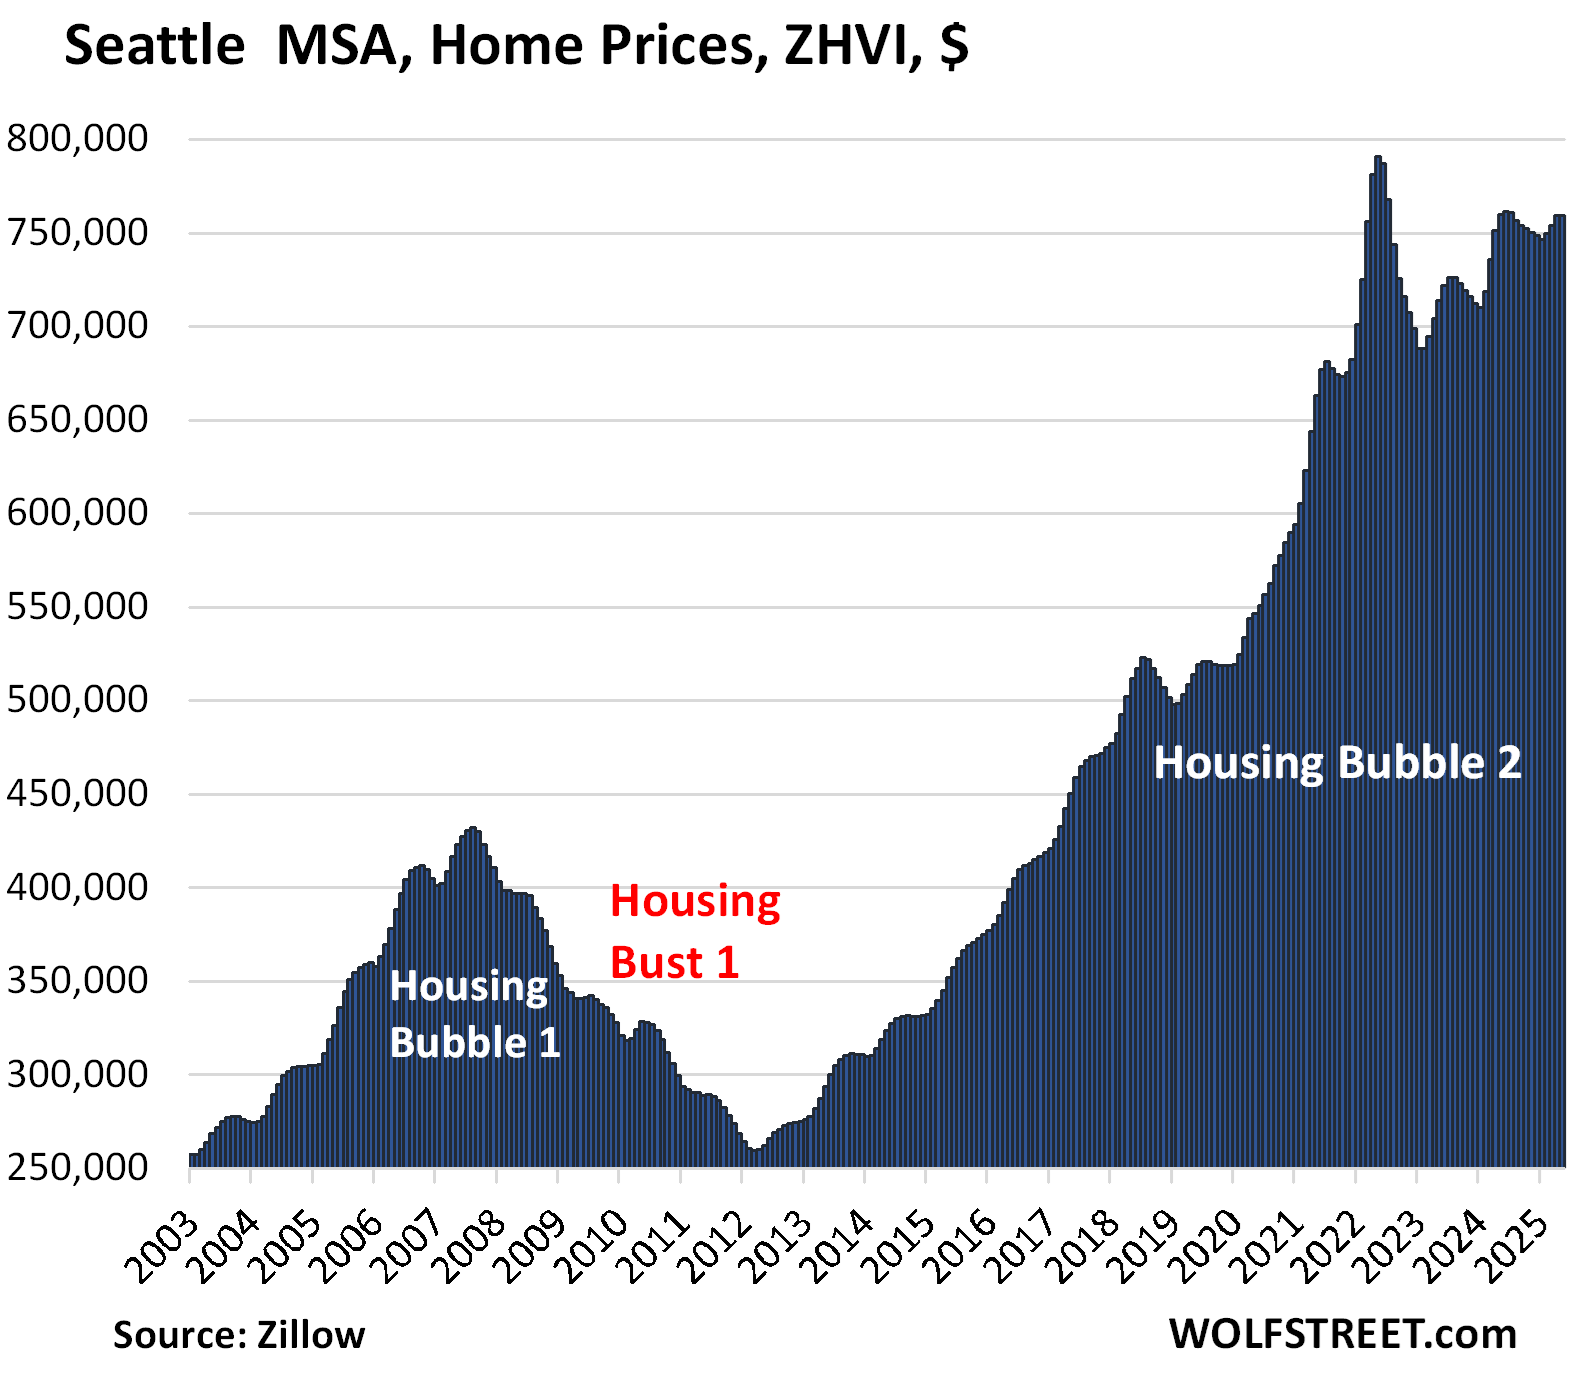
In May, the list of year-over-year decliners got a new member, Seattle. In total, of the 33 MSAs here, 18 show year-over-year declines, up from 6 at the end of 2024. In all of those 18 metros, the year-over-year declines worsened.
Year-over-year declines in May:
- Austin: -5.5%
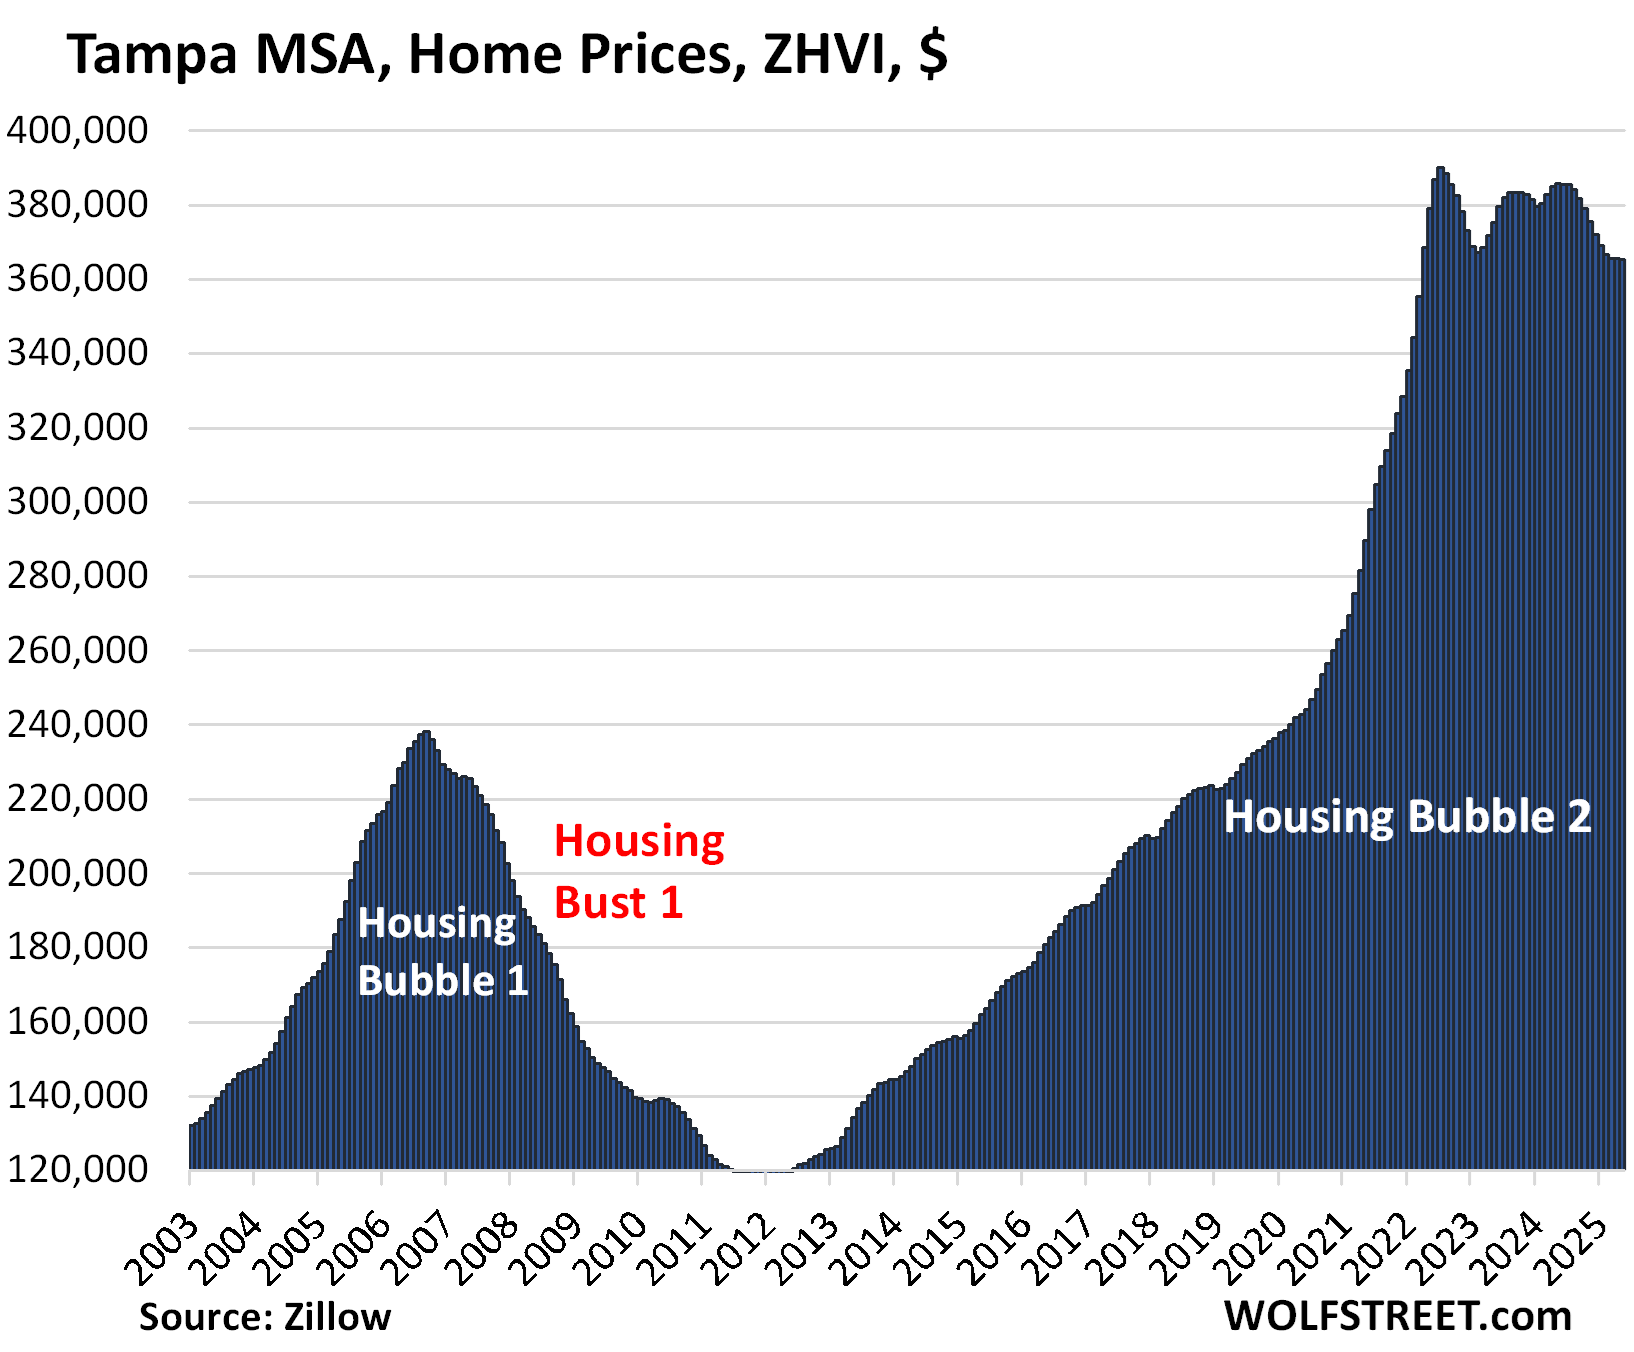
- Tampa: -5.5%
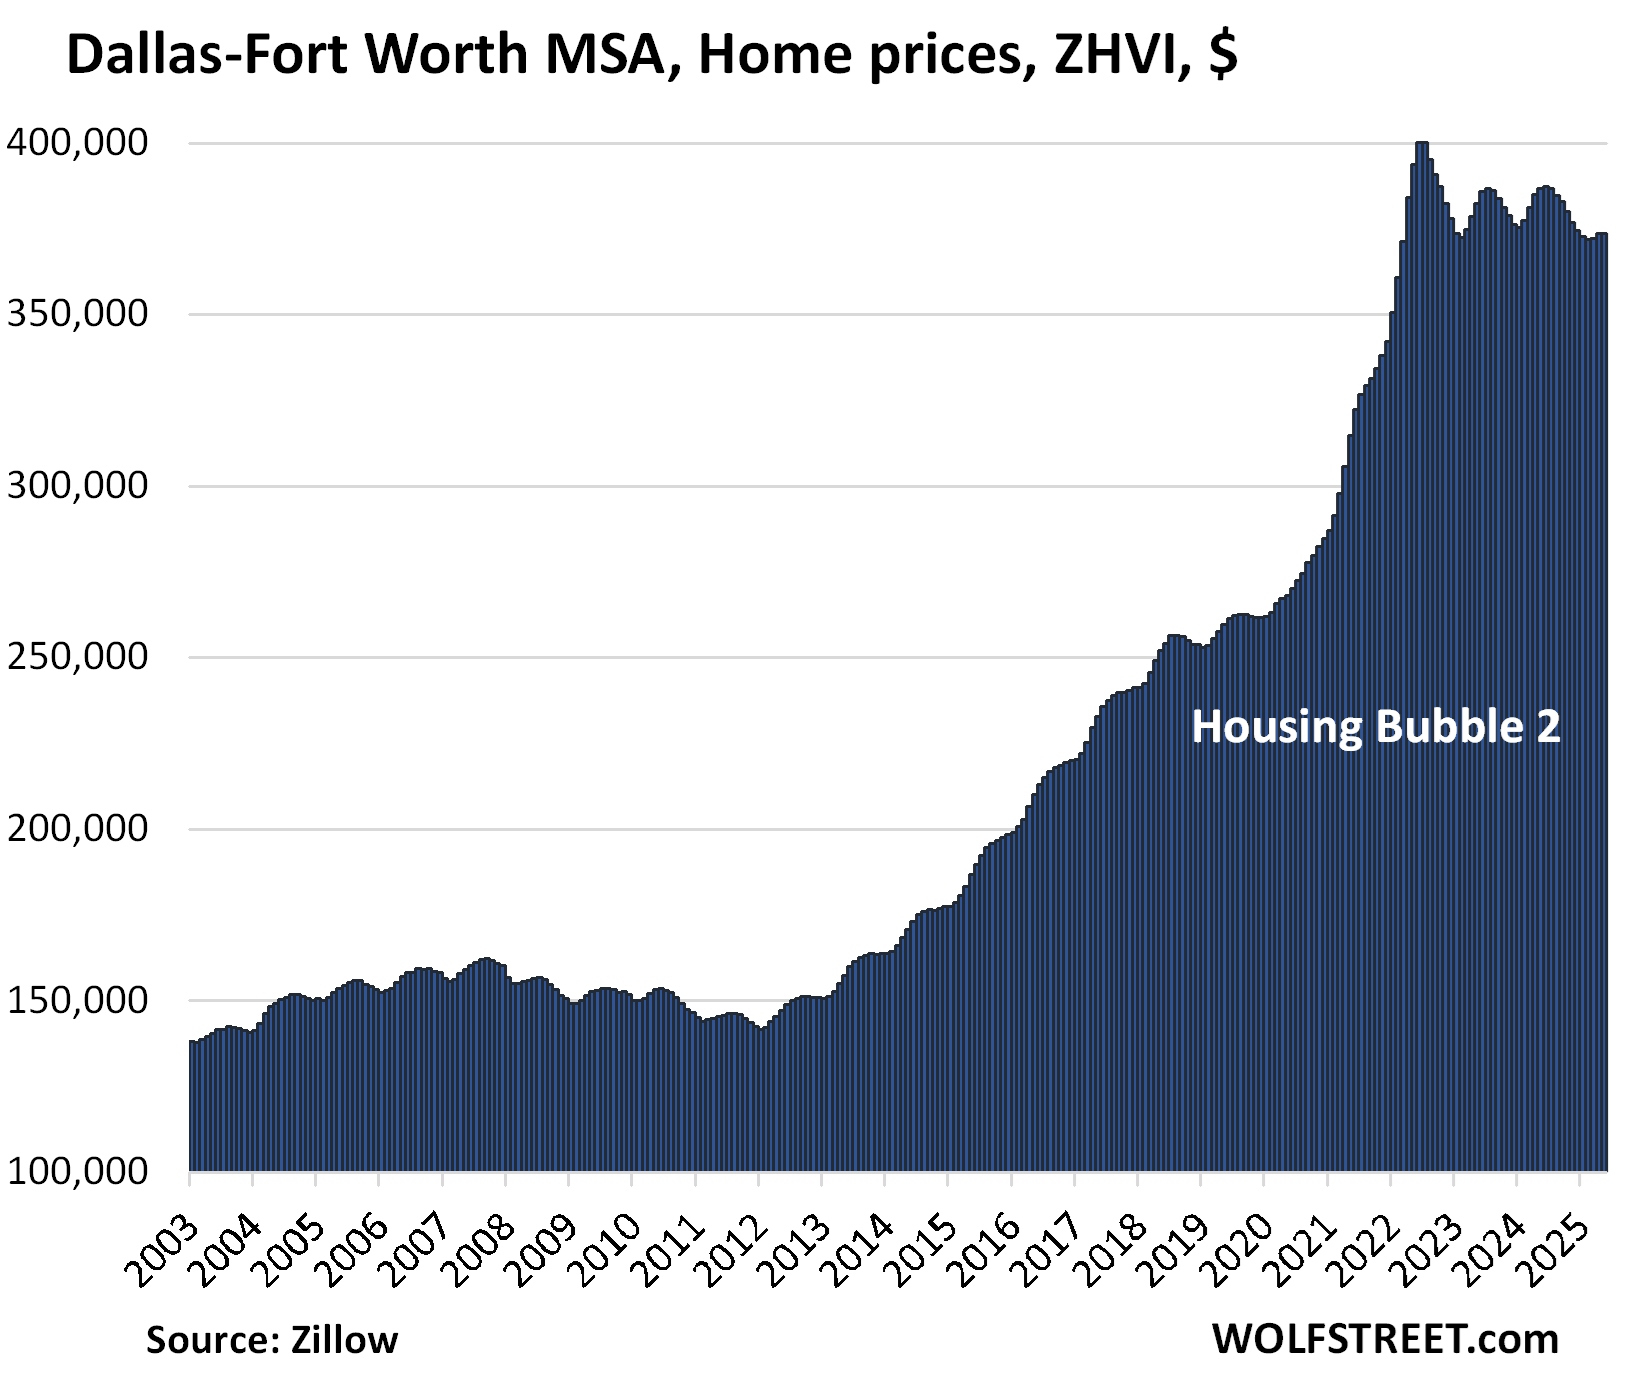
- Dallas: -3.4%
- Phoenix: -3.4%
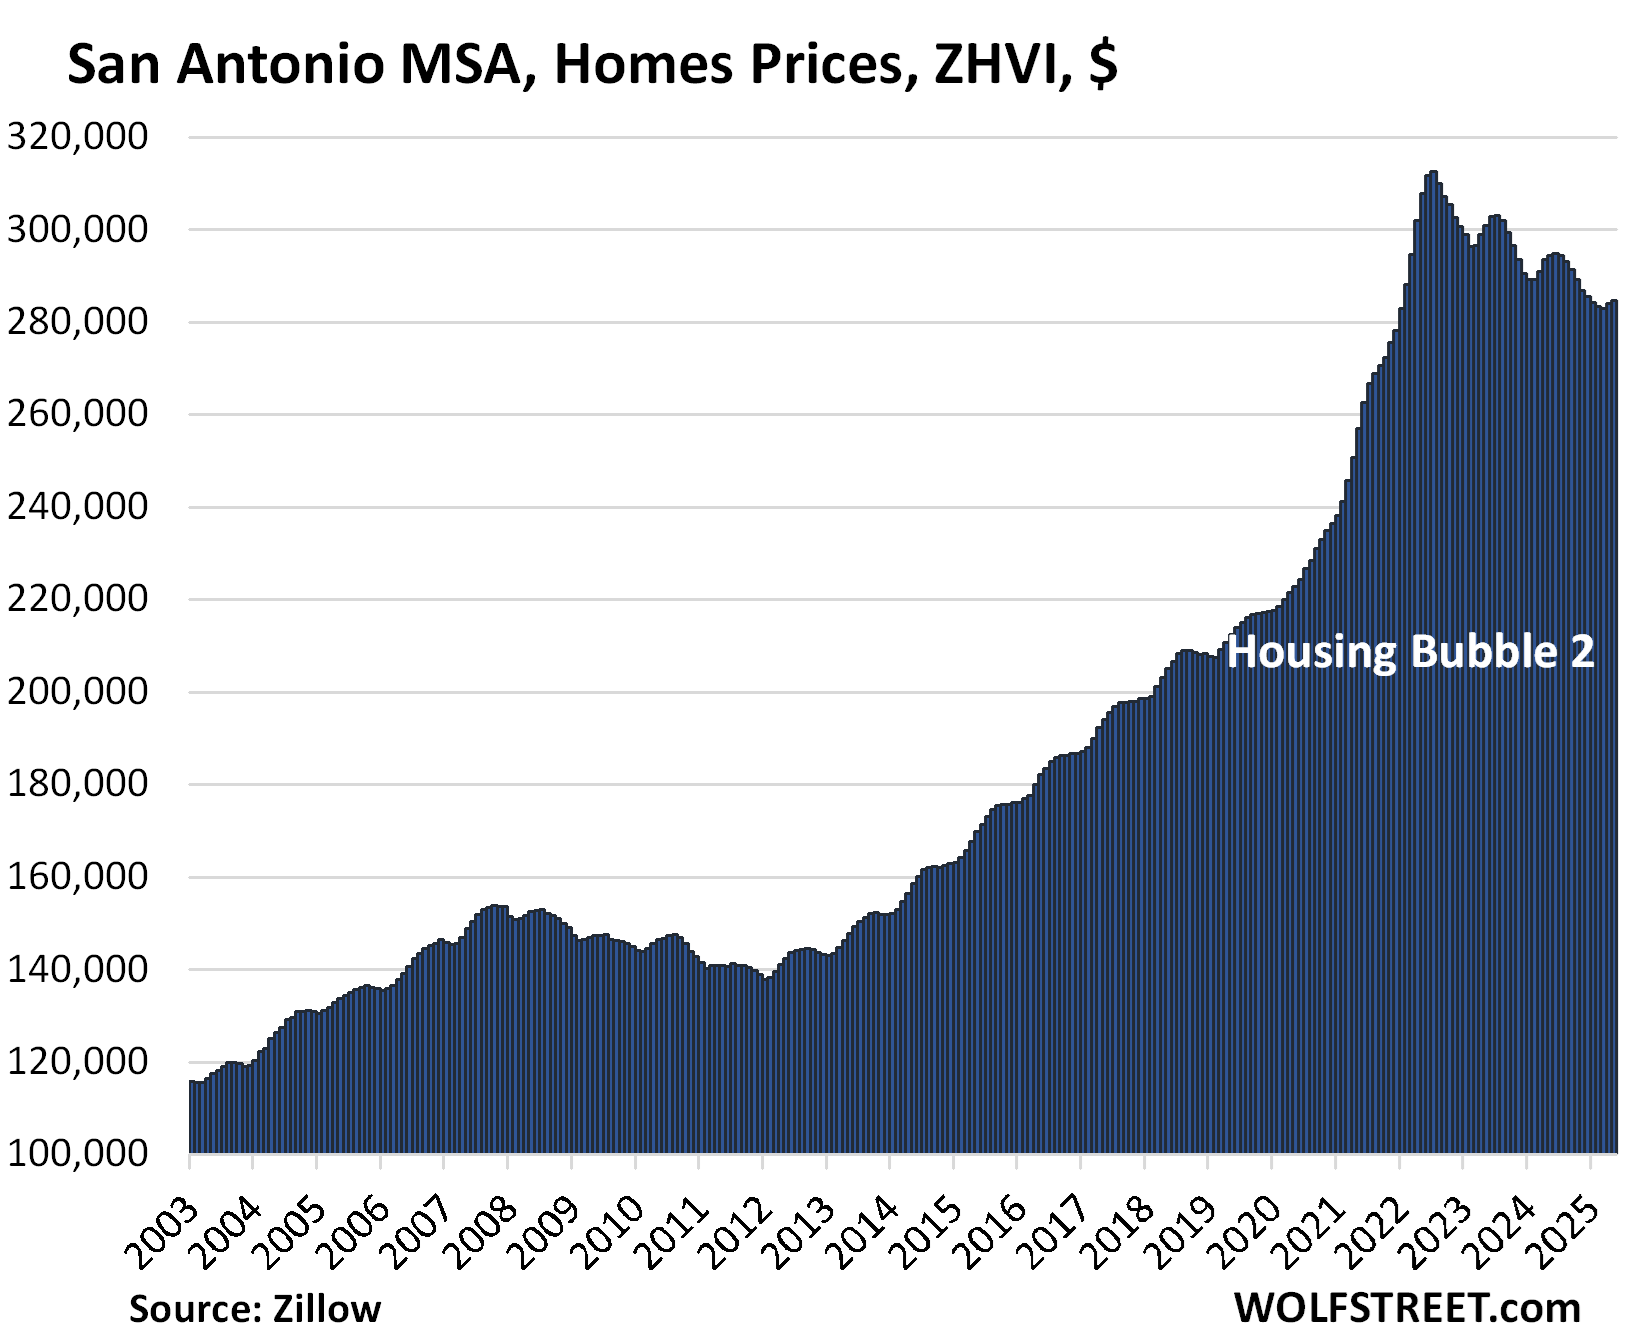
- San Antonio: -3.3%
- Orlando: -3.2%
- Miami: -3.2%
- Atlanta: -2.7%
- San Francisco: -2.5%
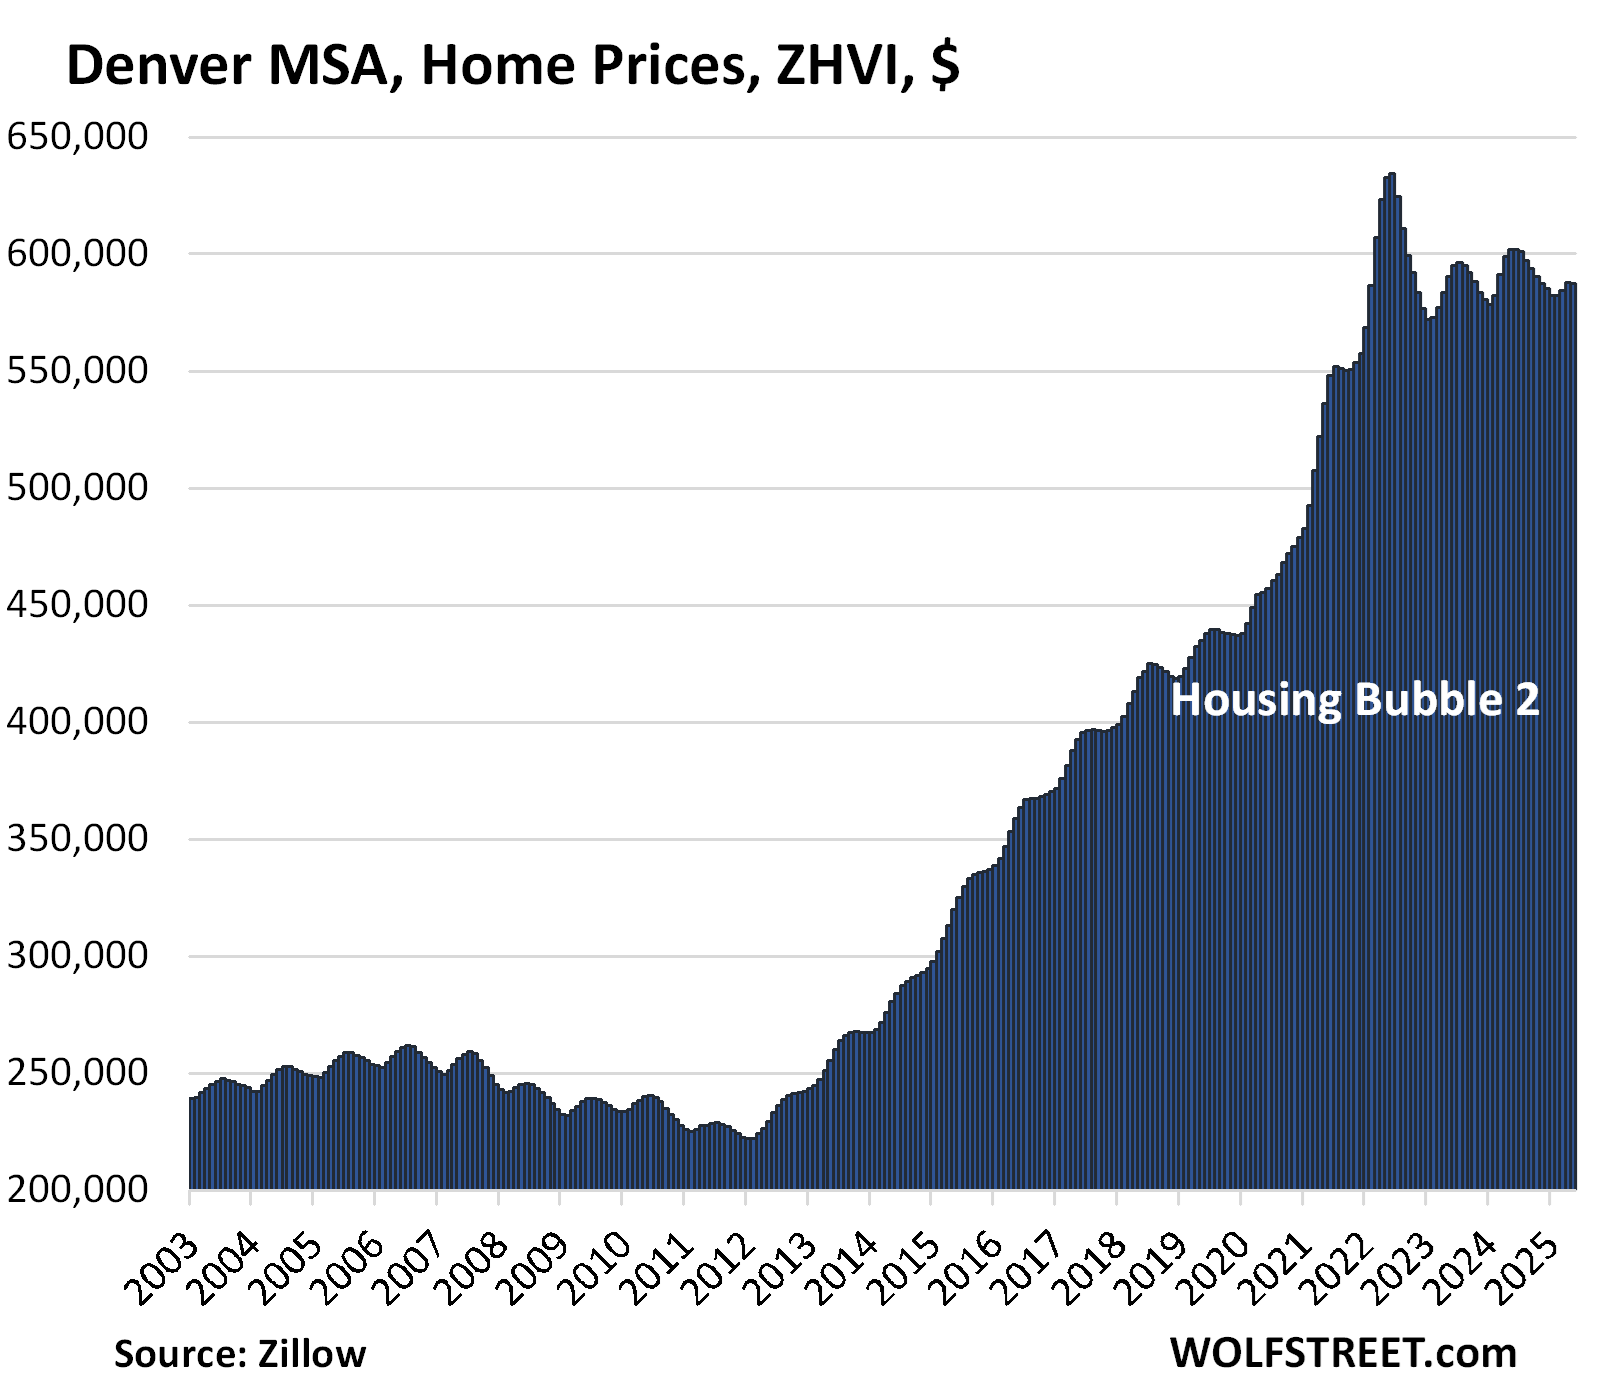
- Denver: -2.4%
- San Diego: -1.9%
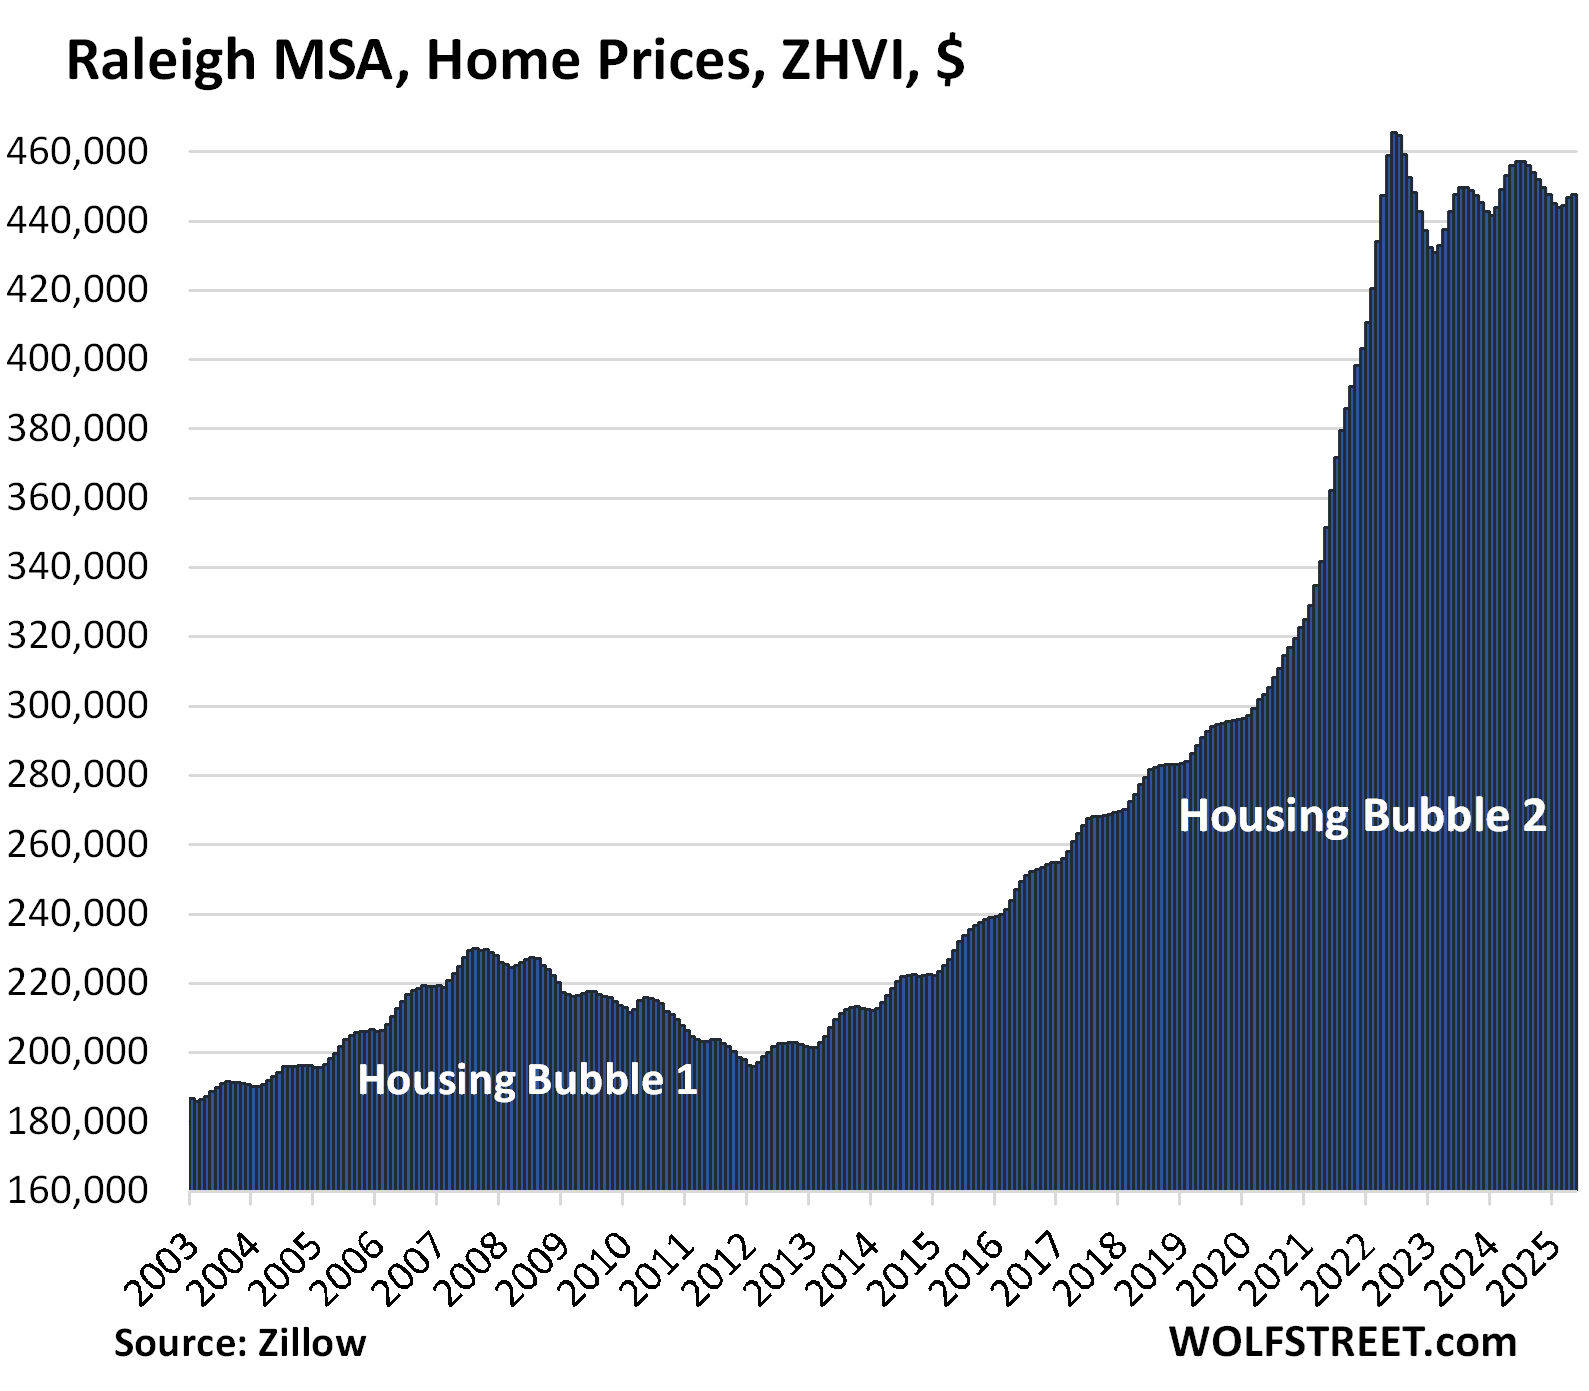
- Raleigh: -1.8%
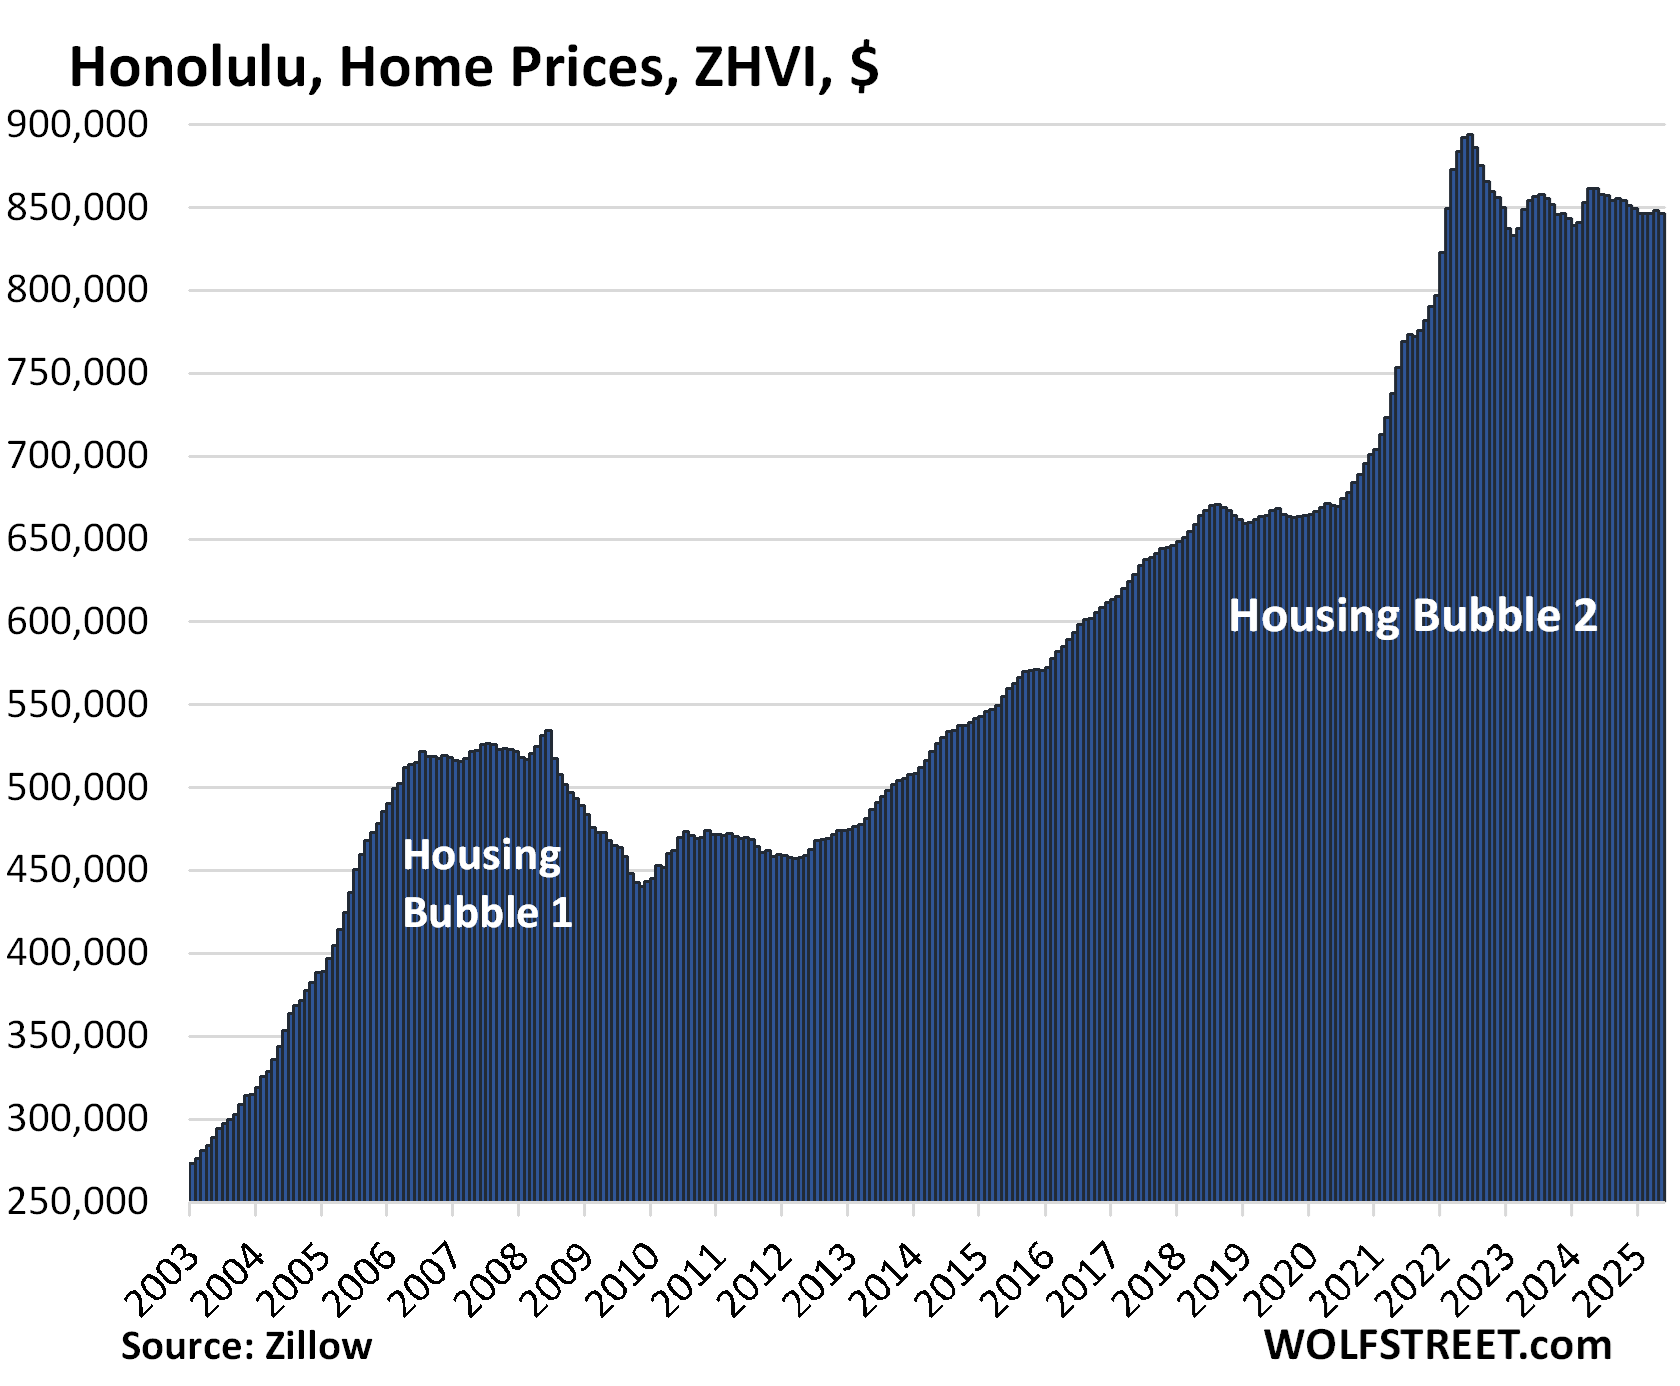
- Honolulu: -1.7%
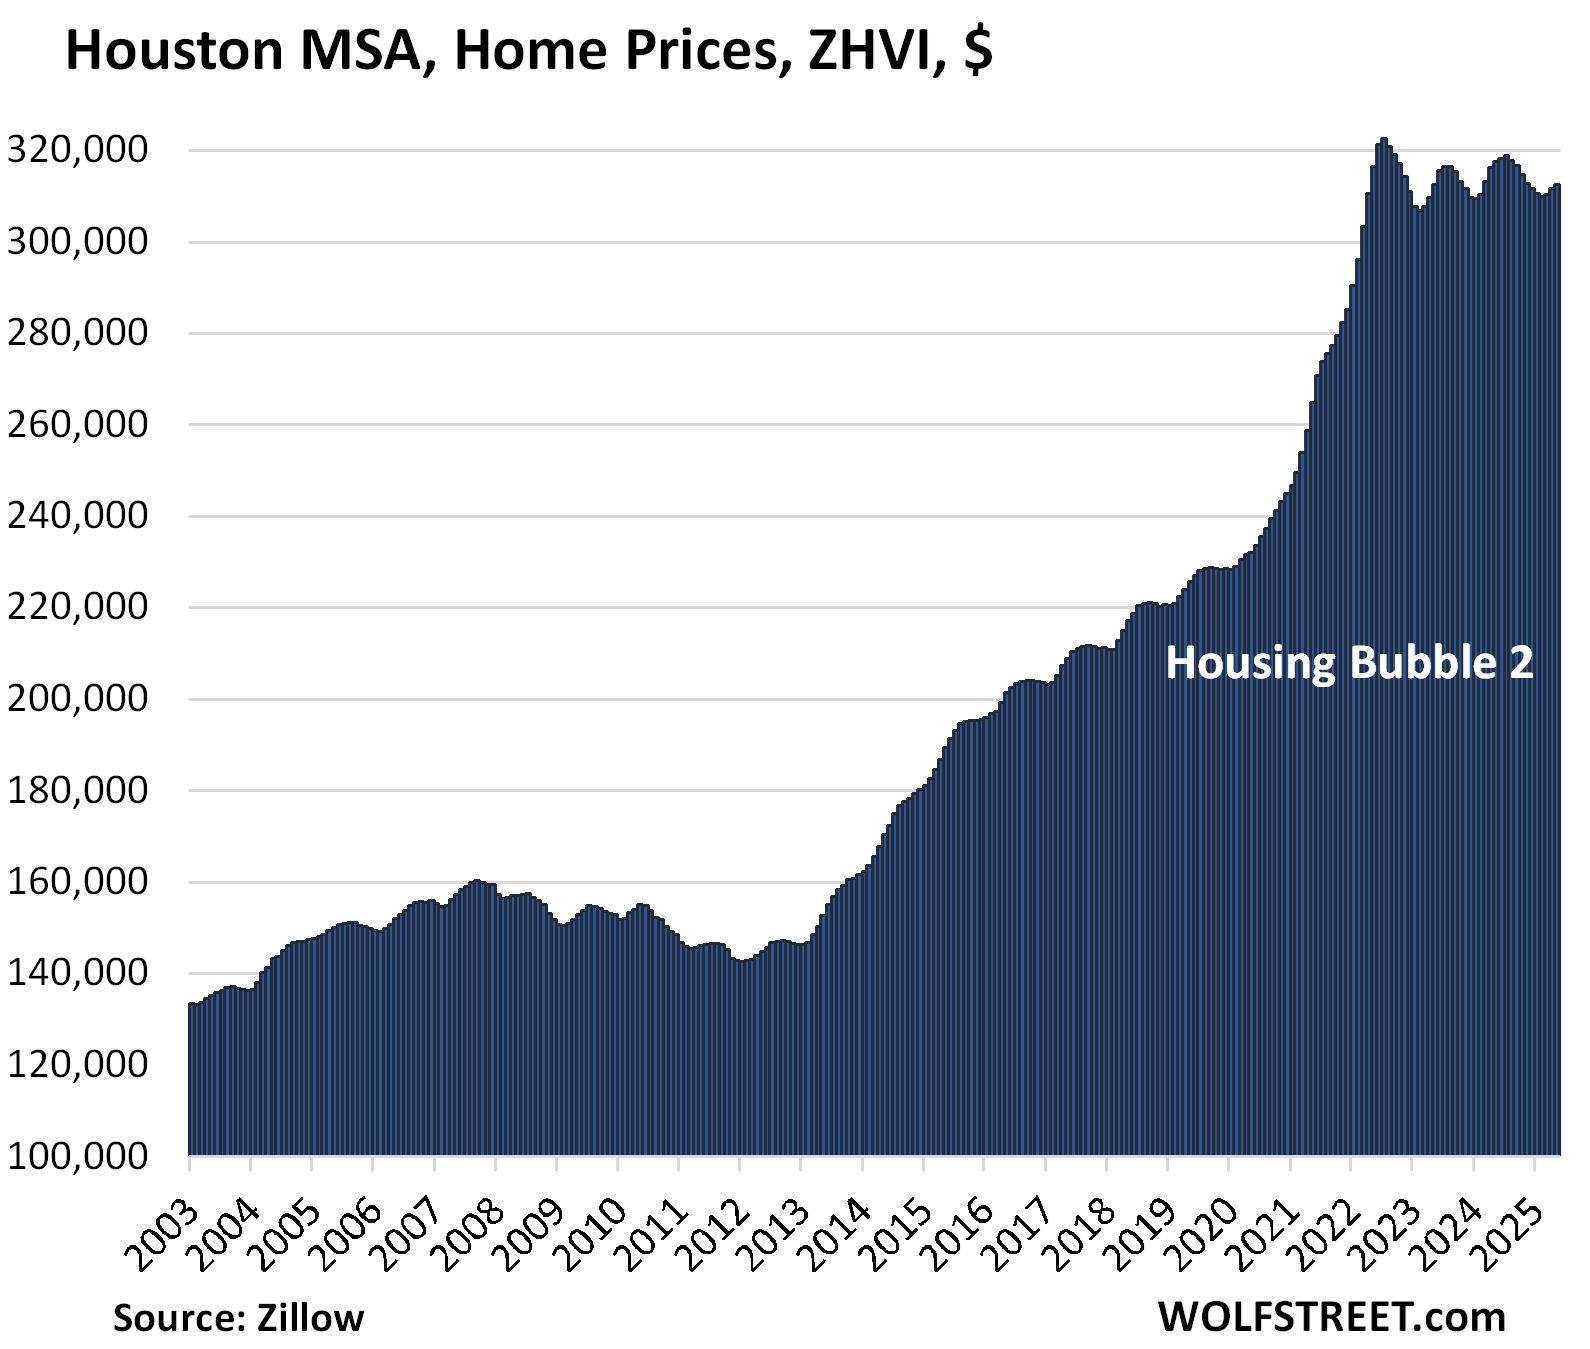
- Houston: -1.5%
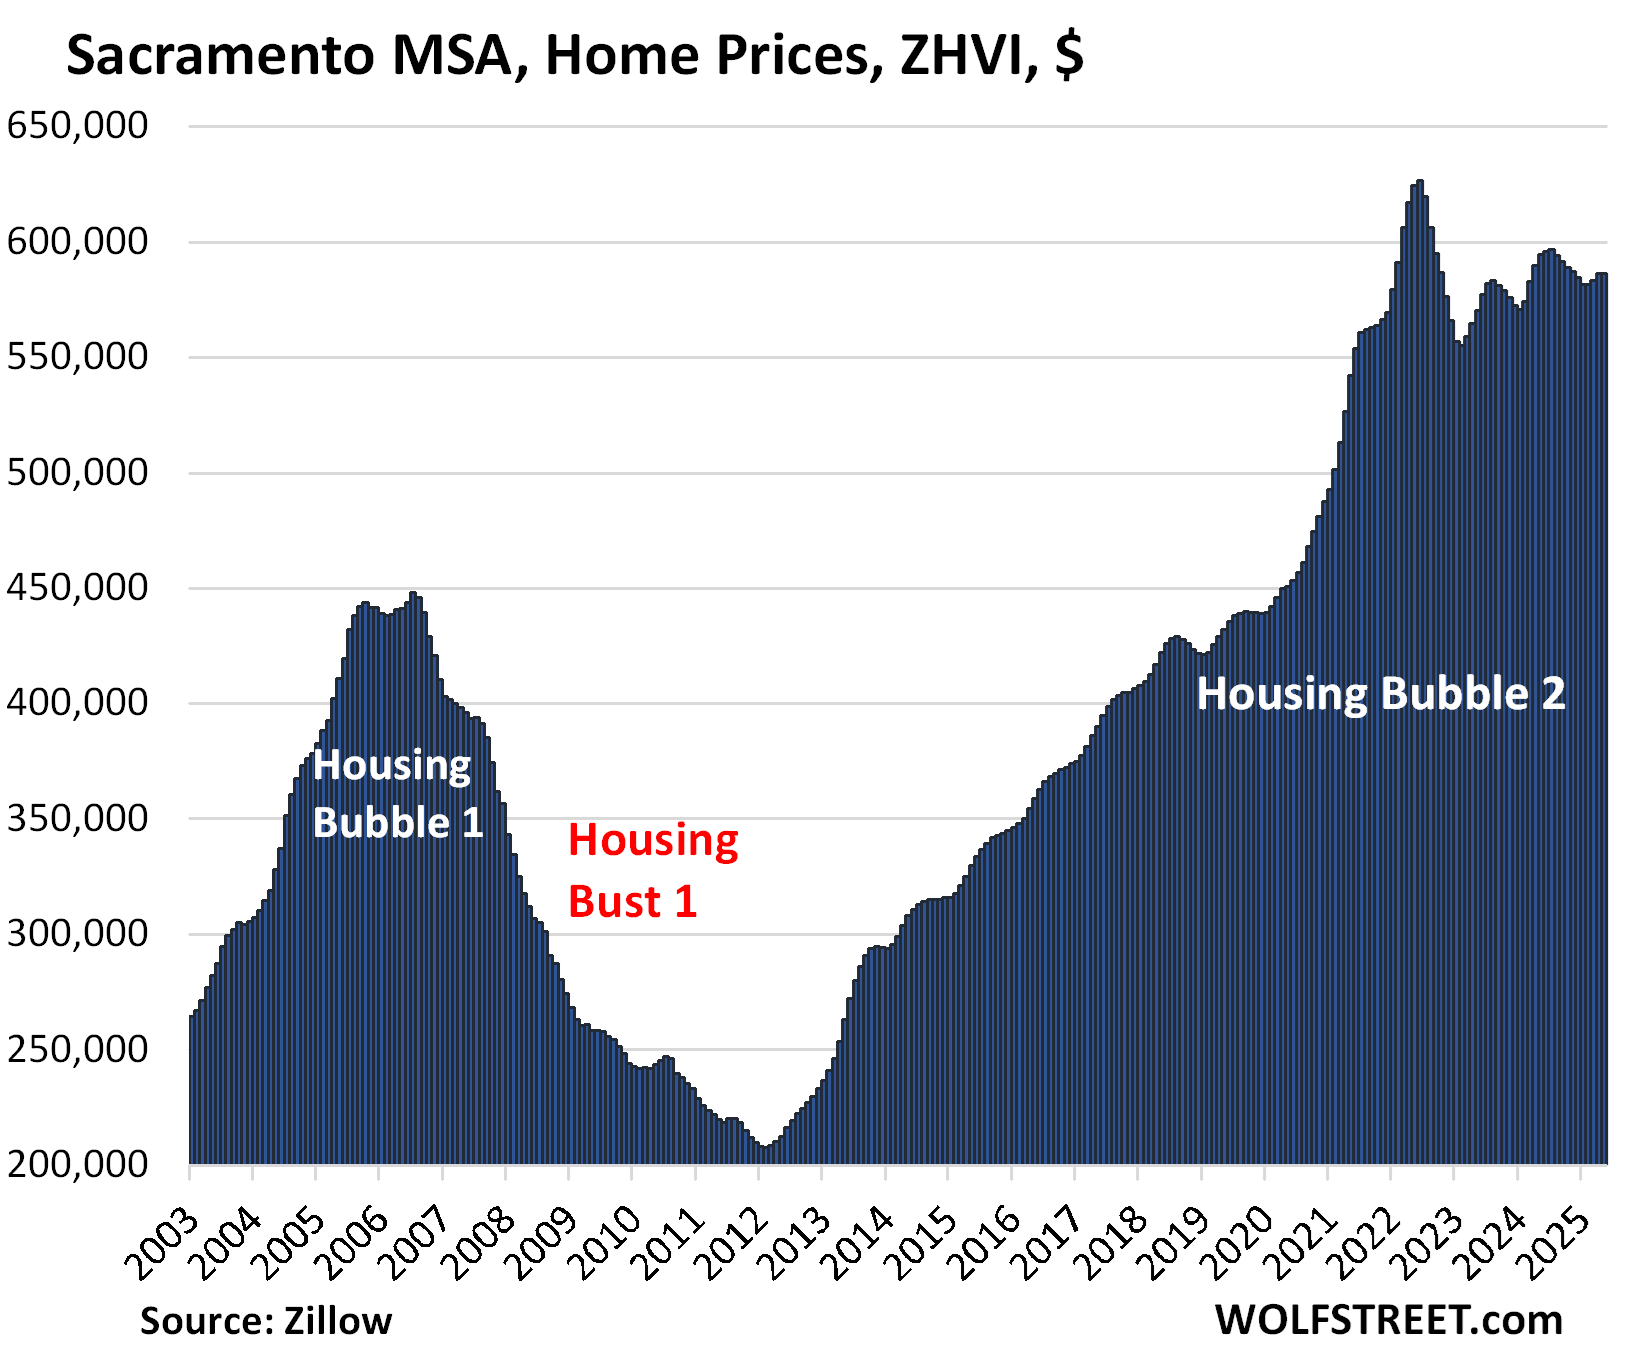
- Sacramento: -1.4%
- Charlotte: -0.9%
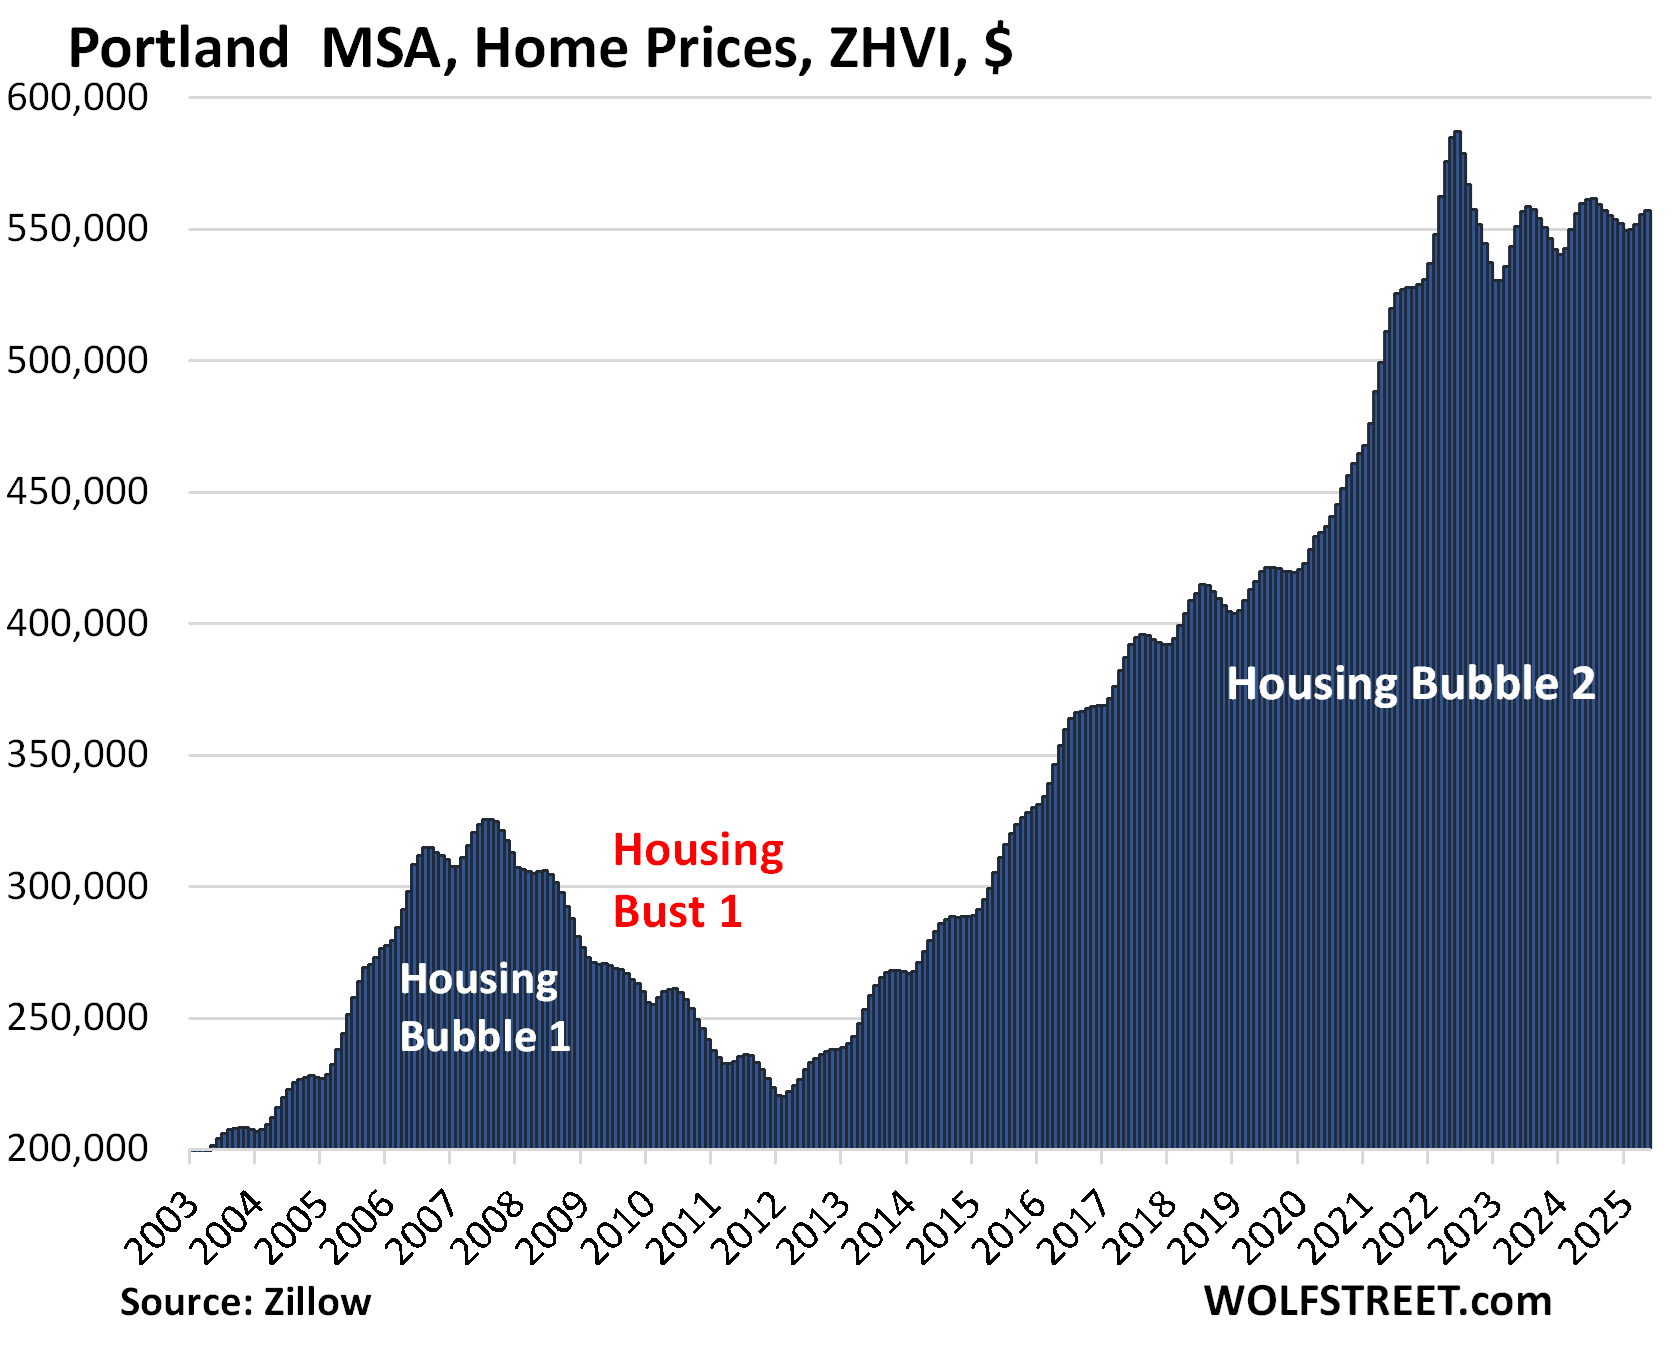
- Portland: -0.5%
- Seattle: -0.1% (newest addition)
This price action is occurring as supply of existing homes for sale in the US jumped to the highest supply for any April since 2016. Inventory is suddenly piling up in the largest markets in California, such as by 66% year-over-year in San Diego, and by 40% in the San Francisco metro where it reached the highest level in many years. In the biggest markets in Florida, inventory is piling up at astonishing rates.
The 19 metros whose prices are down from their 2022 all-time highs.
Led by the metros of:
- Austin: -23.0%
- Phoenix: -10.0%
- San Francisco: -9.5%
- San Antonio: -8.9%
- Denver: -7.4%
- Dallas: -6.7%
- Sacramento: -6.4%
- Tampa: -6.3%
So here we go:
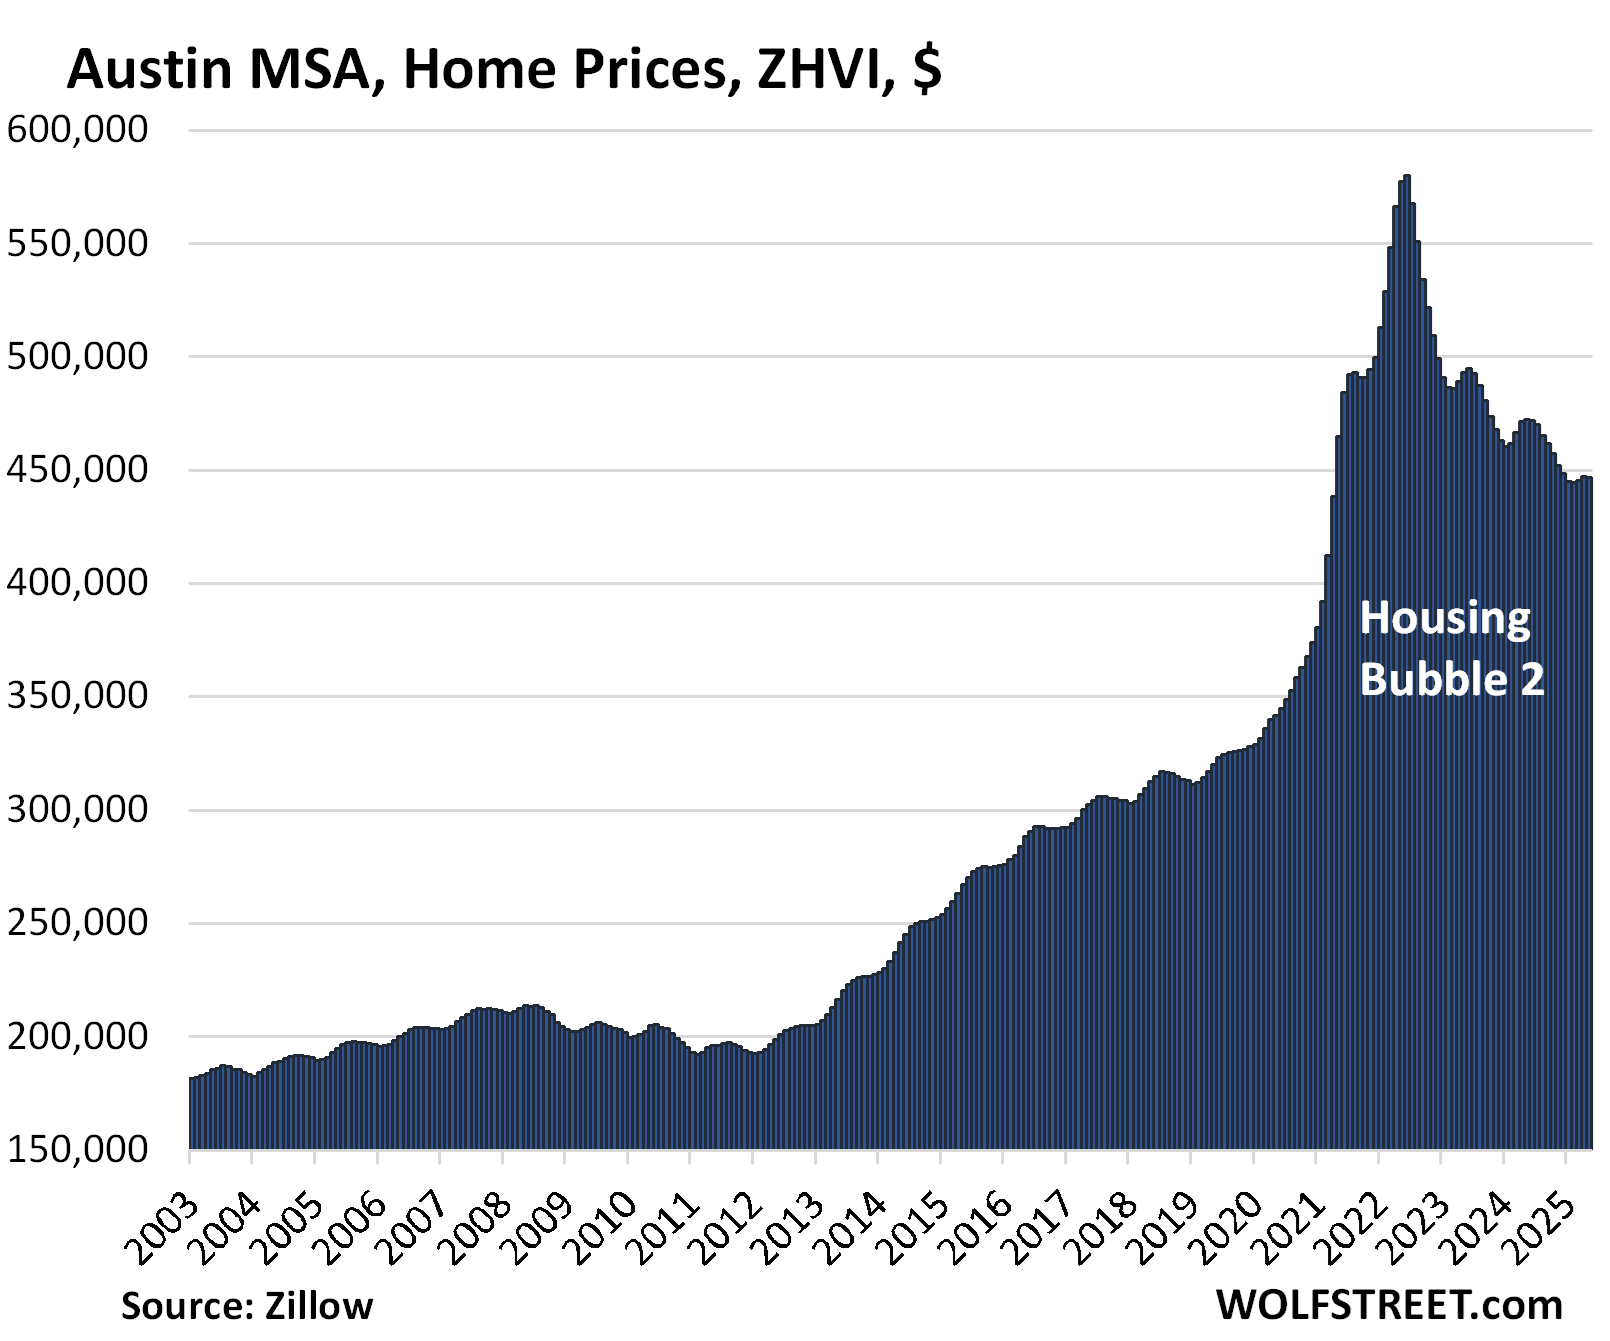
| Austin MSA, Home Prices | |||
| From Jun 2022 peak | MoM | YoY | Since 2000 |
| -23.0% | -0.2% | -5.5% | 155% |
The YoY decline worsened from -5.1% in April. Prices are back where they’d been in April 2021.
The Austin MSA includes the counties of Travis, Williamson, Hays, Caldwell, and Bastrop.
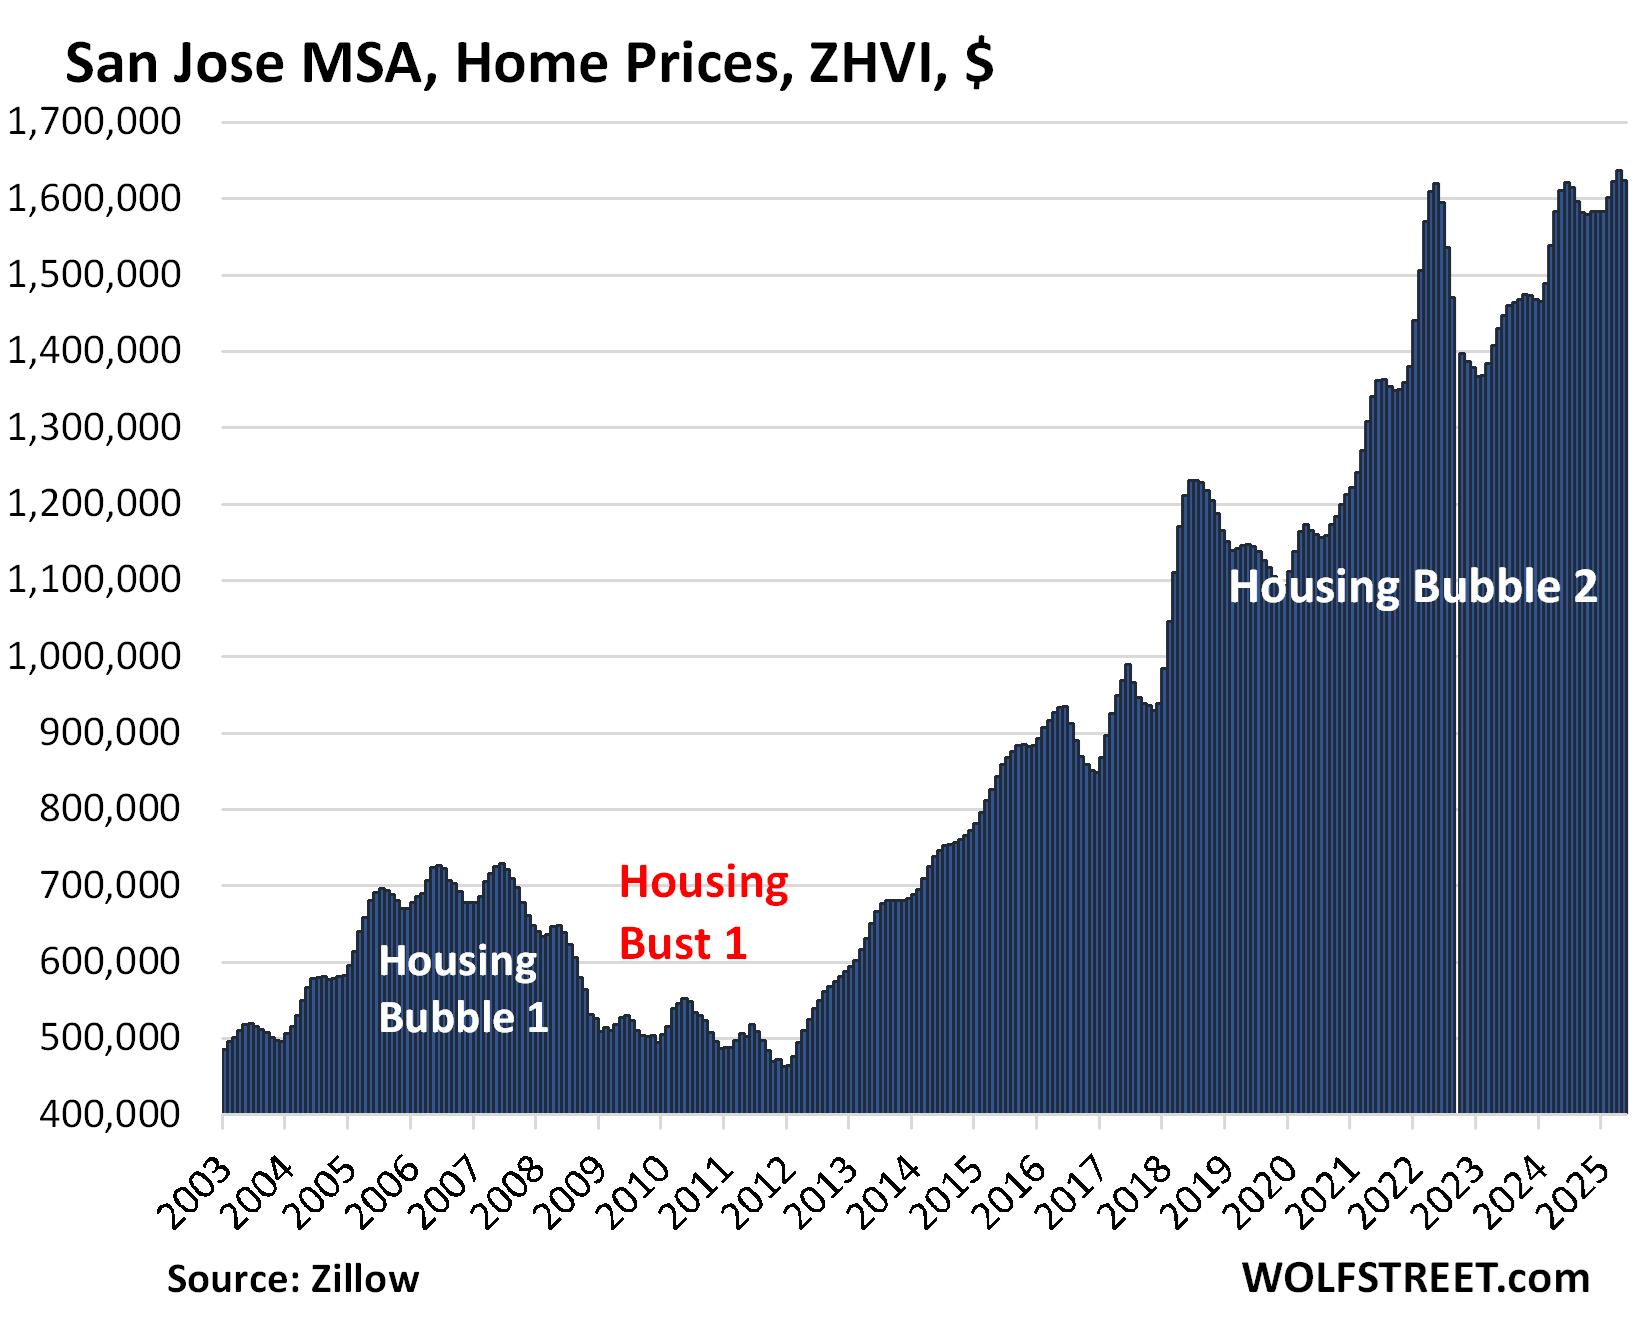
Markets in the oil patch didn’t have much of a Housing Bubble 1 in 2002-2006, and then didn’t have much of a Housing Bust 1 afterwards. But they got into it this time around, including in Texas.
This is a completely insane chart for a housing market; home-price charts should never look like this:
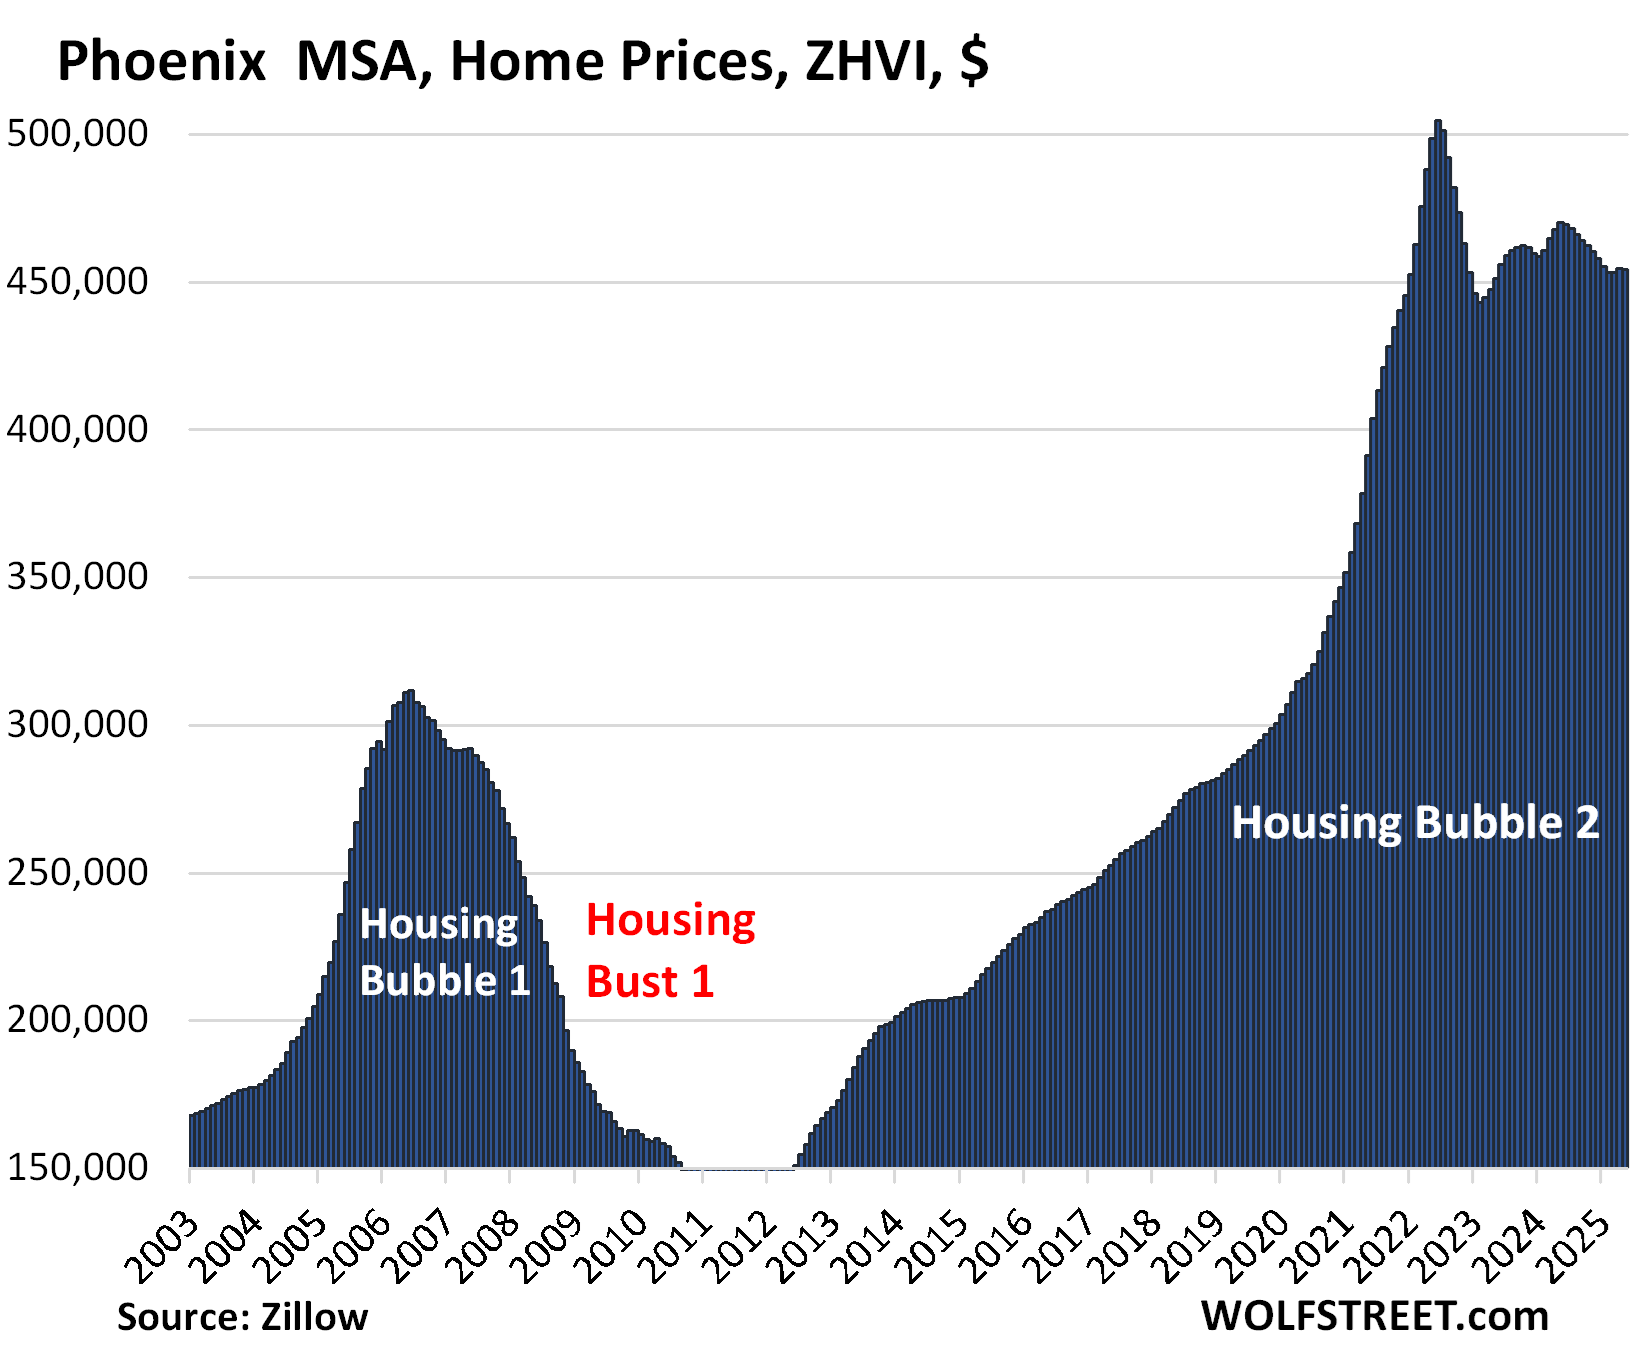
| Phoenix MSA, Home Prices | |||
| From Jun 2022 peak | MoM | YoY | Since 2000 |
| -10.0% | -0.1% | -3.4% | 217% |
The year-over-year decline worsened from -2.8% in April and -1.6% in February. Prices are back where they’d first been in January 2022:
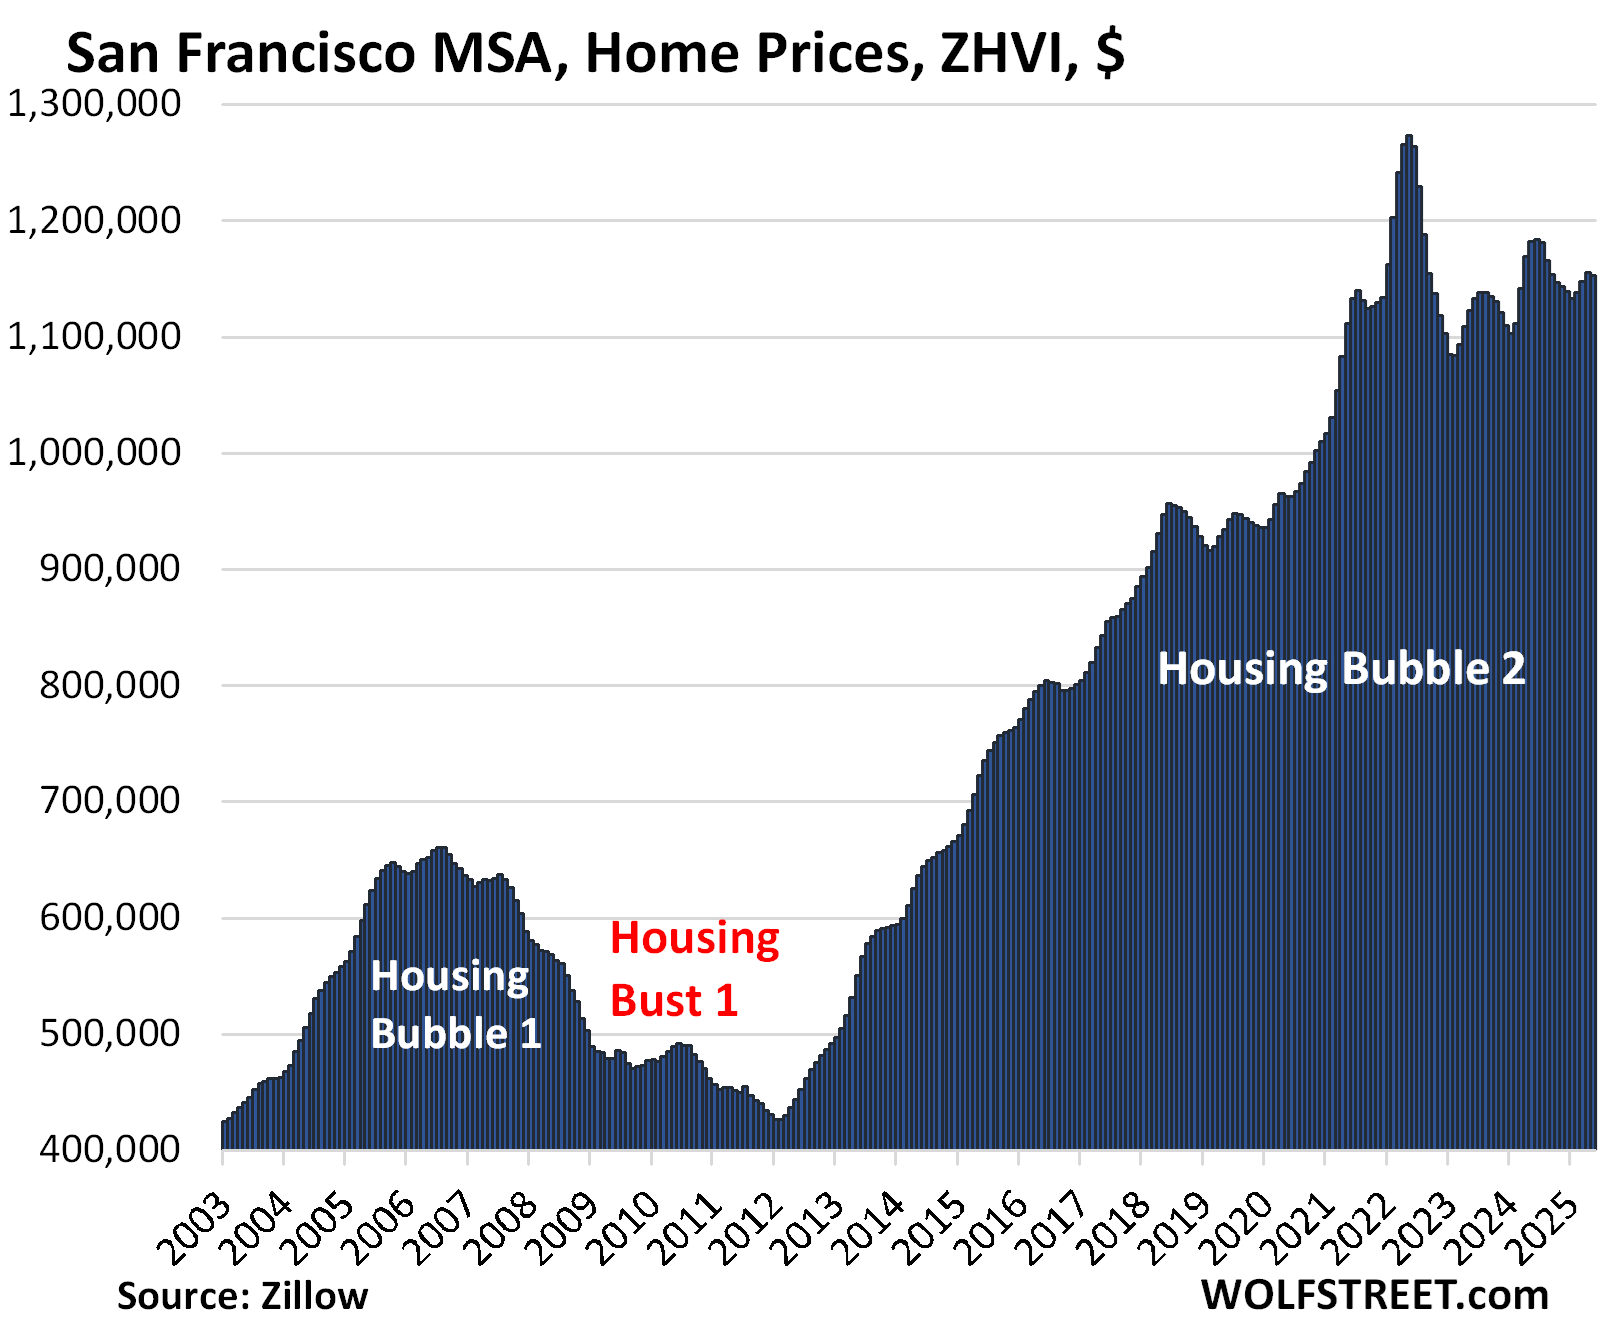
| San Francisco MSA, Home Prices | |||
| From May 2022 peak | MoM | YoY | Since 2000 |
| -9.5% | -0.3% | -2.5% | 295% |
The year-over-year decline worsened from -1.2% in April, after having flipped from YoY gains in March.
The MSA includes San Francisco, much of the East Bay (such as Oakland), much of the North Bay, and goes south on the Peninsula into Silicon Valley through San Mateo County. It does not include the San Jose metro, which covers the southern portion of the Bay Area (see below).
| San Antonio MSA, Home Prices | |||
| From Jul 2022 peak | MoM | YoY | Since 2000 |
| -8.9% | 0.2% | -3.3% | 147% |
The YoY decline worsened from -3.2% in April. Prices are back where they’d been in January 2022.
| Denver MSA, Home Prices | |||
| From Jun 2022 peak | MoM | YoY | Since 2000 |
| -7.4% | -0.1% | -2.4% | 212% |
The YoY decline worsened from -1.8% in April. Prices are back where they’d first been in early 2022.
| Dallas-Fort Worth MSA, Home Prices | |||
| From Jun 2022 peak | MoM | YoY | Since 2000 |
| -6.7% | 0.0% | -3.4% | 191% |
The YoY drop worsened from -3.0% in April.
| Sacramento MSA, Home Prices | |||
| From July 2022 peak | MoM | YoY | Since 2000 |
| -6.4% | 0.0% | -1.4% | 245.8% |
The year-over-year decline worsened from -0.6% in April, when it had flipped to negative, from +0.1% in March, and +1.3% in February.
| Tampa MSA, Home Prices | |||
| From Jul 2022 peak | MoM | YoY | Since 2000 |
| -6.3% | -0.1% | -5.4% | 261% |
The YoY drop worsened from -5.0% in April.
| Honolulu, Home Prices | |||
| From Jun 2022 peak | MoM | YoY | Since 2000 |
| -5.3% | -0.2% | -1.7% | 278% |
The YoY decline worsened from -1.6% in April. In March, the YoY gains had flipped to negative from positive.
| Portland MSA, Home Prices | |||
| From May 2022 peak | MoM | YoY | Since 2000 |
| -5.1% | 0.3% | -0.5% | 220% |
The YoY decline worsened from -0.1% in April, when the index had flipped from YoY price gains.
Prices are back where they’d first been in early 2022
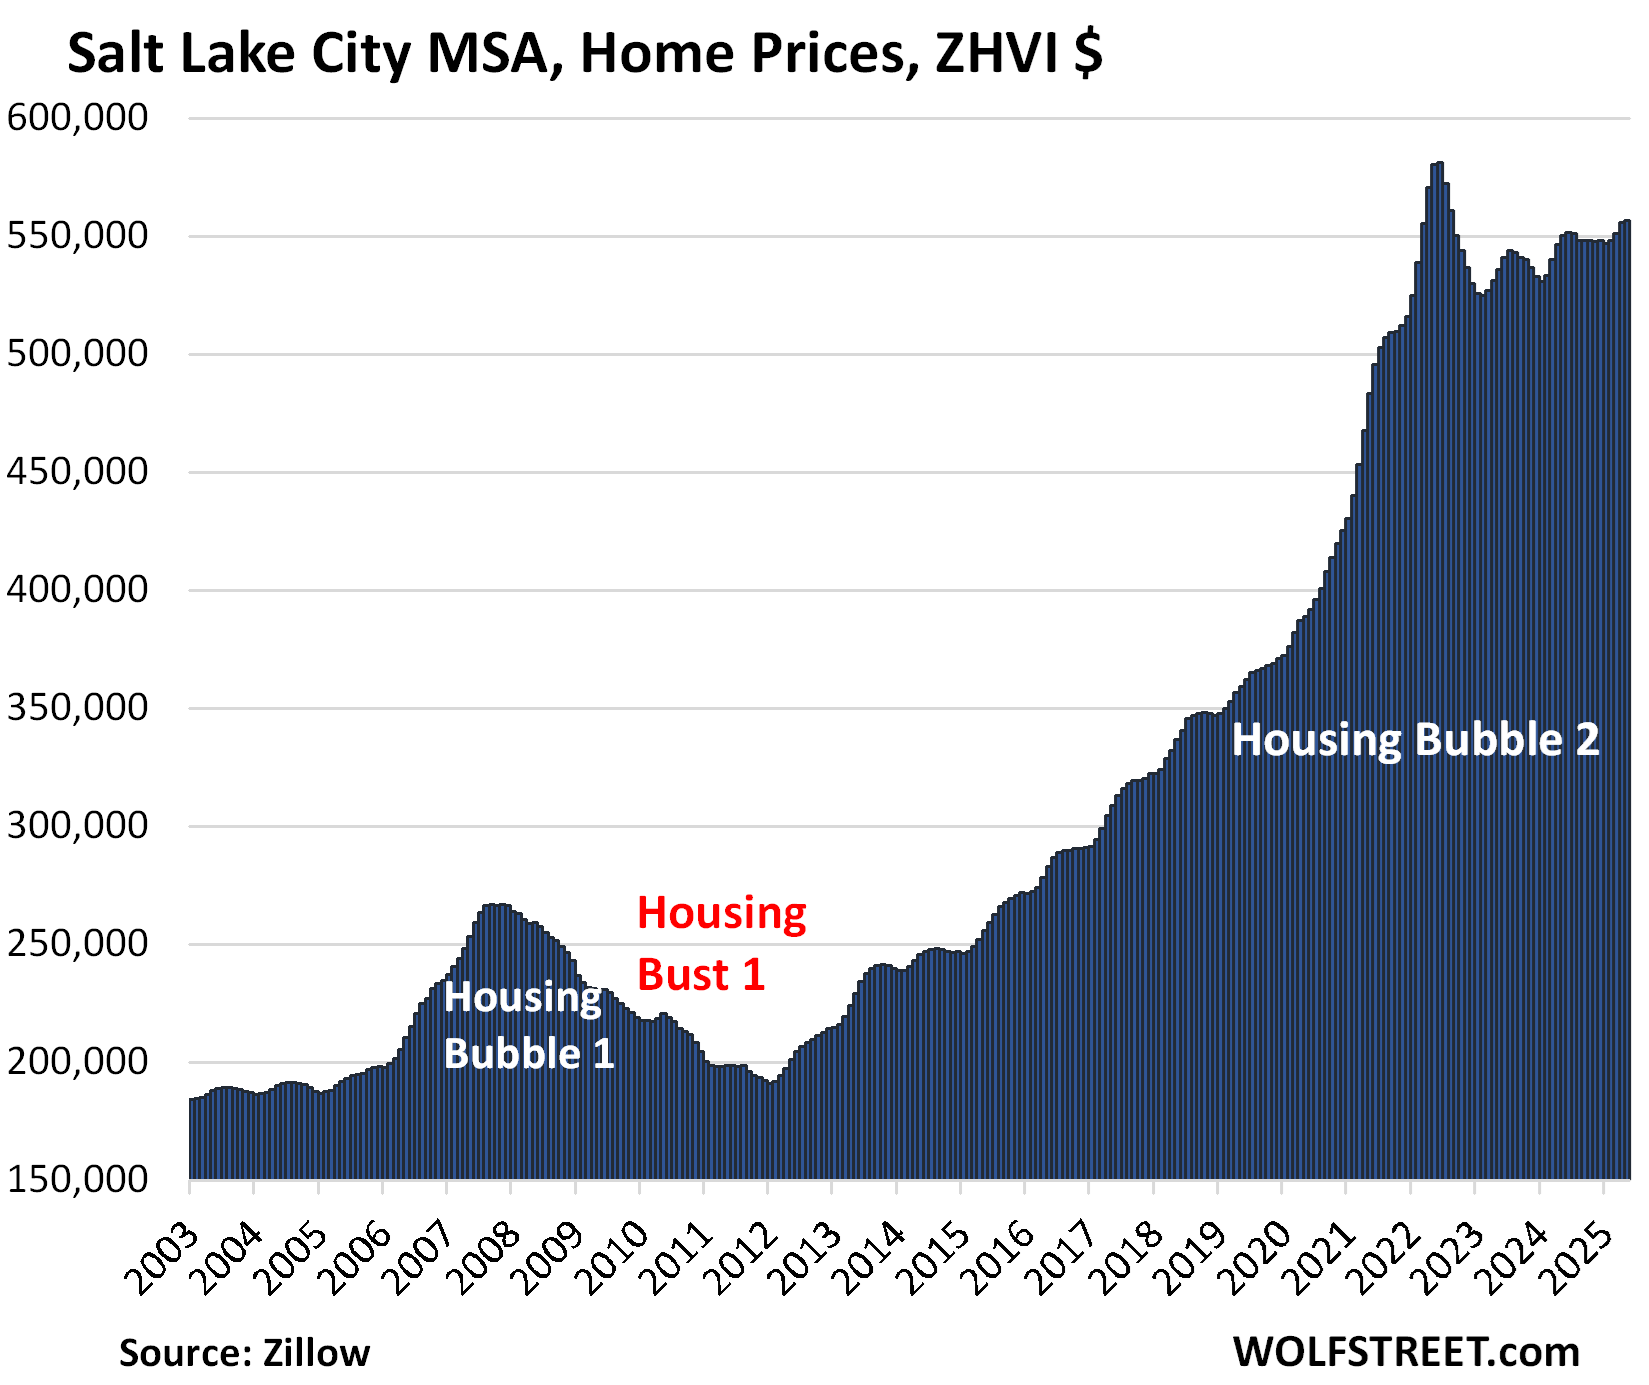
| Salt Lake City MSA, Home Prices | |||
| From July 2022 peak | MoM | YoY | Since 2000 |
| -4.2% | 0.2% | 1.2% | 219% |
The year-over-year gain declined from +1.7% in April and +2.0% in March.
| Seattle MSA, Home Prices | |||
| From May 2022 peak | MoM | YoY | Since 2000 |
| -4.0% | 0.0% | -0.1% | 242% |
The YoY price change flipped to negative (-0.1%) in May from positive (+1.1%) in April, and from +4.3% in February.
| Raleigh MSA, Home Prices | |||
| From July 2022 peak | MoM | YoY | Since 2000 |
| -3.8% | 0.2% | -1.8% | 157% |
The YOY decline worsened from 1.4% in April.
| Houston MSA, Home Prices | |||
| From Jul 2022 peak | MoM | YoY | Since 2000 |
| -3.1% | 0.3% | -1.5% | 151% |
The YoY decline worsened from -1.4% in April. The index is where it had first been in April 2022.
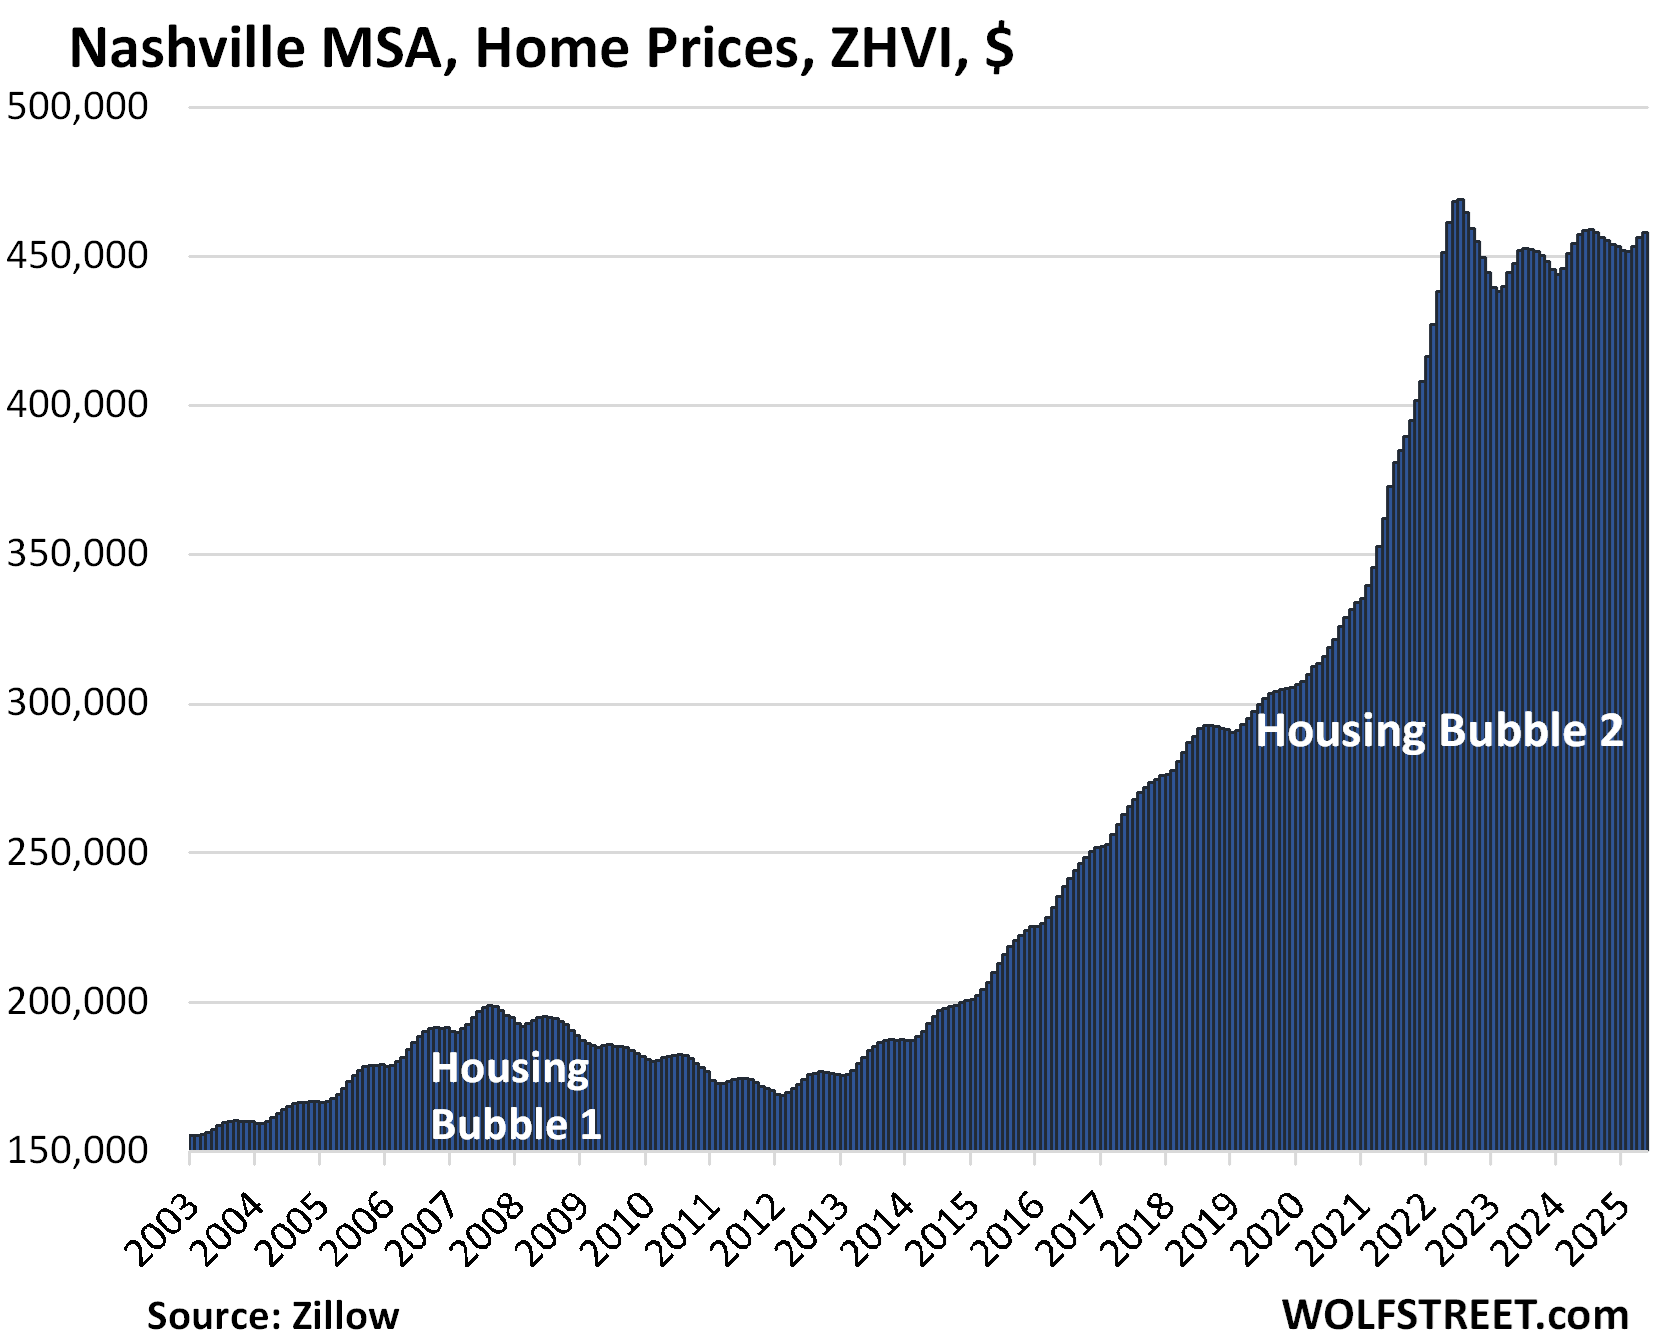
| Nashville MSA, Home Prices | |||
| From July 2022 peak | MoM | YoY | Since 2000 |
| -2.3% | 0.3% | 0.1% | 220% |
The YoY gain shrank further, to just +0.1%, from +0.4% in April. The index is where it had been in April 2022.
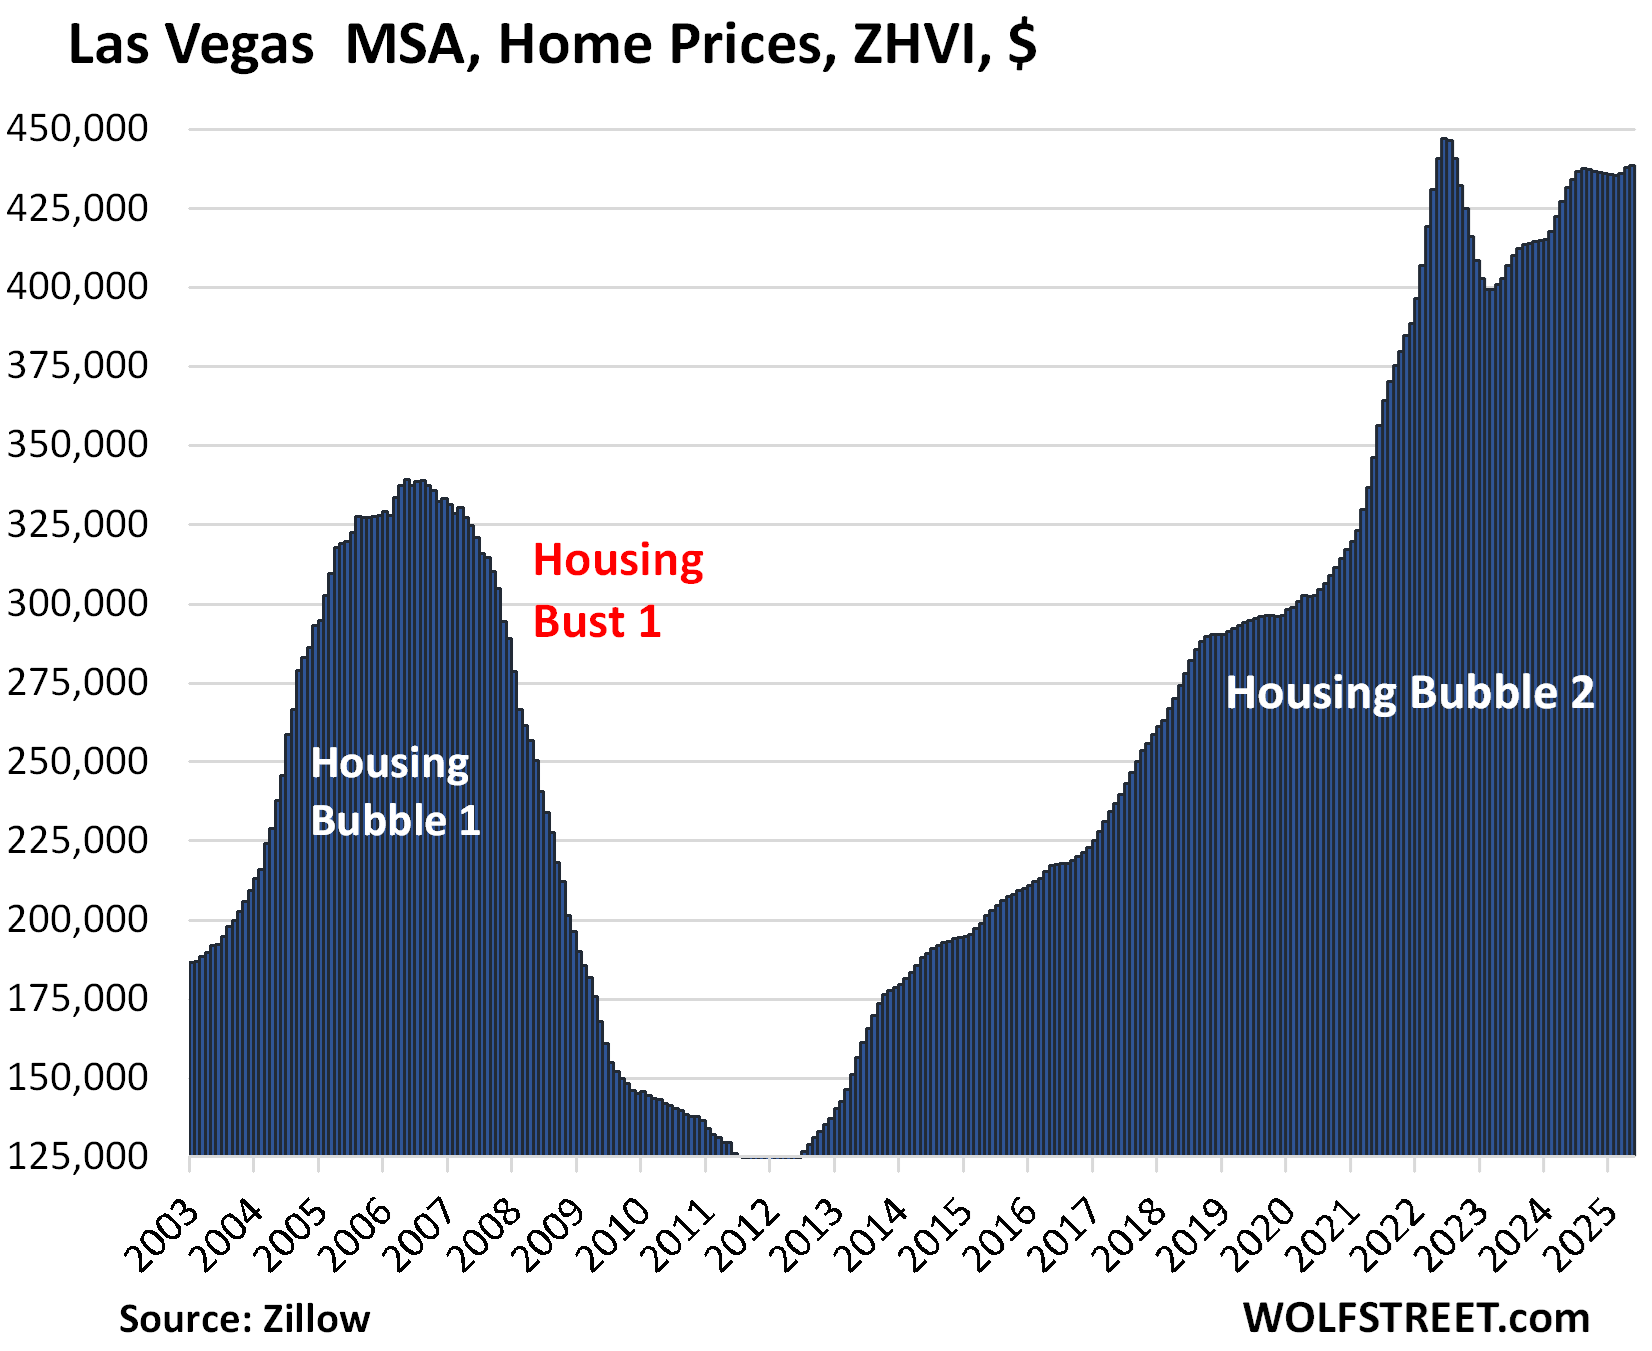
| Las Vegas MSA, Home Prices | |||
| From June 2022 peak | MoM | YoY | Since 2000 |
| -2.0% | 0.1% | 1.6% | 180% |
The YoY gain shrank from +2.5% in April and +4.25% in February.
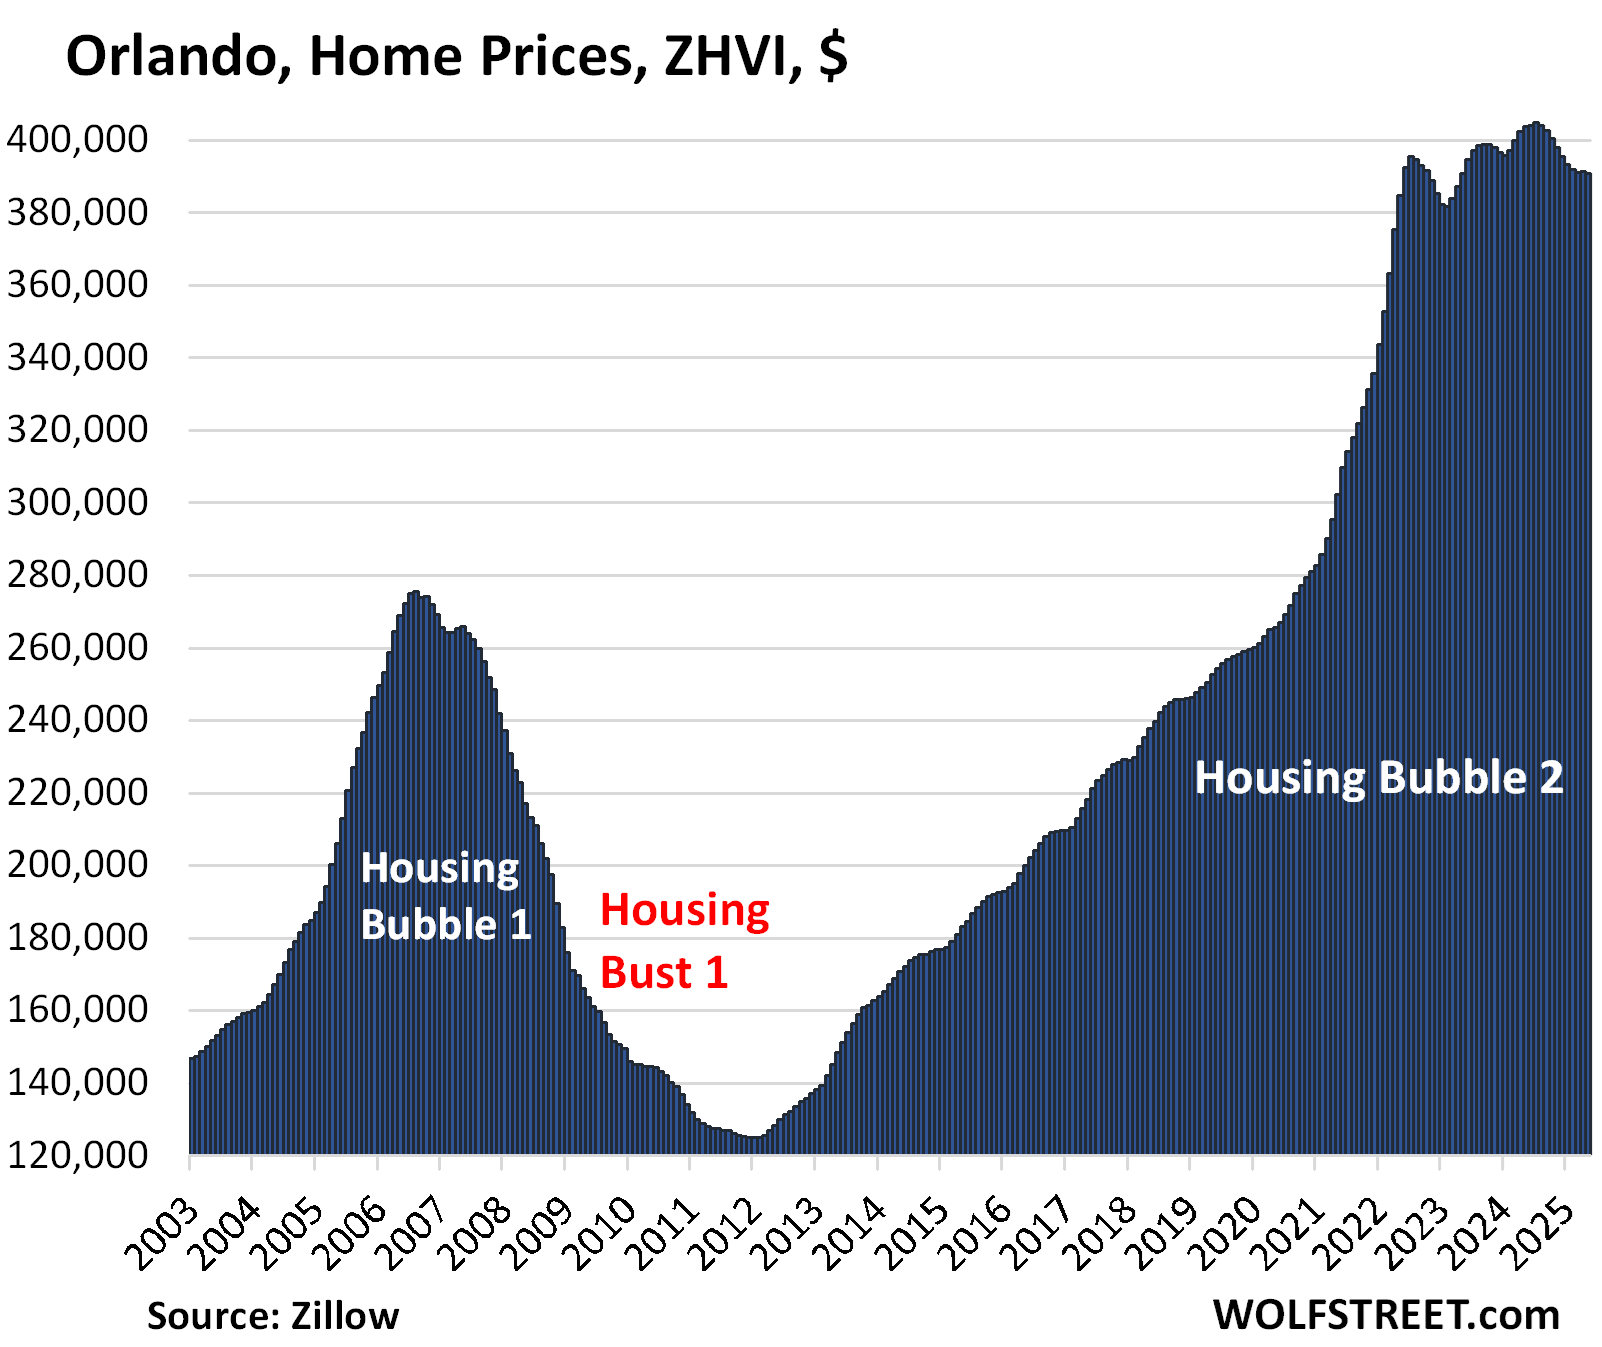
| Orlando MSA, Home Prices | |||
| From June 2022 | MoM | YoY | Since 2000 |
| -1.2% | -0.1% | -3.2% | 231% |
YoY decline worsened from -2.7% in April and -1.4% in February.
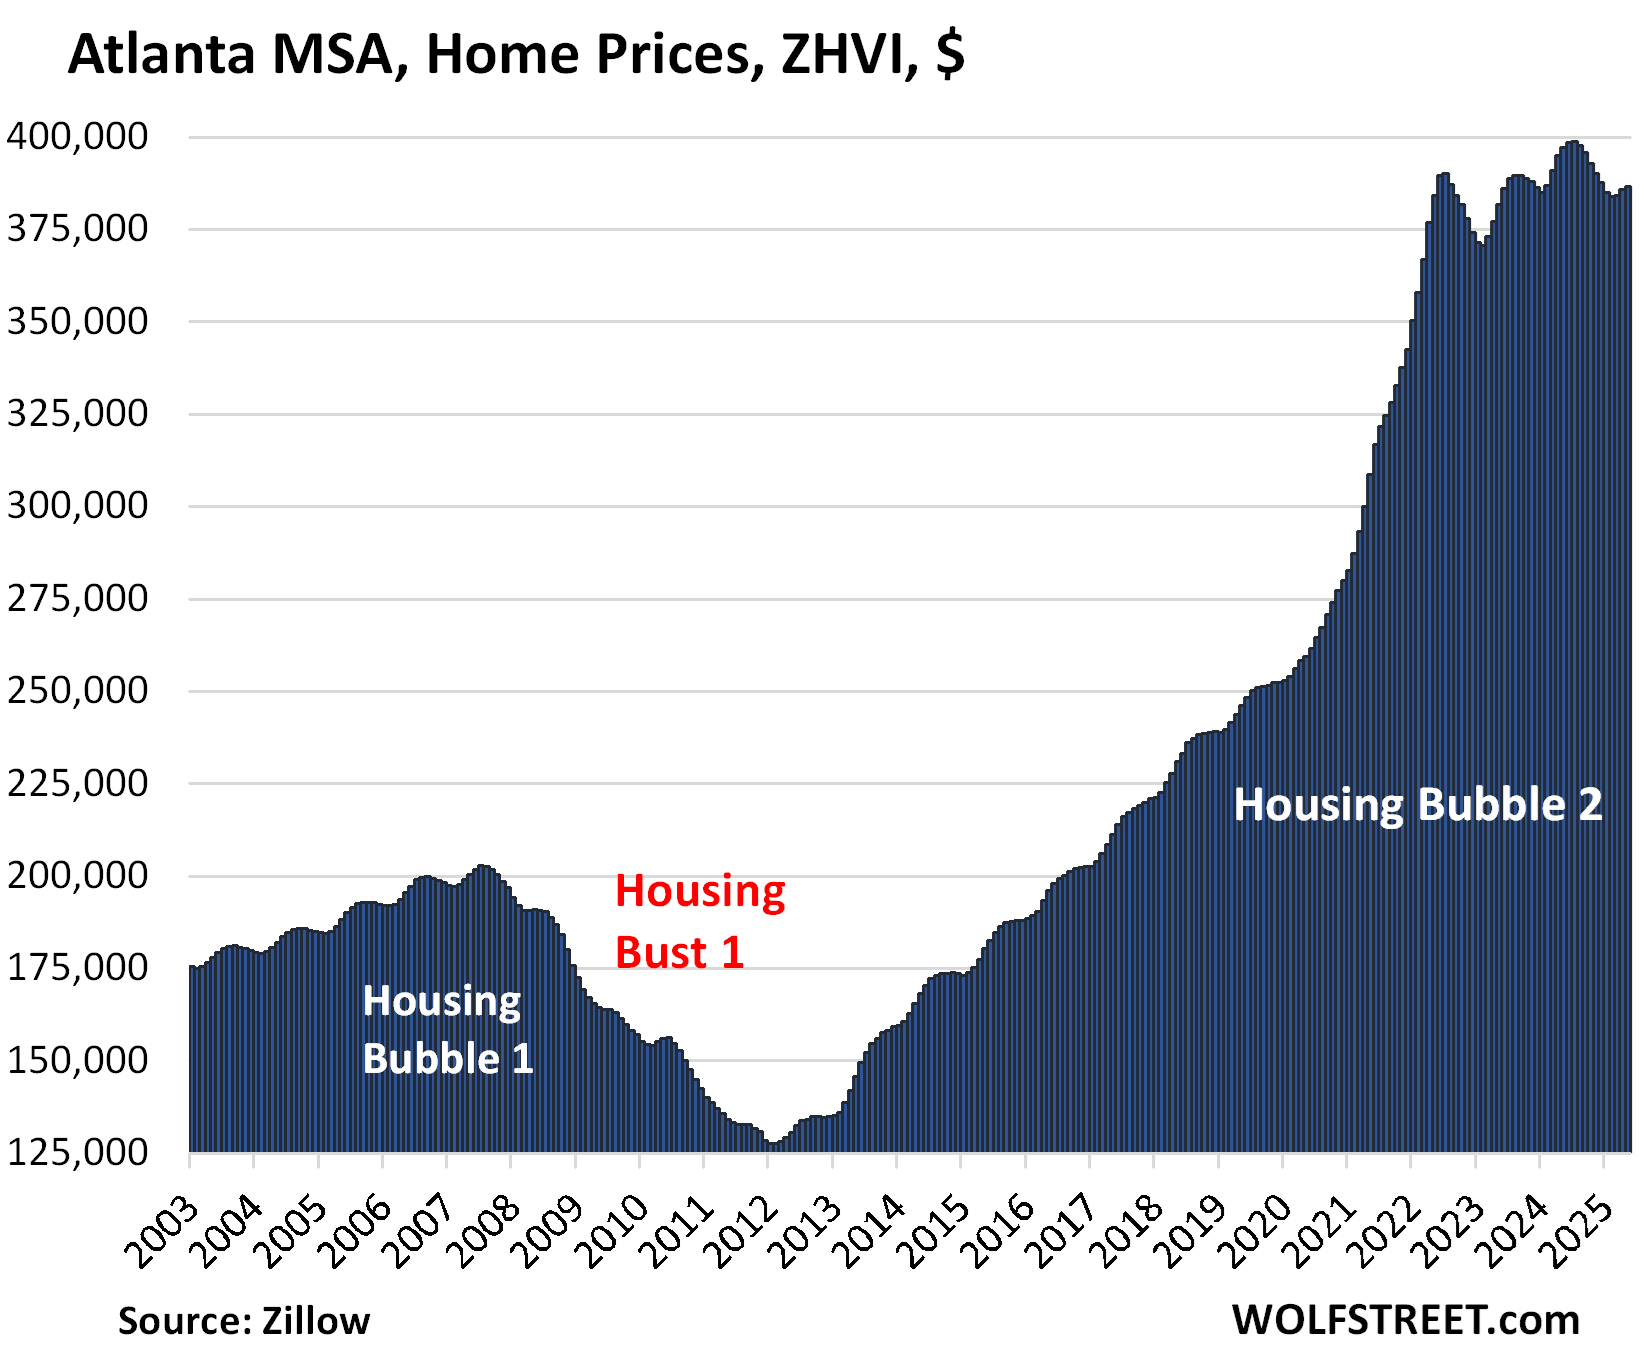
| Atlanta MSA, Home Prices | |||
| From July 2022 | MoM | YoY | Since 2000 |
| -0.9% | 0.2% | -2.7% | 159% |
The YoY decline worsened from -2.3% in April and -0.7% in February.
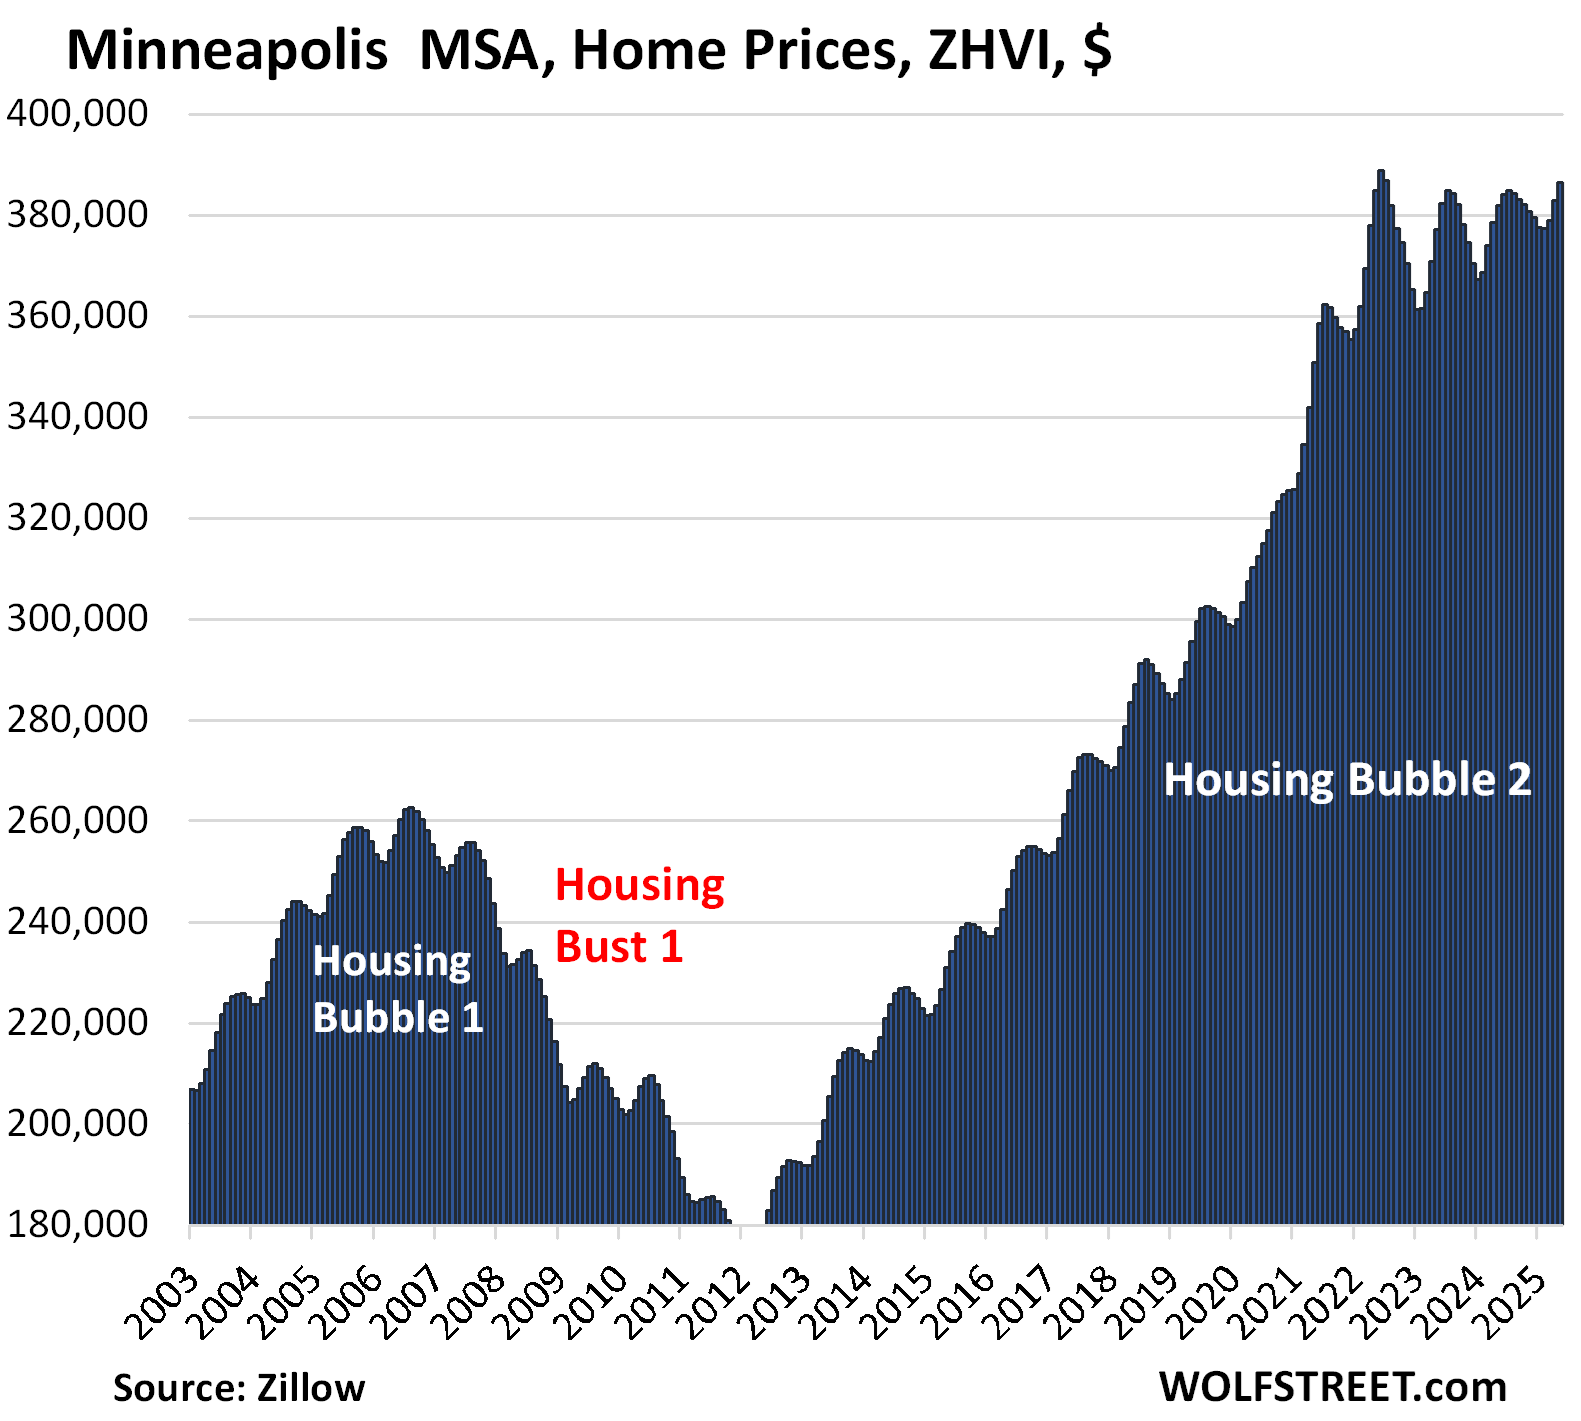
| Minneapolis MSA, Home Prices | |||
| From May 2022 peak | MoM | YoY | Since 2000 |
| -0.6% | 1.0% | 1.2% | 161% |
The YoY gain was unchanged from April.
The 3 metros that are still higher than in mid-2022, if barely, but down YoY:
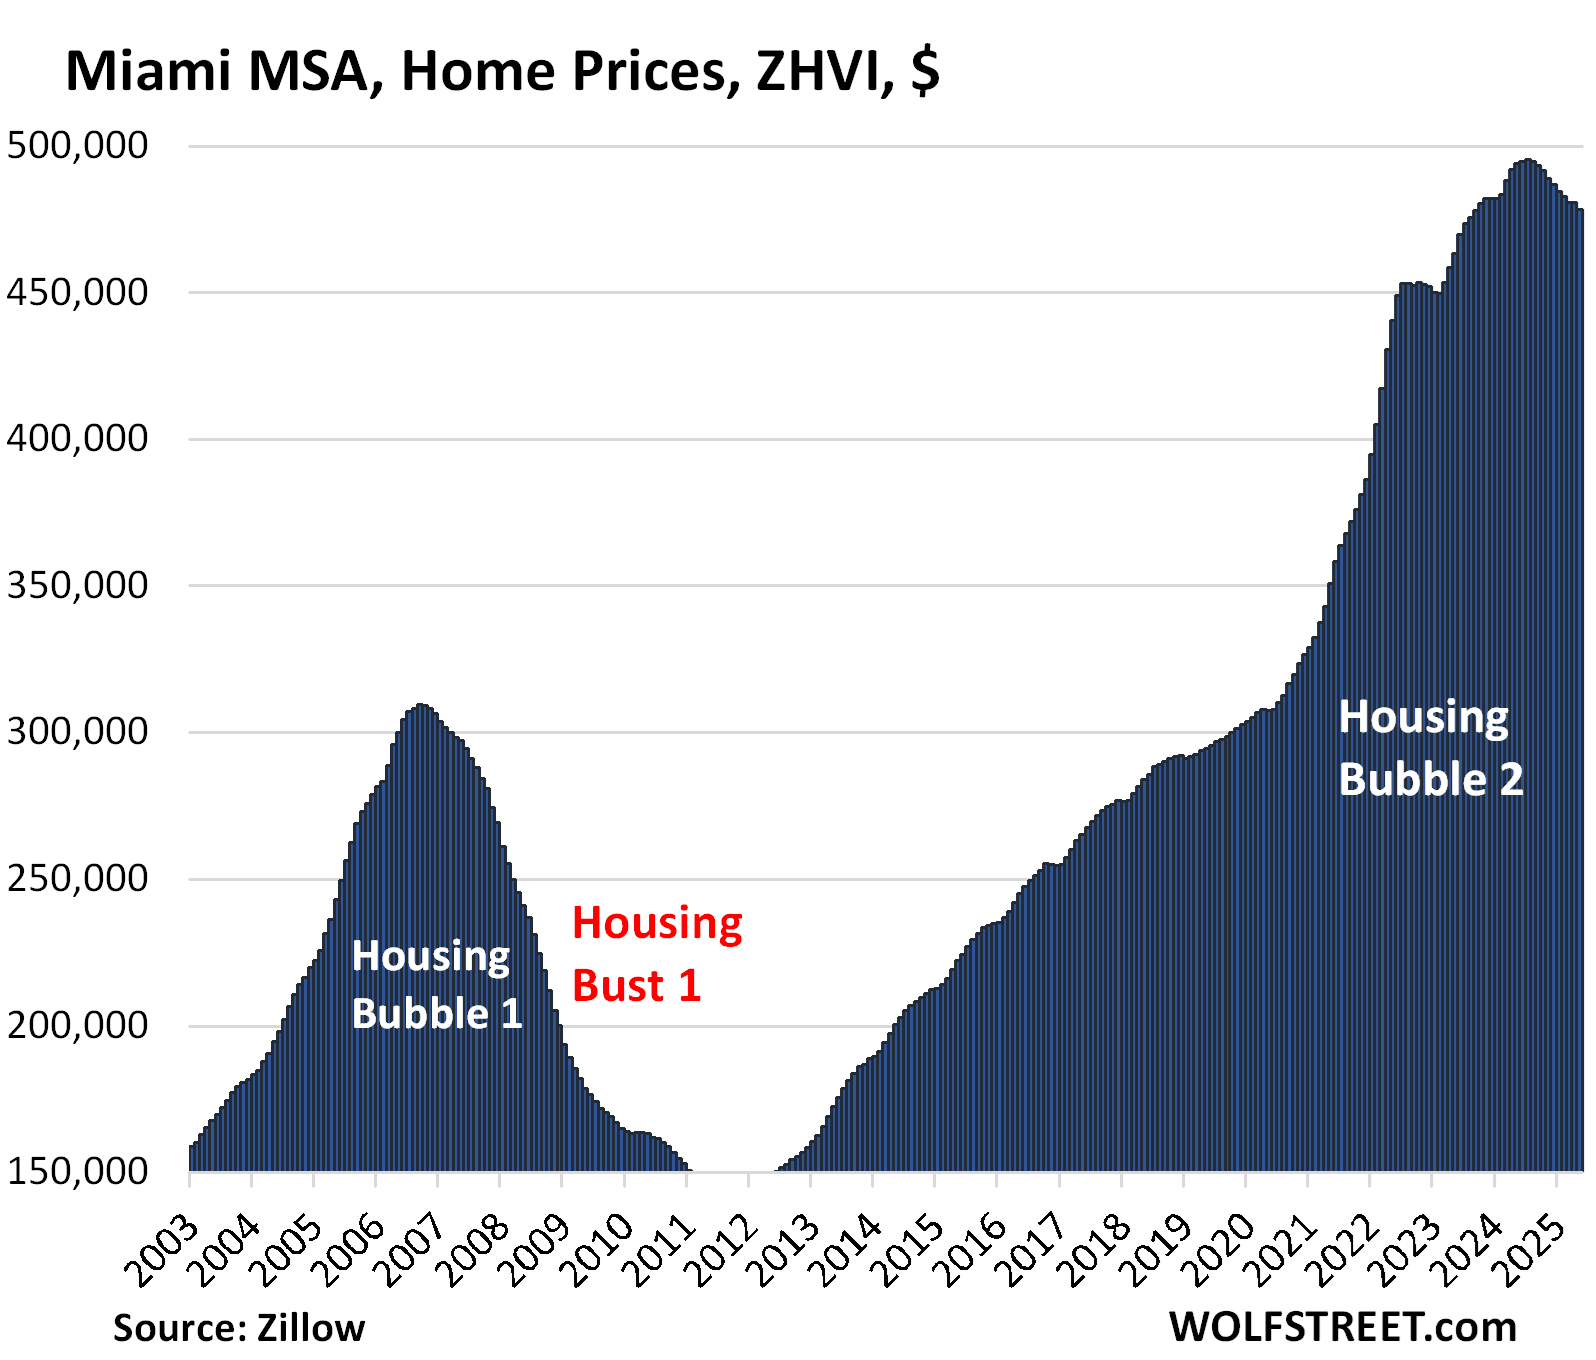
| Miami MSA, Home Prices | ||
| MoM | YoY | Since 2000 |
| -0.4% | -3.2% | 322% |
The YoY decline worsened from -2.3% in April and -0.2% in February. Since the high in July 2024, the index has dropped by 3.4%.
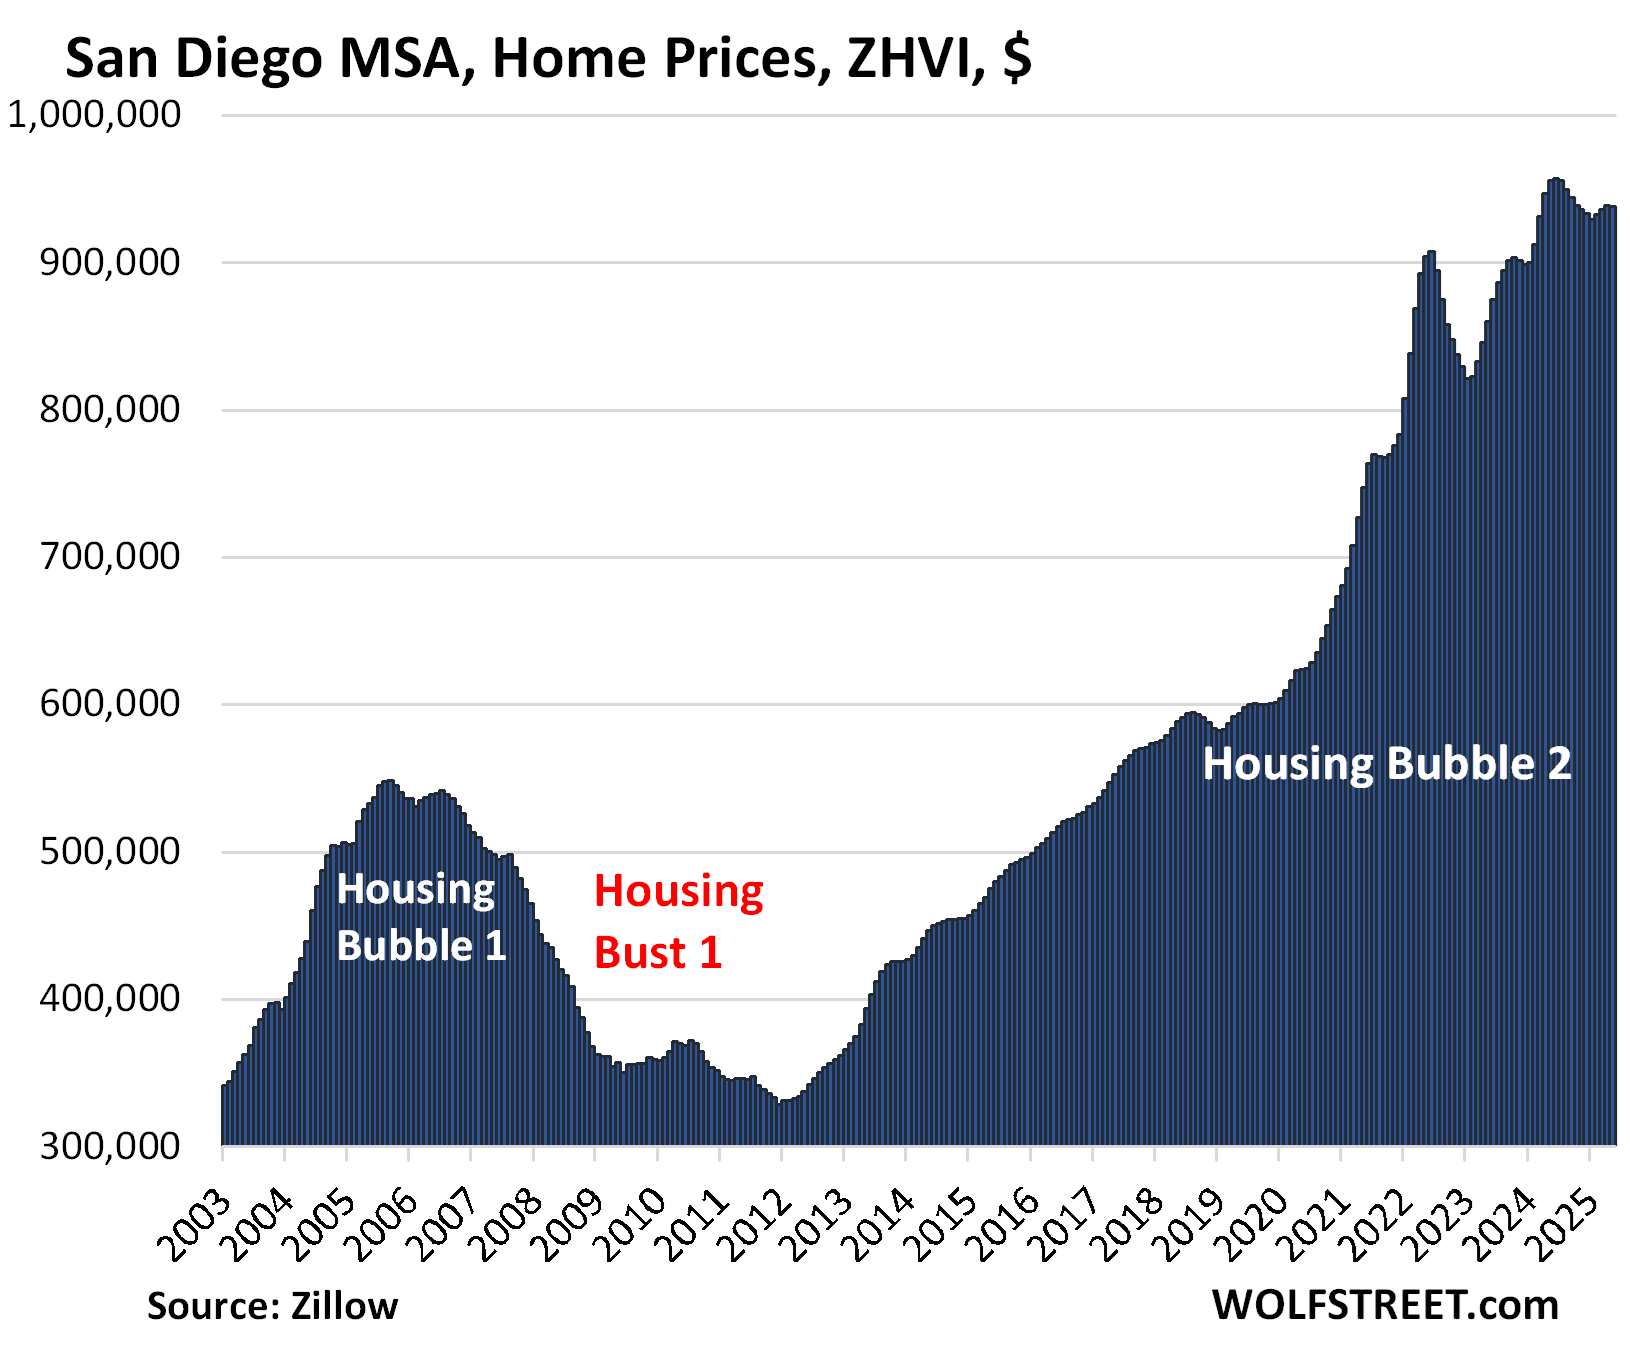
| San Diego MSA, Home Prices | ||
| MoM | YoY | Since 2000 |
| -0.1% | -1.9% | 335% |
The YoY decline worsened to -1.9% in May after having flipped to negative (-0.9%) in April from positive (+0.5%) in March.
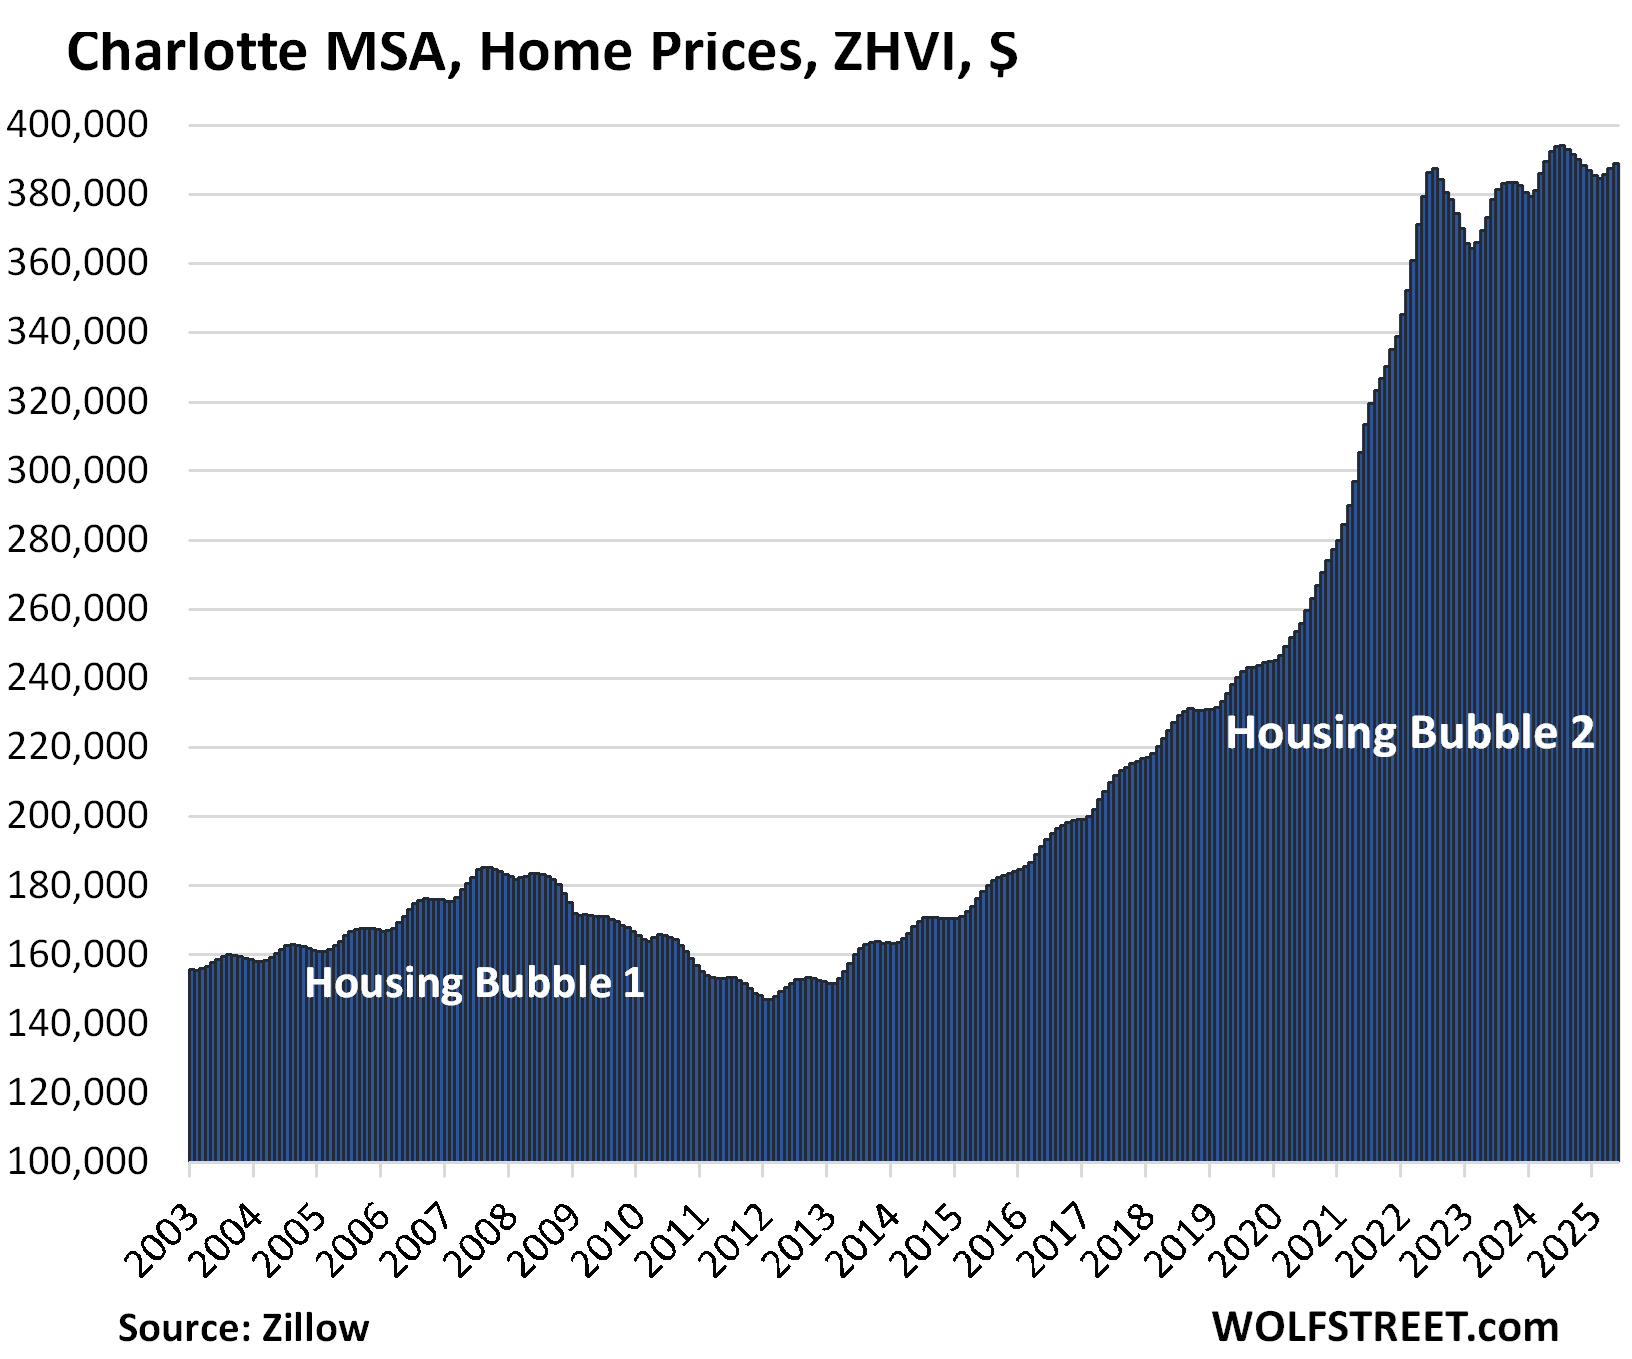
| Charlotte MSA, Home Prices | ||
| MoM | YoY | Since 2000 |
| 0.4% | -0.9% | 171% |
The YoY decline worsened from -0.6% in April after having flipped to negative in March.
The index is now just a hair above where it had been in mid-2022:
The 11 metros still up YoY and higher than in mid-2022.
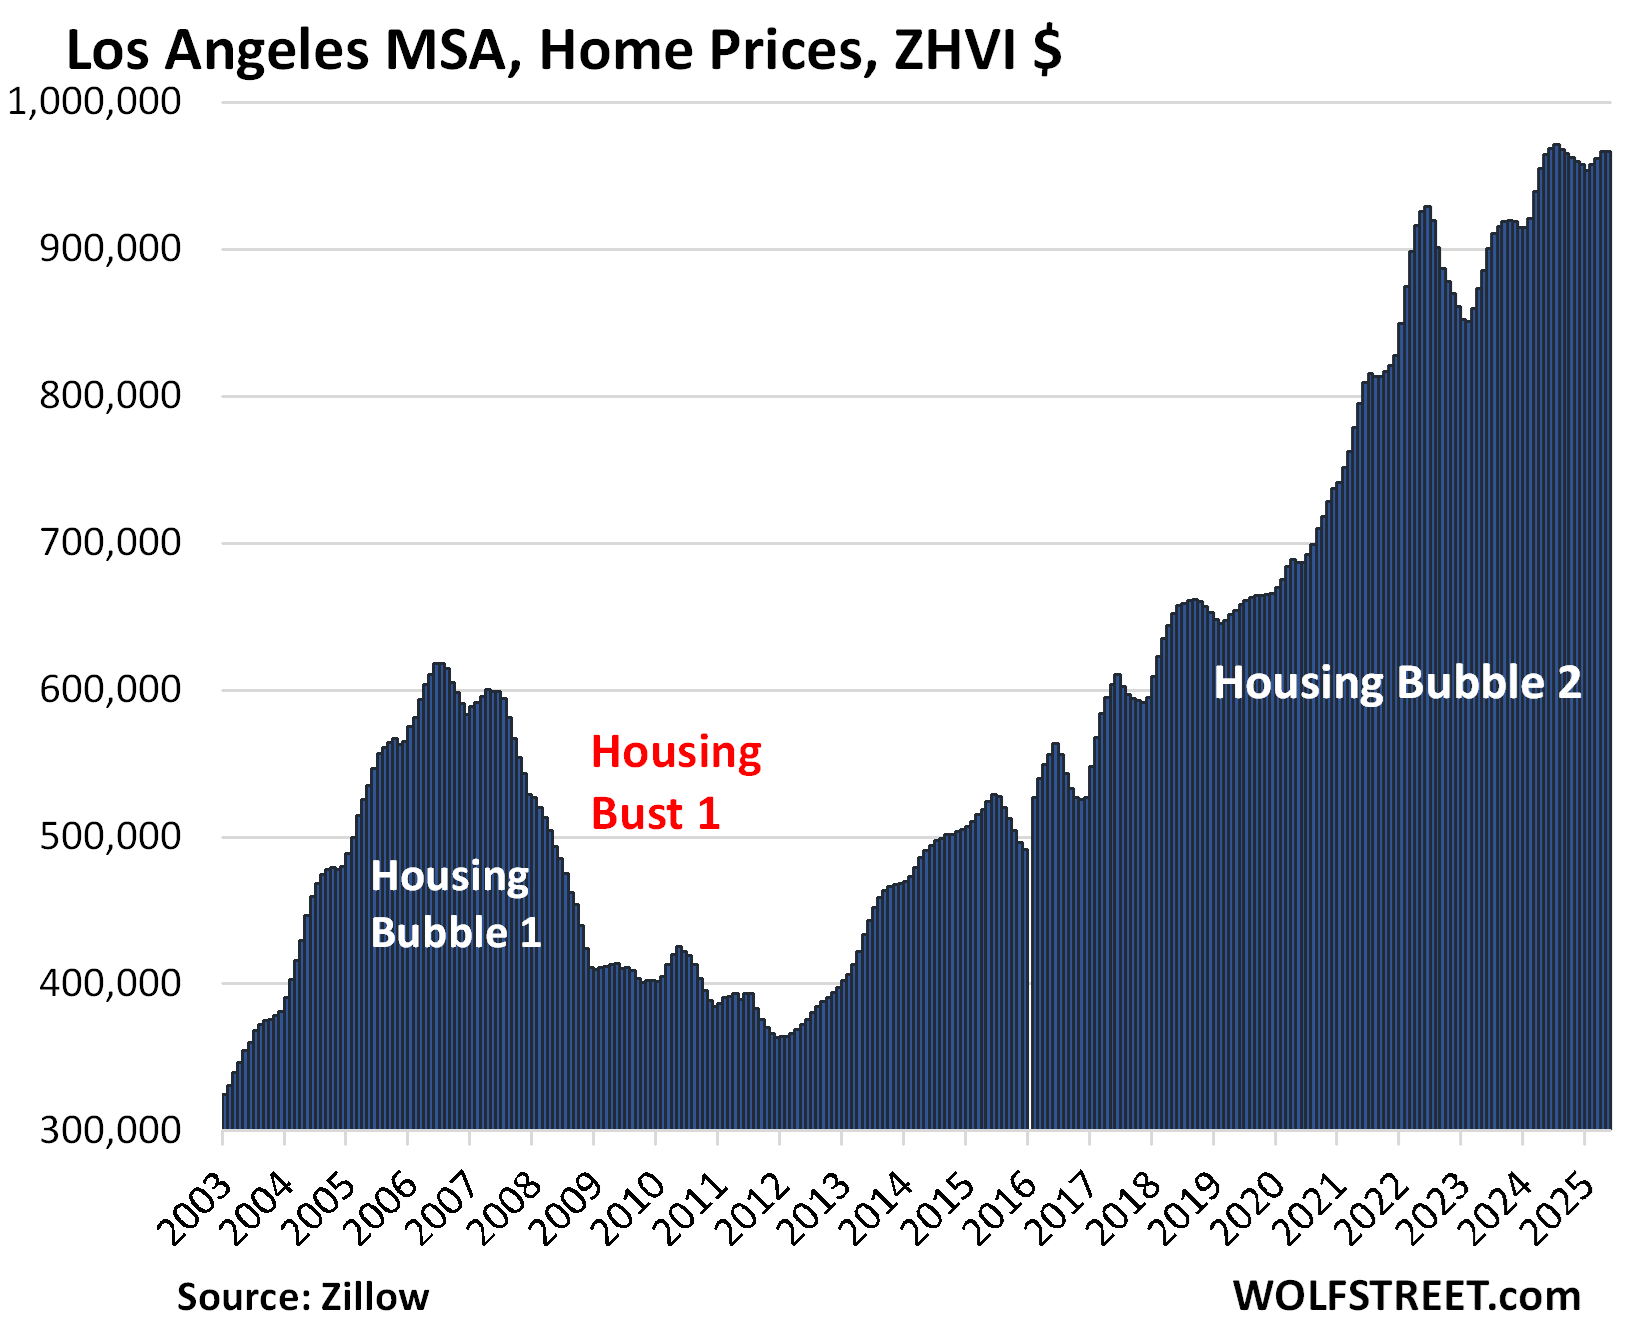
| Los Angeles MSA, Home Prices | ||
| MoM | YoY | Since 2000 |
| 0.0% | 0.2% | 333% |
The YoY gain nearly vanished, from +1.2% in April and +3.9% in February.
| San Jose MSA, Home Prices | ||
| MoM | YoY | Since 2000 |
| -0.8% | 0.8% | 348% |
The big drop in May whittled down the YoY gain to just 0.8% from +3.4% in April, +5.5% in March, and +7.6% in February.
And the index is essentially back where it had first been three years ago, in May 2022.
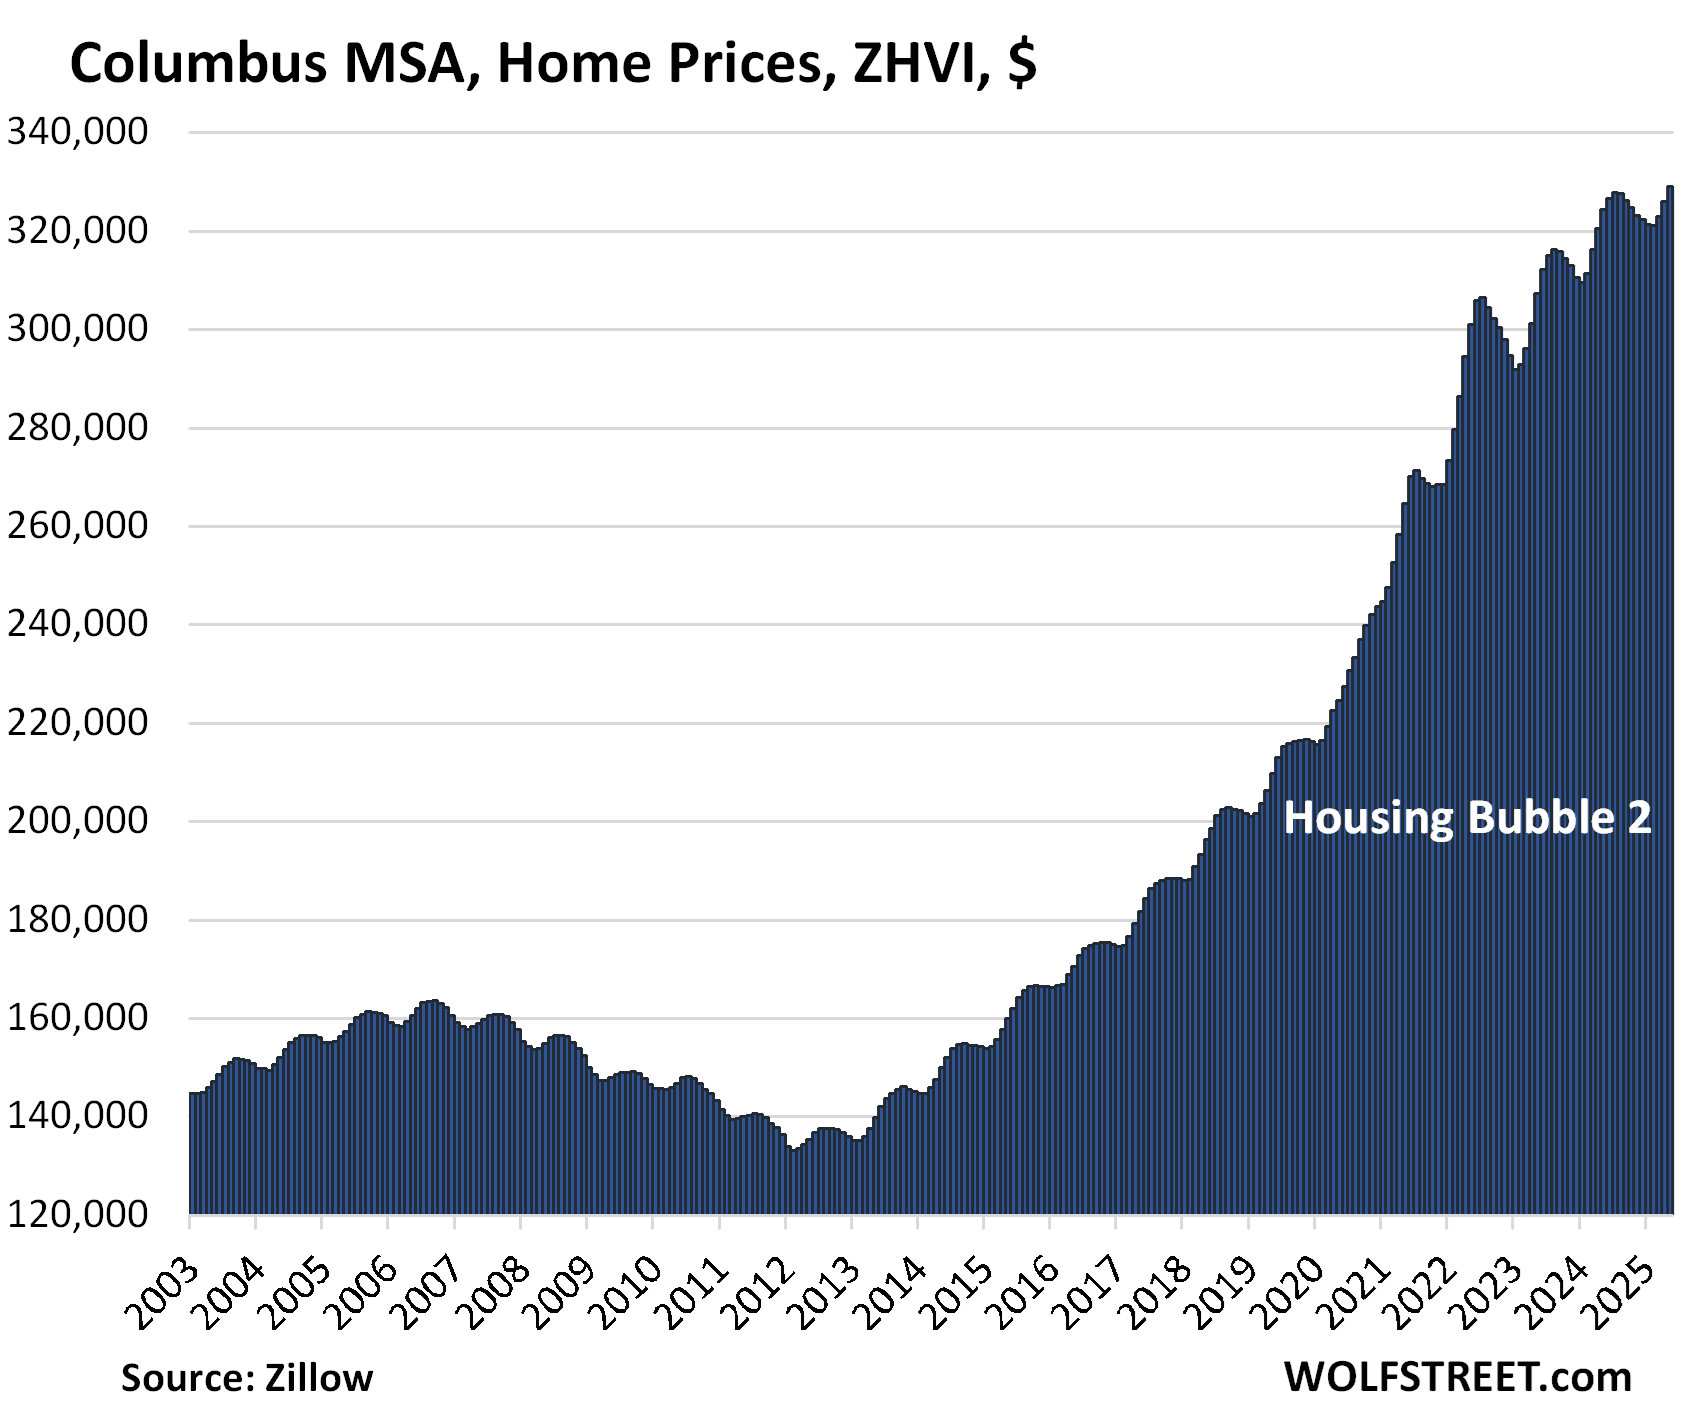
| Columbus MSA, Home Prices | ||
| MoM | YoY | Since 2000 |
| 0.9% | 1.5% | 158% |
The YoY increase shrank further, from +1.7% in April and from +3.1% in February.
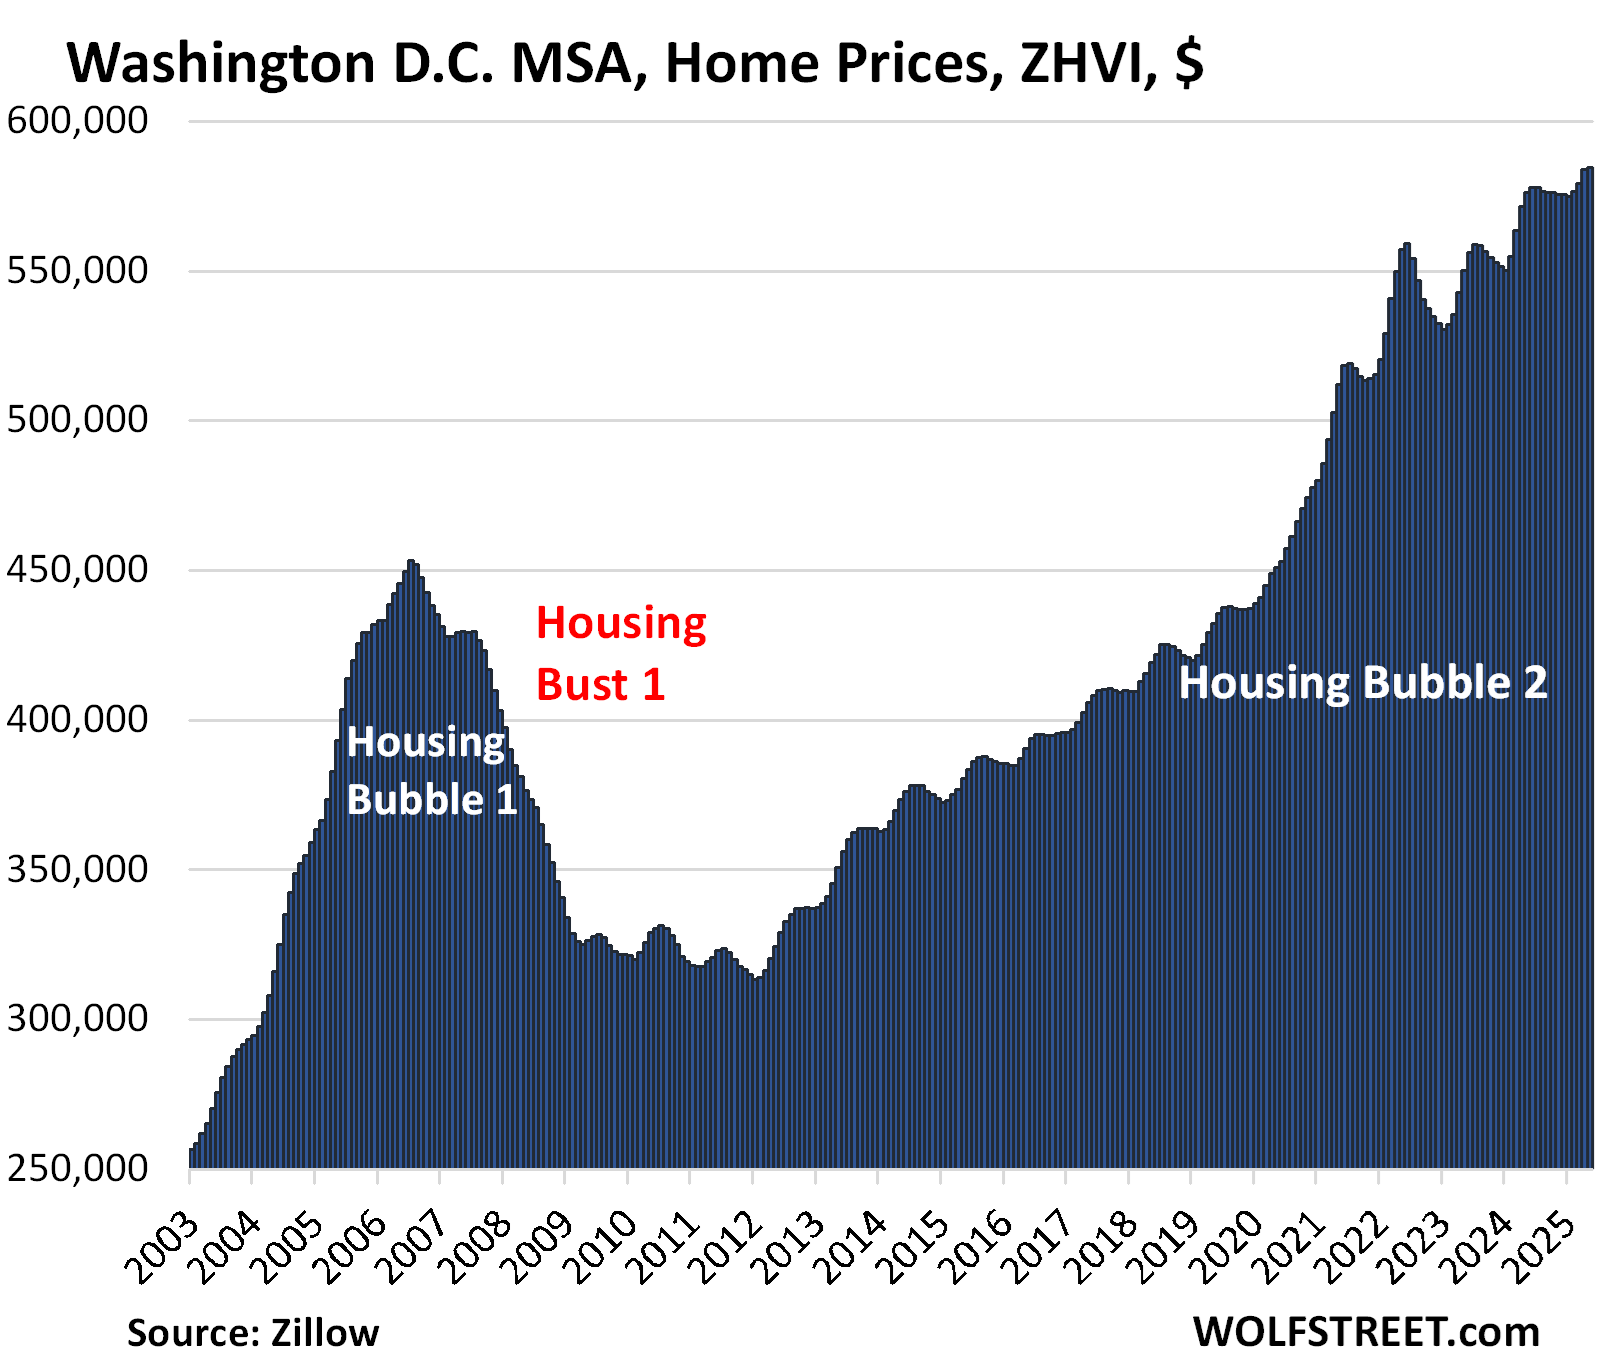
| Washington D.C. MSA, Home Prices | ||
| MoM | YoY | Since 2000 |
| 0.2% | 1.5% | 220% |
The YoY gain got whittled down further from +2.1% in April and +4.0% in February.
The metro includes Washington D.C. and parts of Maryland, Virginia, and West Virginia.
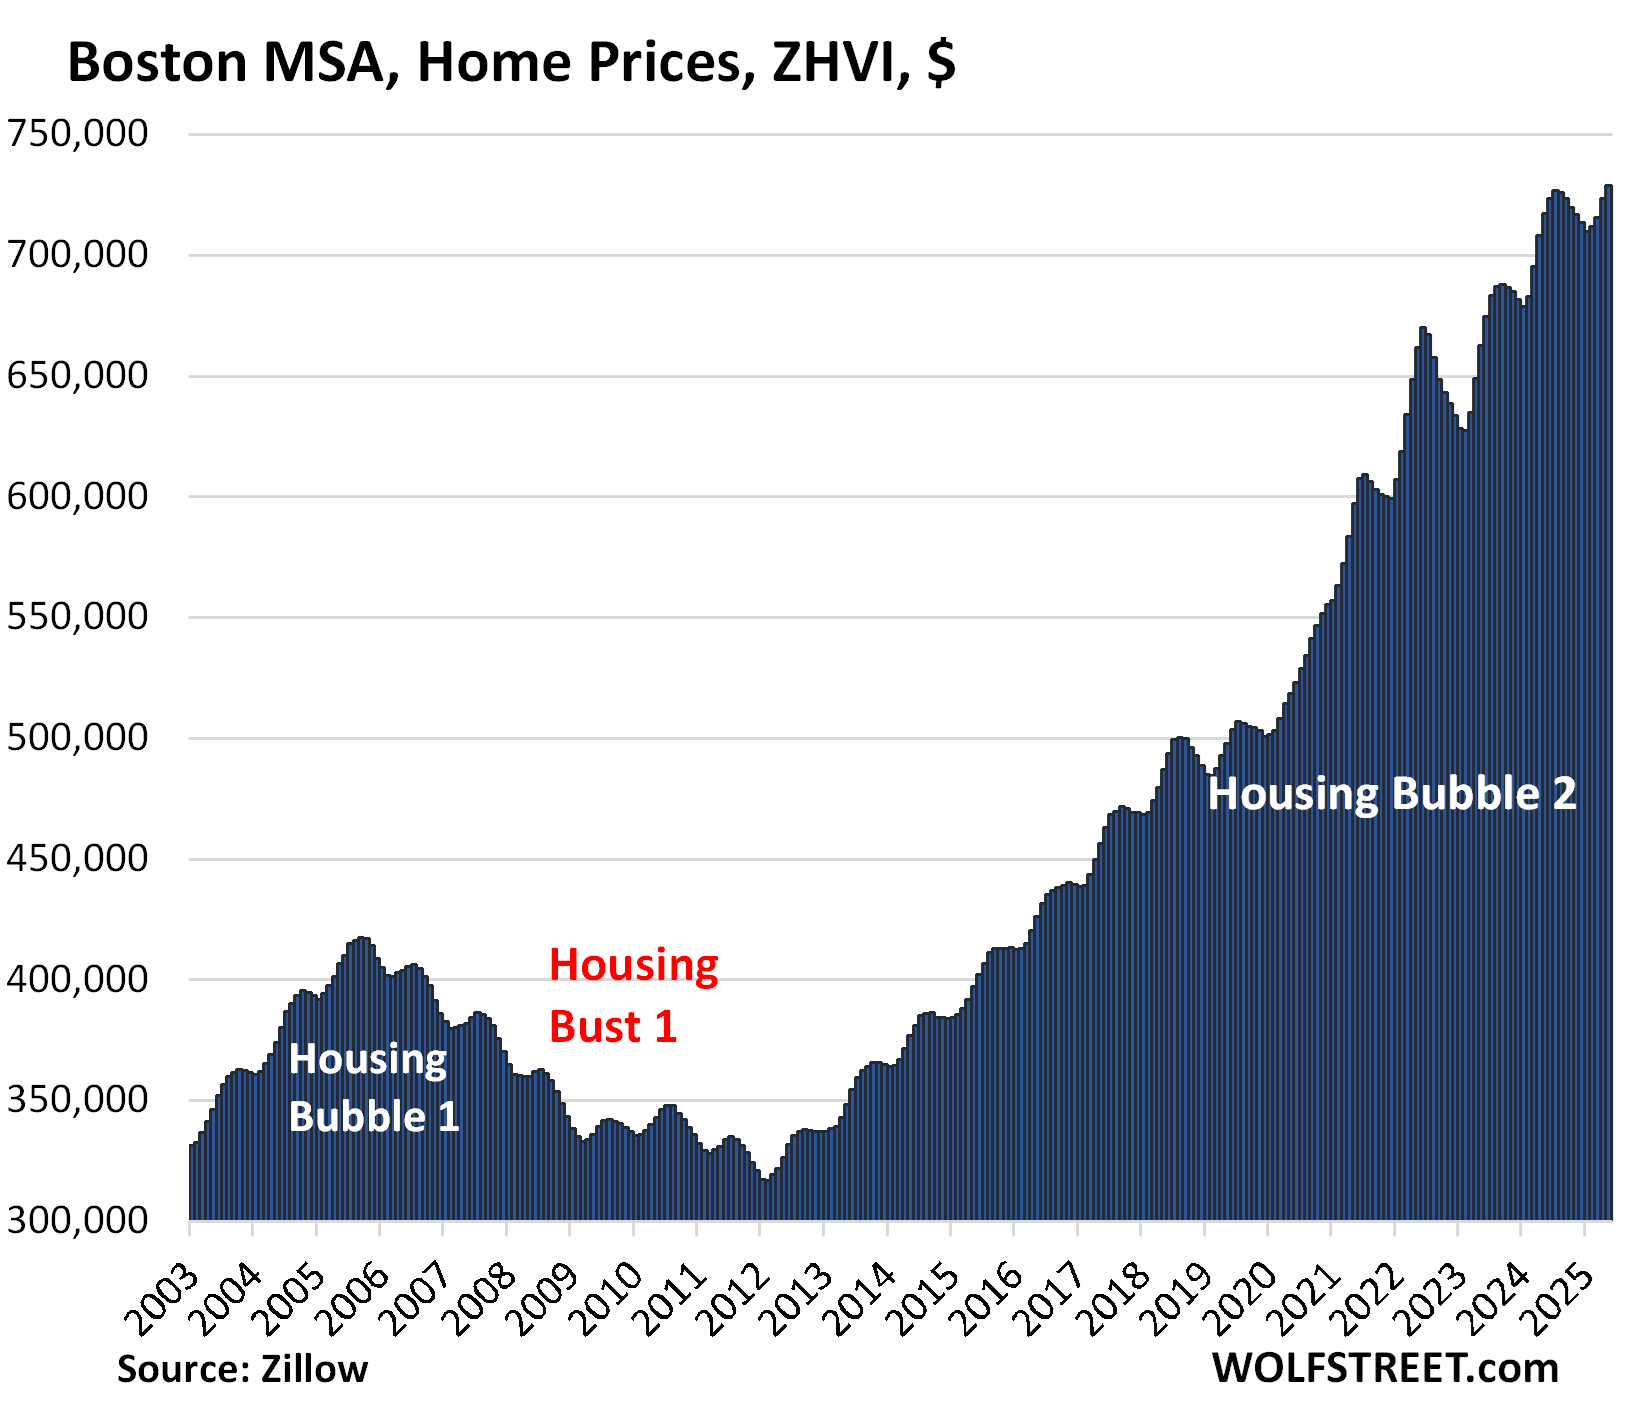
| Boston MSA, Home Prices | ||
| MoM | YoY | Since 2000 |
| 0.7% | 1.6% | 231% |
The YoY gain declined from +2.2% in April and +4.2% in February.
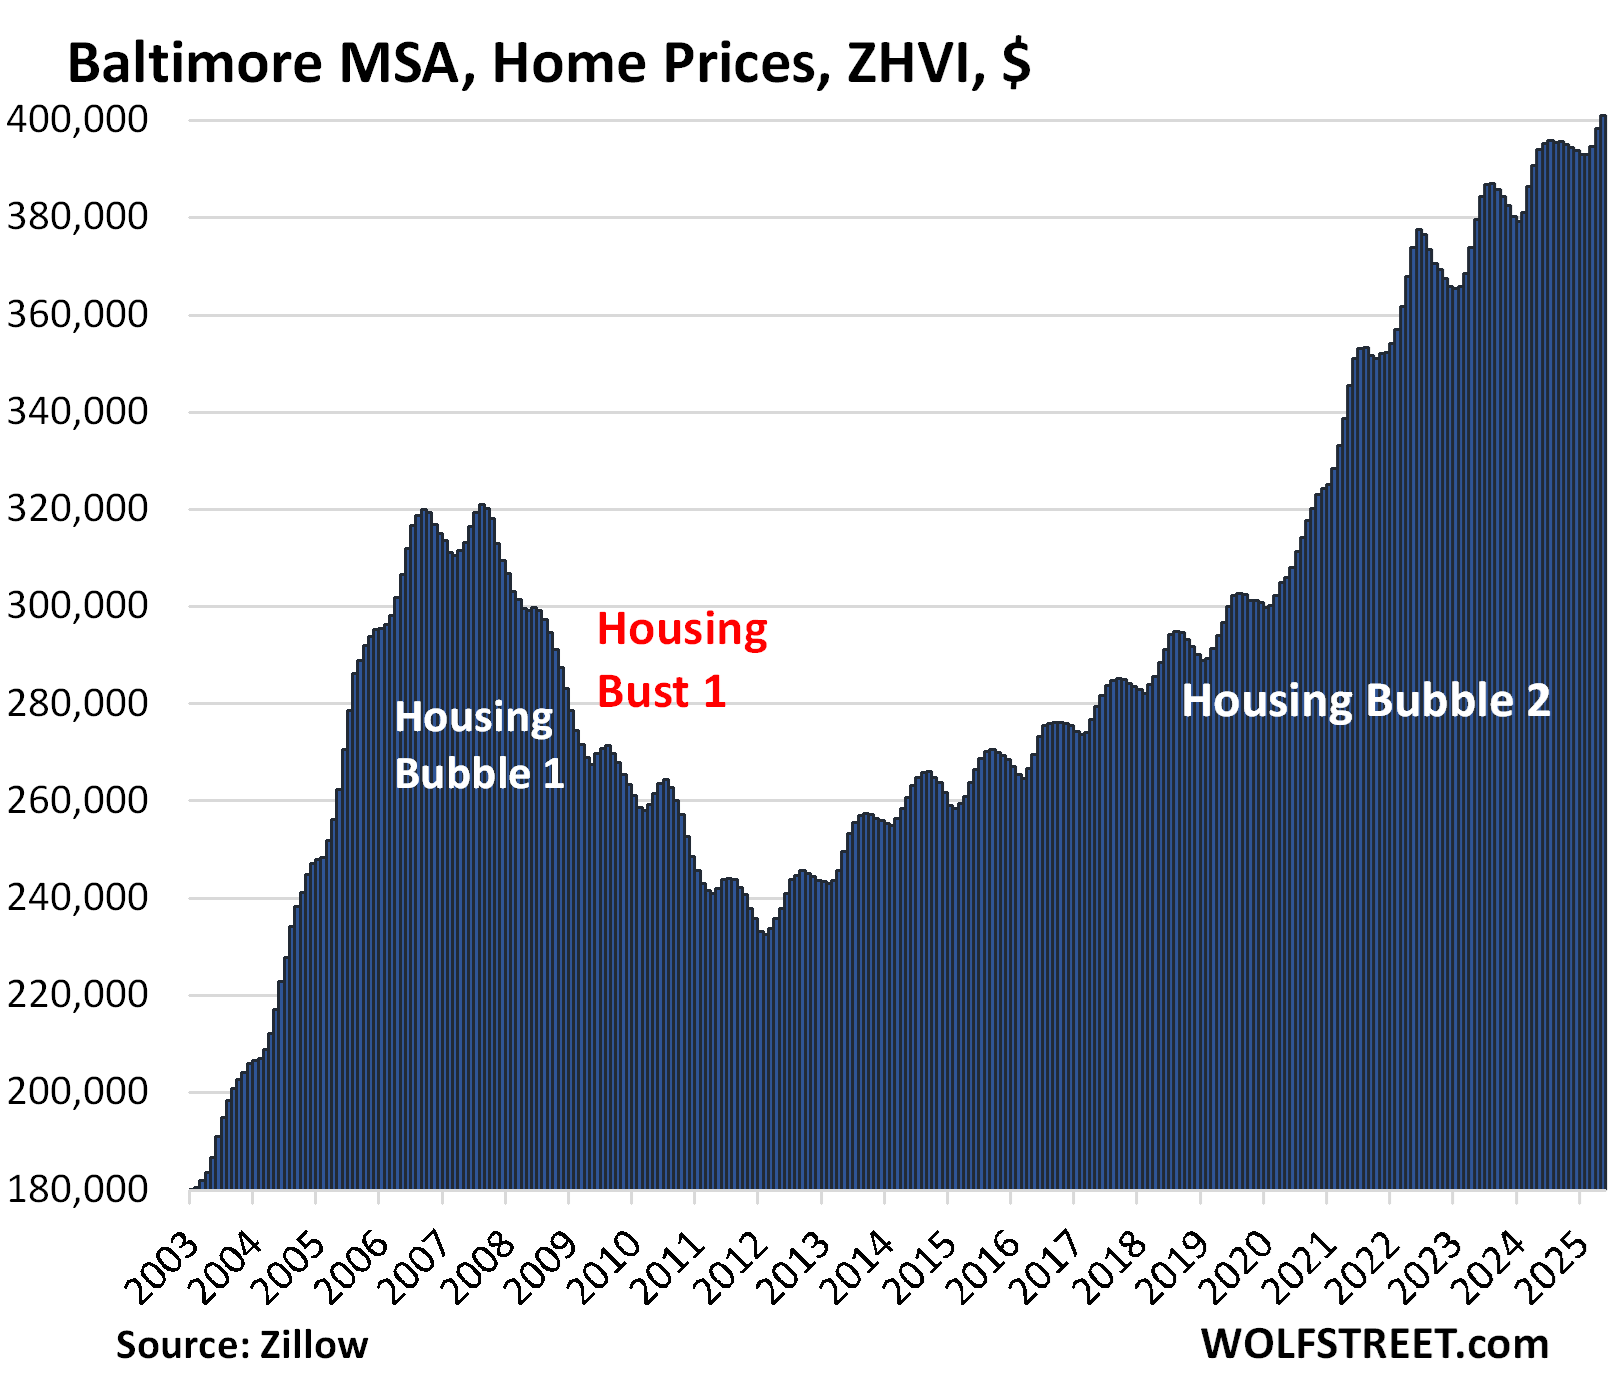
| Baltimore MSA, Home Prices | |||
| MoM | YoY | Since 2000 | |
| 0.7% | 1.8% | 178% | |
The YoY gain shrank from +1.9 in April and from +3.1% in February.
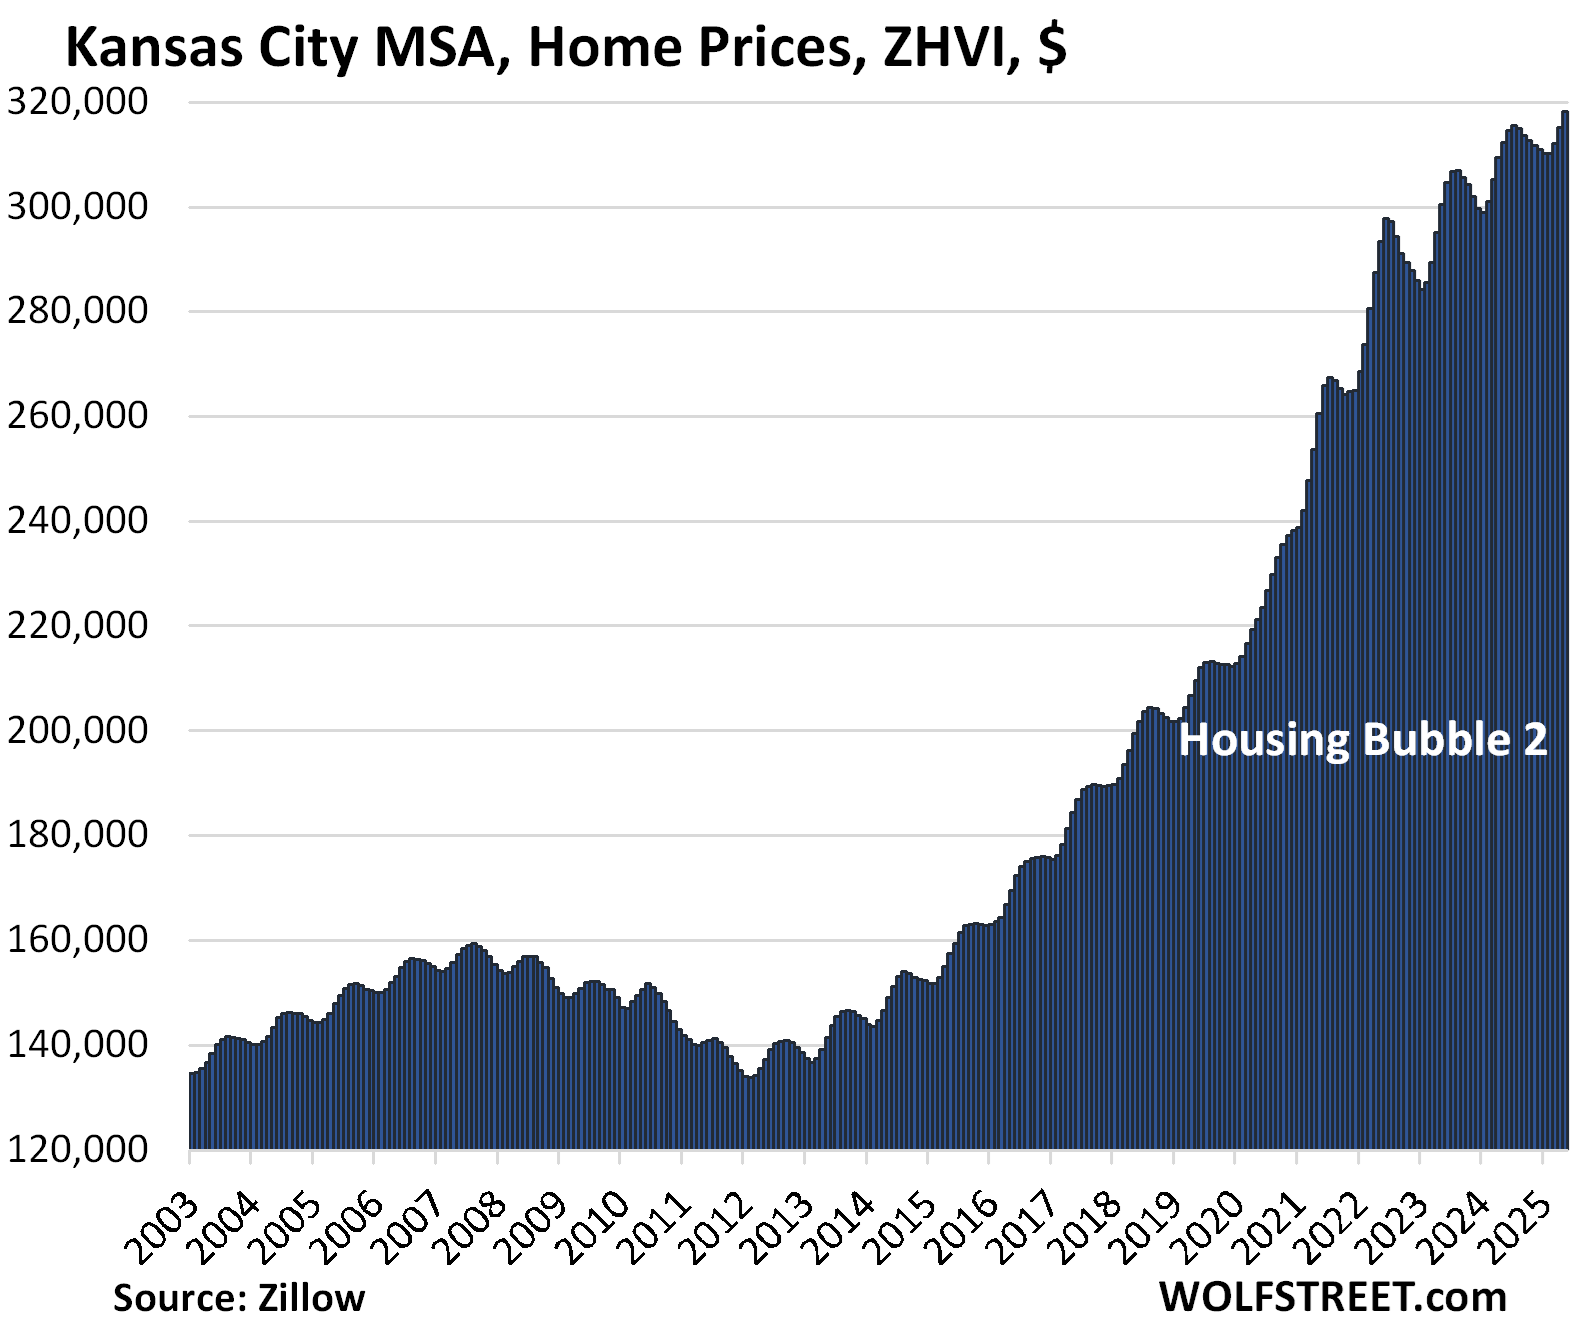
| Kansas City MSA, Home Prices | ||
| MoM | YoY | Since 2000 |
| 1.0% | 1.9% | 182% |
The YoY increase was unchanged from April and down from +3.1% in February.
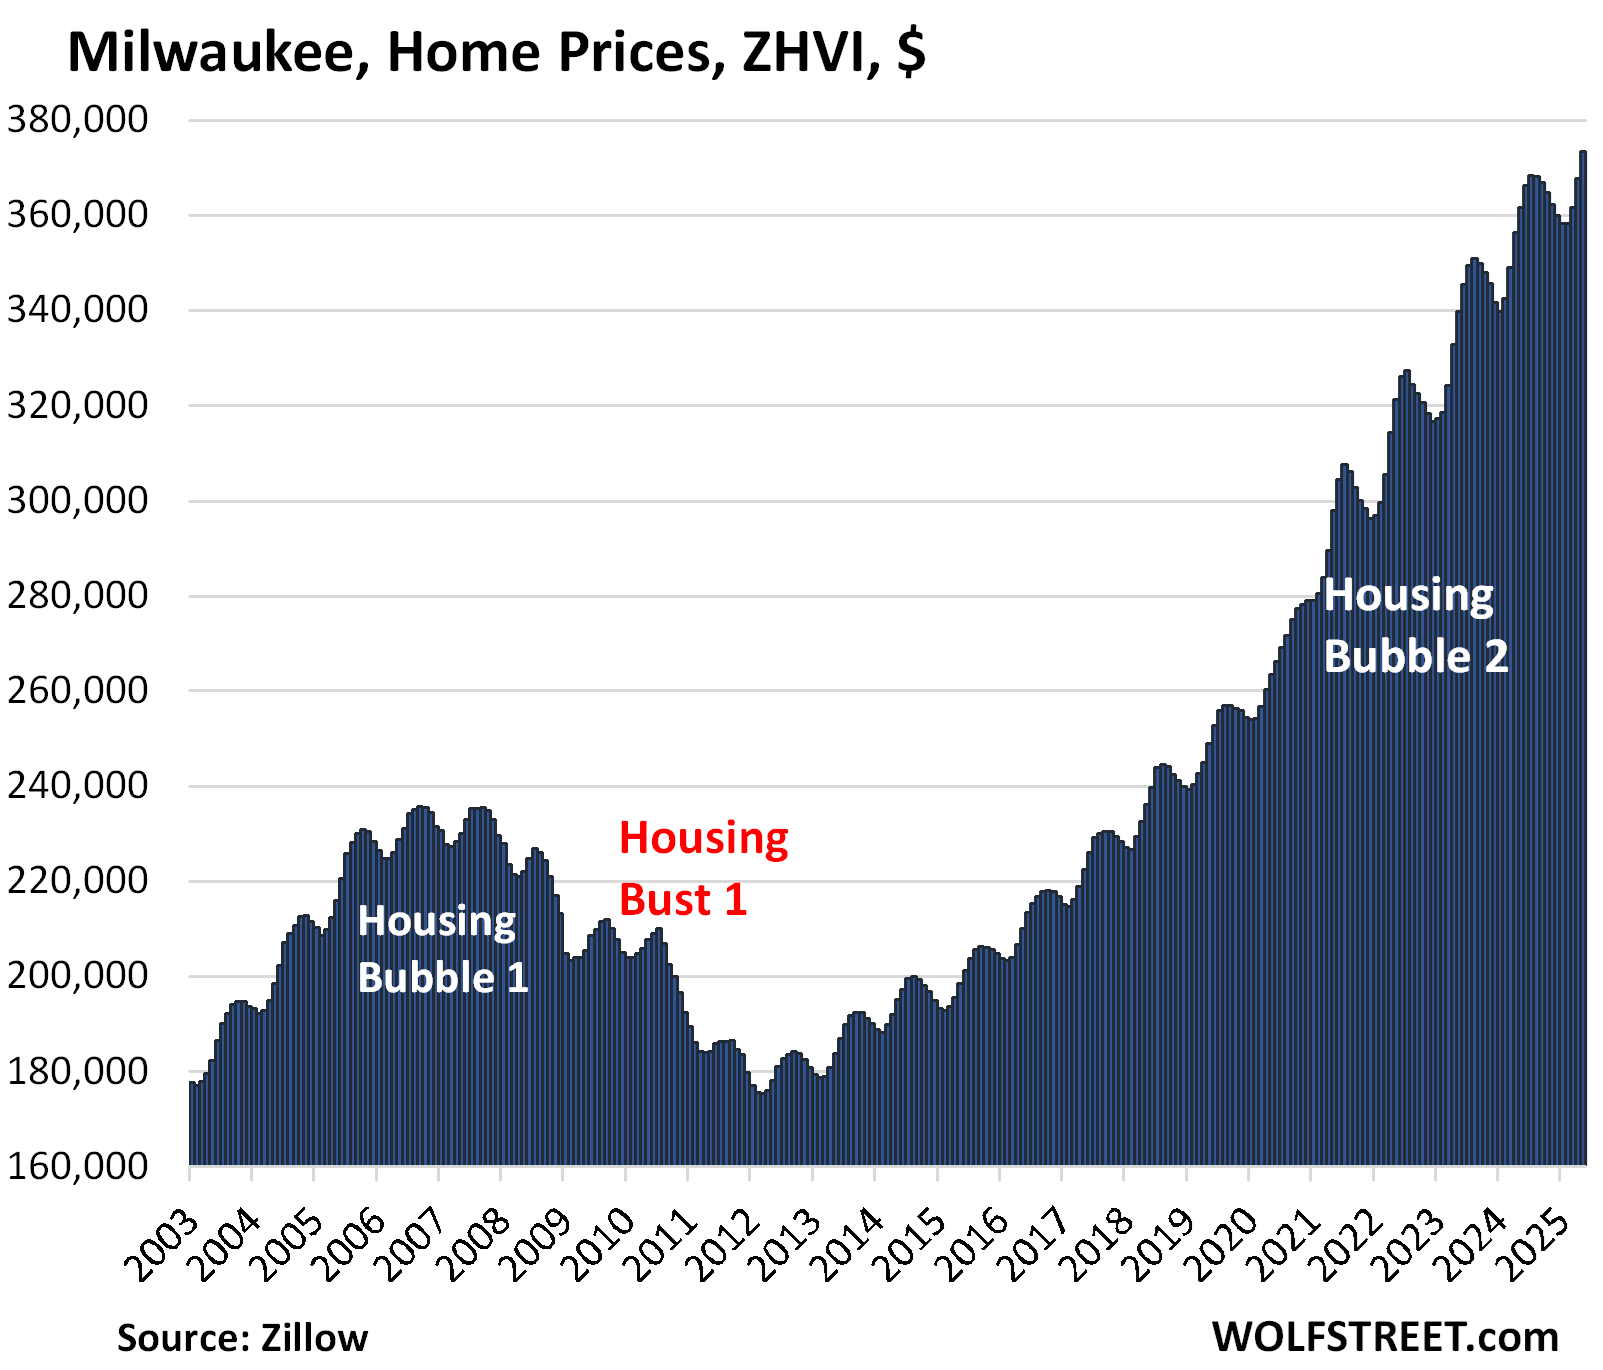
| Milwaukee MSA, Home Prices | ||
| MoM | YoY | Since 2000 |
| 1.5% | 3.2% | 151.3% |
The YoY gain was unchanged from April and declined from +4.7% in February.
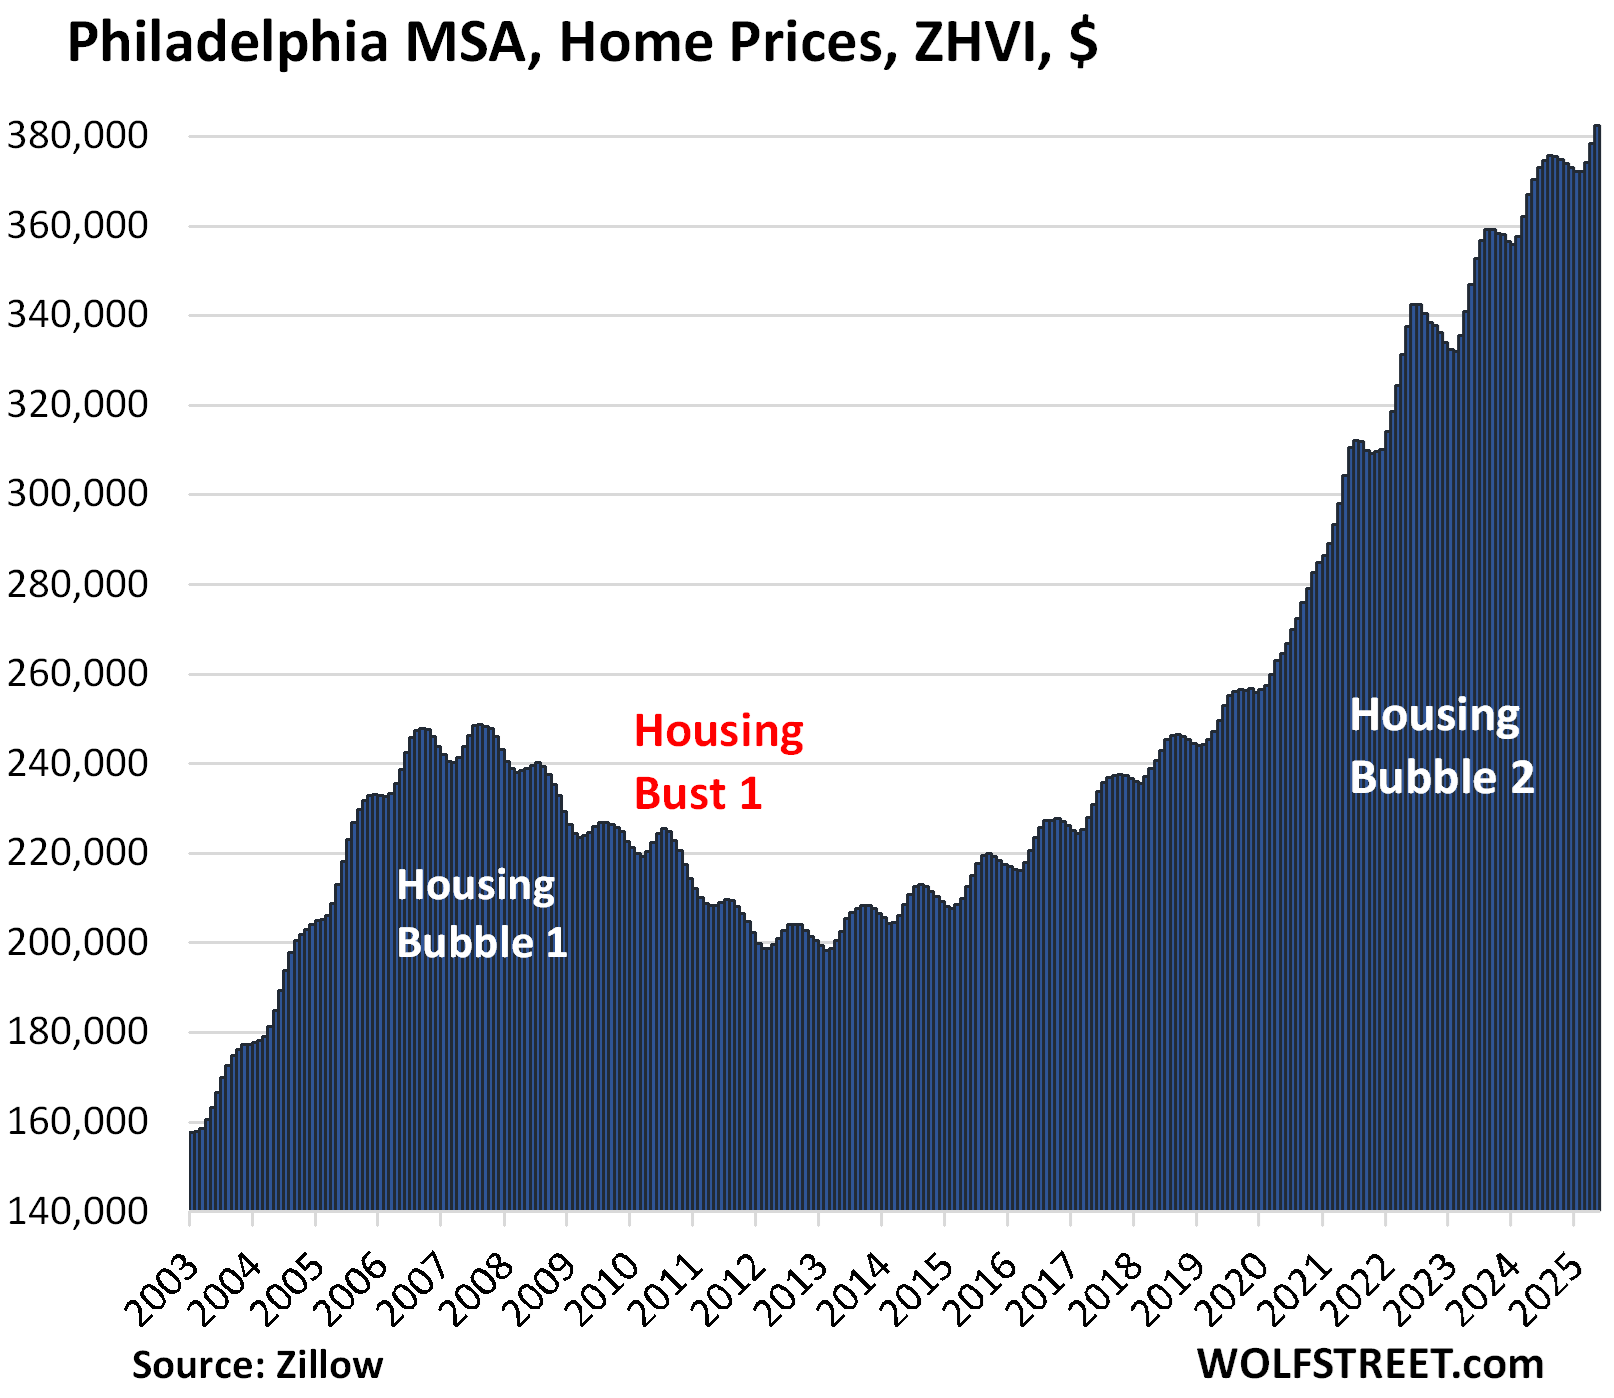
| Philadelphia MSA, Home Prices | ||
| MoM | YoY | Since 2000 |
| 1.0% | 3.3% | 207% |
The YoY gain increased a hair from 3.1% in April but declined from +4.1% in February.
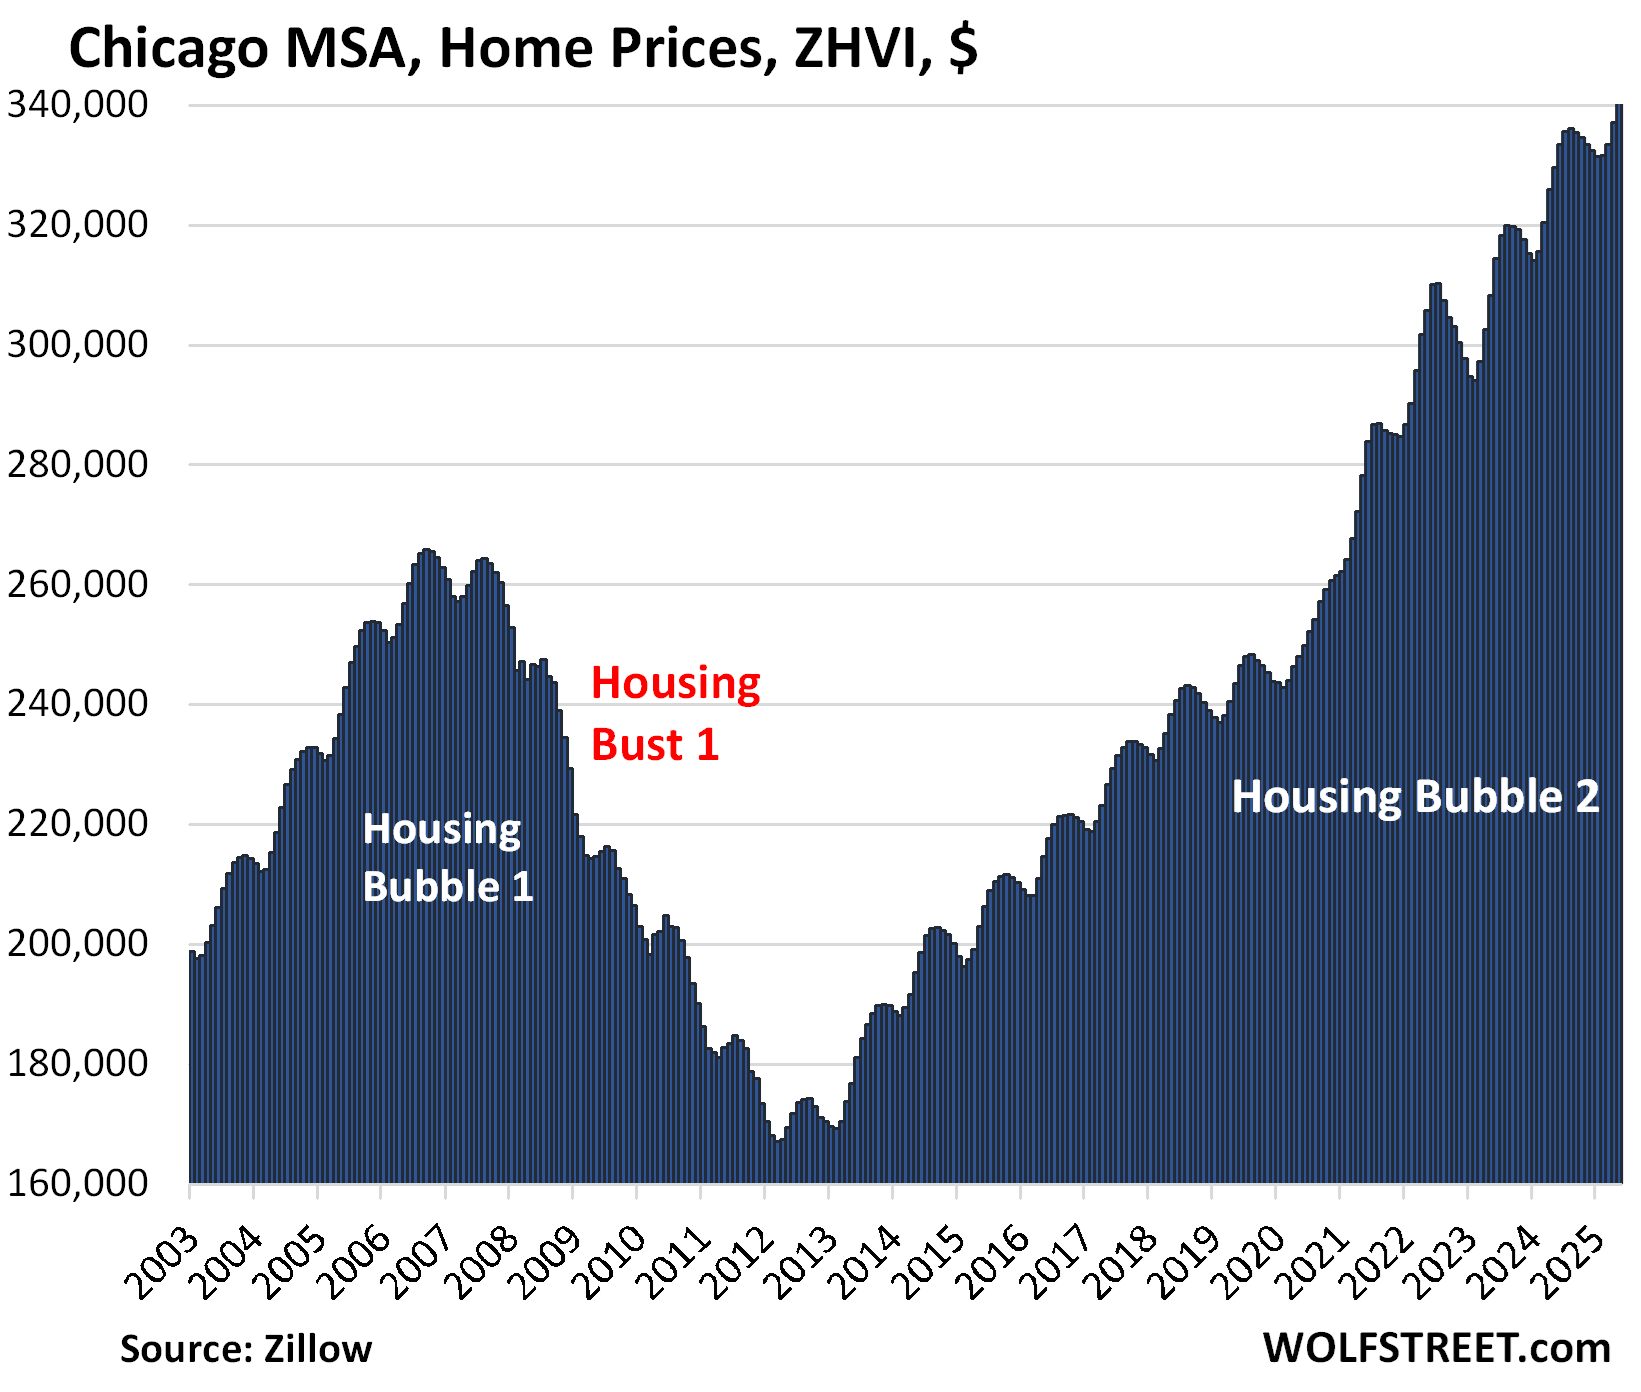
| Chicago MSA, Home Prices | ||
| MoM | YoY | Since 2000 |
| 1.1% | 3.3% | 117% |
The YoY gain declined from +3.4% in April and +5.1% in February.
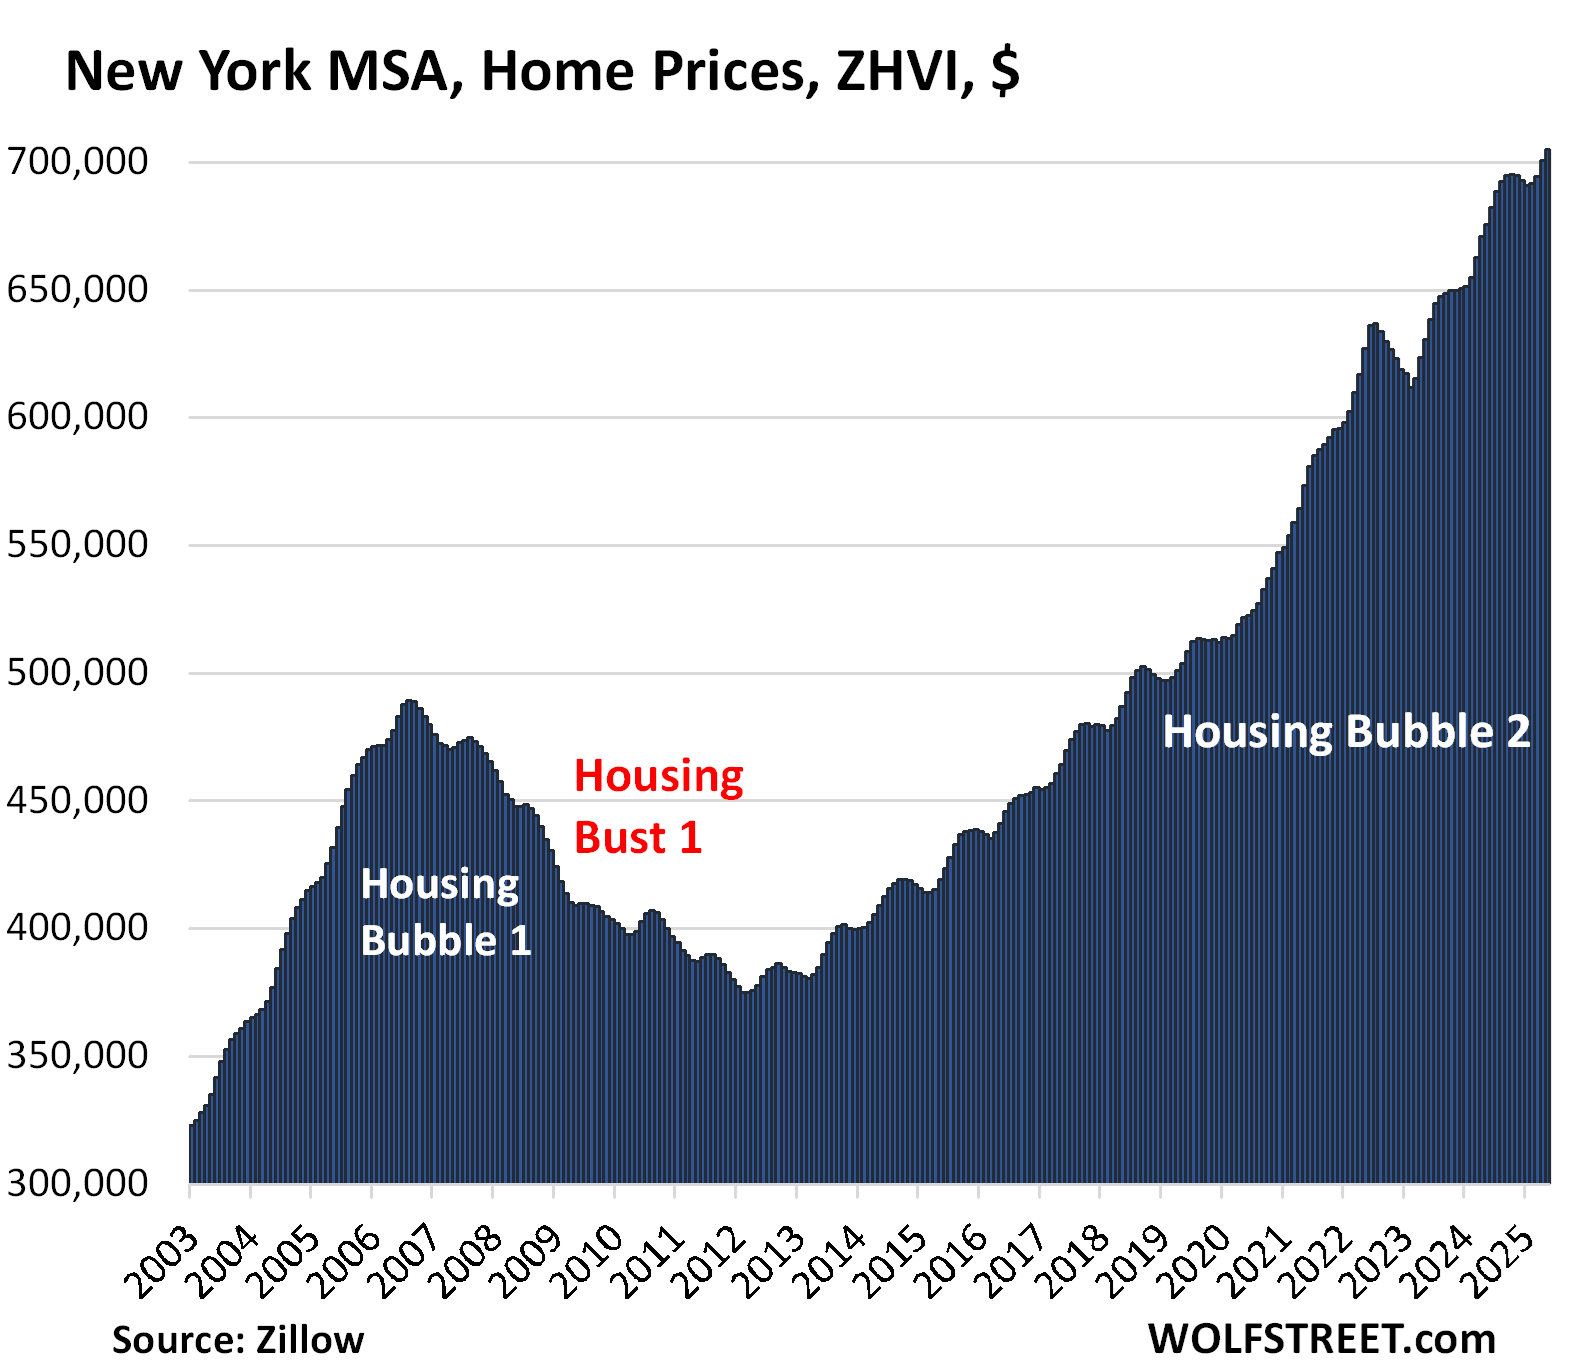
| New York MSA, Home Prices | ||
| MoM | YoY | Since 2000 |
| 0.6% | 4.3% | 216% |
The YoY gain declined from +4.4% in March and +5.6% in February.
Enjoy reading WOLF STREET and want to support it? You can donate. I appreciate it immensely. Click on the mug to find out how:

![]()
Everytime I see Austin’s chart and the resemblance to a ever growing middle finger is quite hilarious and fitting for all the sellers that are still asking and dreaming of 2022. Also a big F up to all the buyers that bought at the FOMO top.
On the other hand, at least the direction is looking good but the chart of LA is still painfully like looking at paint dry…in due time, can only hope for “It occurs first very slowly, then all at once” or give me something that resemble Austin’s chart please
From these charts, it looks like a bubble with some staying power to me.
“Bubble” yes, by definition. “Staying power” has already vanished in a bunch of markets. That’s what the charts are for, so you can see it market by market.
Housing Bubble 1 peaked in late 2006 early 2007, depending on locale, and bottomed out in 2012, roughly 6 years later. We are still in the early rounds of price declines. Though I do not anticipate as drastic a decline in prices, I also do not own a crystal ball.
Based upon the near record low affordability index, there is plenty of room to roam to the downside.
Regarding the Housing Affordability Index (HAI) for single-family homes, there are reports that it has recently been near or at record lows, though the specific timeframe and exact numbers may vary depending on the data source:
Near Historic Lows: Some reports from early 2024 indicate that housing affordability remains near its lowest level in over a decade.
National Association of Realtors® (NAR) Perspective: The NAR reported that the Housing Affordability Index in July 2023 was at its lowest level in data going back to 1989.
California Specifics: While affordability remains low in California, the first quarter of 2025 saw a slight increase from late 2024.
Why buy a house when squatters can effectively steal it by changing the locks while you are away on a week long vacation? And I say “effectively” because the cops won’t remove them until you get a court date and “prove” that the counterfeit lease they hold using your signature that they forged from publicly available electronic county documents is fake.
It’s a good thing most people don’t believe everything they read on the Internet. 65% of the people ignore those stories and buy a house anyway.
Ummm put a house alarm with cell phone backup then call the popo immediately?
Evidence that this has happened, or is this some white male American anxiety? No one believes this actually happened.
Happened with a house we were working
On. Squatters were arrested for trespassing. At least in my little slice of flyover common sense still prevails.
The question is when does, or will, “Housing Bust 2” make an appearance?
These charts should be plotted with the idiocy of QE and ZIRP by the Fed starting in 2007. They are the real reason behind the insane asset price increases. But of course the financial media will never focus on the real culprit. They did the same thing in the seventies. Have lived thru both debacles and they will never change. Powell needs to put on some Volcker big boy pants and stay the course.