Something rare occurred: Auto loan balances fell despite highest new & used vehicle sales in years. More people paid cash to dodge interest rates?
By Wolf Richter for WOLF STREET.
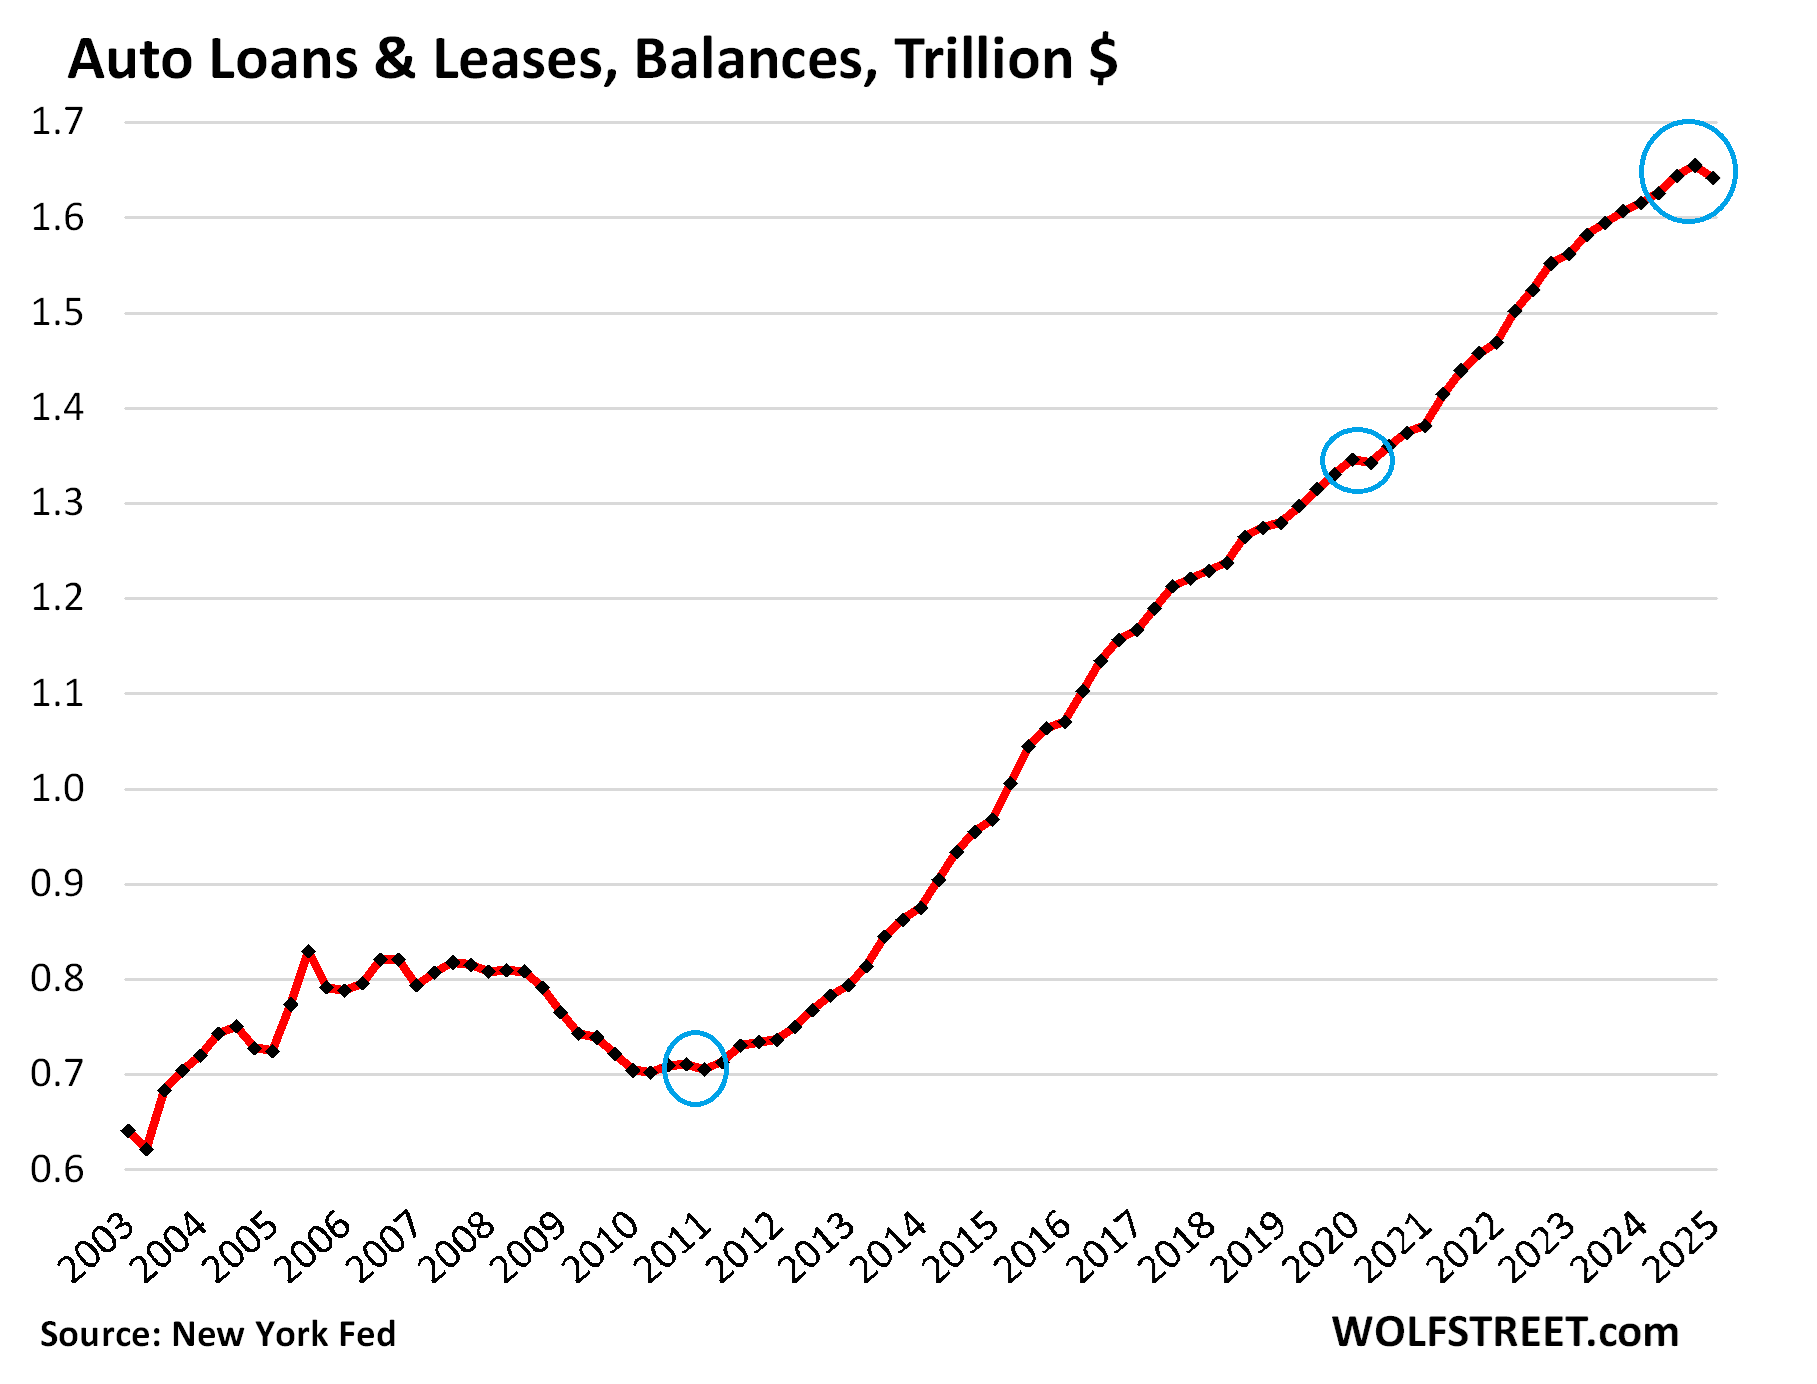
Total balances of auto loans and leases for new and used vehicles fell by $13 billion, or by 0.8%, in Q1 from Q4, the first quarter-to-quarter decline since Q1 2020, and only the second since Q1 2010 just after the Great Recession, according to the New York Fed’s report on consumer credit.
The prior two times, auto loan balances declined because in Q1 2020, sales plunged by 12.8% year-over-year; and Q1 2010 followed a 35% collapse of new-vehicle sales in 2008 and 2009 and was the final quarter of a big decline in auto loan balances.
But this time, loan balances declined despite strong demand: New vehicles sales booked the best Q1 since 2019, and used vehicle sales booked the best Q1 in years. Maybe a sign of strength: Lots of used-vehicle buyers pay cash. And the share of cash buyers has been rising (to dodge the interest rates?), reaching 63.5% in Q4, from 61.3% a year earlier, and from 58.4% two years earlier, according to Experian.
The burden of auto loans and leases.
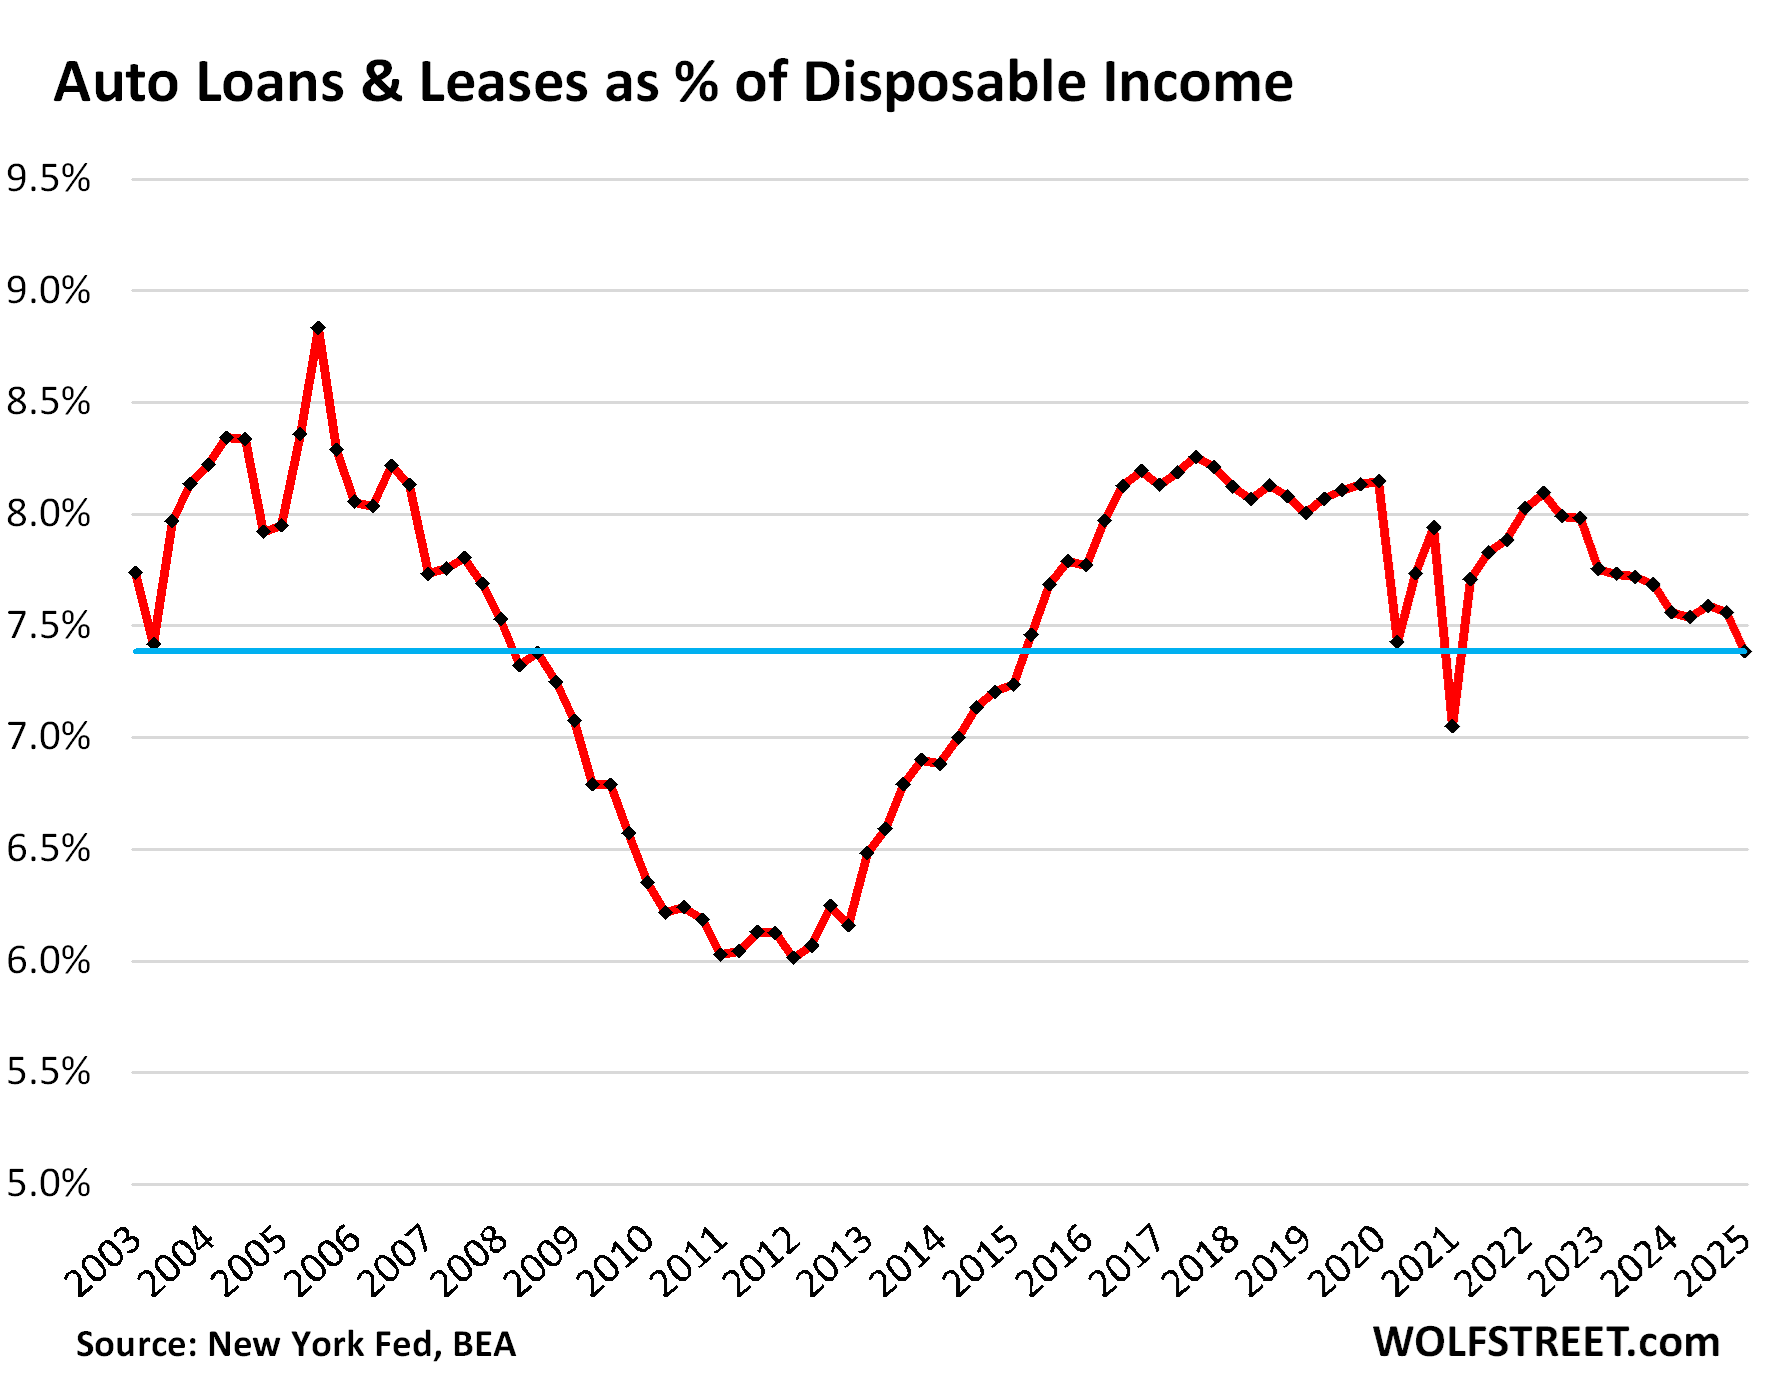
Debt-to-income ratios and debt-to-cash-flow ratios are classic measures of borrowers’ ability to deal with the burden of their debt. With households, a metric of cash flow is “disposable income,” which represents the cash households have available, after payroll taxes, to spend on housing, debt payments, food, fuel, and other expenses.
Disposable income is household income from all sources except capital gains, minus payroll taxes: So income from after-tax wages, plus income from interest, dividends, rentals, farm income, small business income, transfer payments from the government, etc.
Disposable income rises with higher incomes at individual households and with more people working and making money (population/job growth):
- QoQ: disposable income +1.6%, auto debt: -0.8%.
- YoY: disposable income +4.0%, auto debt: +2.6%.
Due to the decline in auto loan balances in Q1 and the increase in disposable income, the debt-to-income ratio fell (improved) to 7.4%:
Serious delinquency rates: total, subprime, and prime.
The 60-plus day delinquency rate for all auto loans and leases fell to 1.51% in March, from 1.64% in February and 1.66% in January, per Equifax data. Compared to a year ago, it was up a hair (1.47% in March 2024), and the difference would have gotten lost in rounding to 1.5%. During the Free-Money era of the pandemic, delinquency rates had dropped below 1% (red in the chart below).
Subprime is always in trouble which is why it’s “subprime.” Fitch, which rates asset-backed securities (ABS) backed by auto loans, publishes the delinquency rates for auto loans that are prime-rated at the time of origination (blue in the chart below) and auto loans that are subprime-rated at origination (gold in the chart below).
Fitch’s subprime 60-day-plus delinquency rate declined to 6.07% in March along seasonal patterns (peaks in January or February). Compared to a year ago, it was 45 basis points higher.
Of all loans and leases outstanding, only 14.1% were subprime and deep-subprime rated at origination, according to Experian data.
Nearly all subprime auto loans financed the purchase of used vehicles, mostly older used vehicles sold by specialized subprime dealer-lender chains, or financed by specialized subprime lenders. Lenders package these subprime auto loans into ABS and sell these bonds to pension funds and other institutional investors that buy them for their higher yield. It’s a small specialized high-risk-high-profit part of auto lending. When losses occur, they’re spread across investors that got paid to take those losses, not banks.
Subprime means “bad credit” at the time of origination – a history of being late in paying obligations, or not paying them at all. It does not mean “low income.” Low-income people have trouble borrowing, and if they can get credit at all, the amounts are small. It’s people with high-enough incomes that get seriously into it over their head, often as part of a learning experience.
Prime-rated auto loans are in pristine condition. In March, the delinquency rate of loans that had been rated prime at the time of origination dropped to 0.36%. Even during the Great Recession, the prime delinquency rate maxed out at only 0.9% (blue).
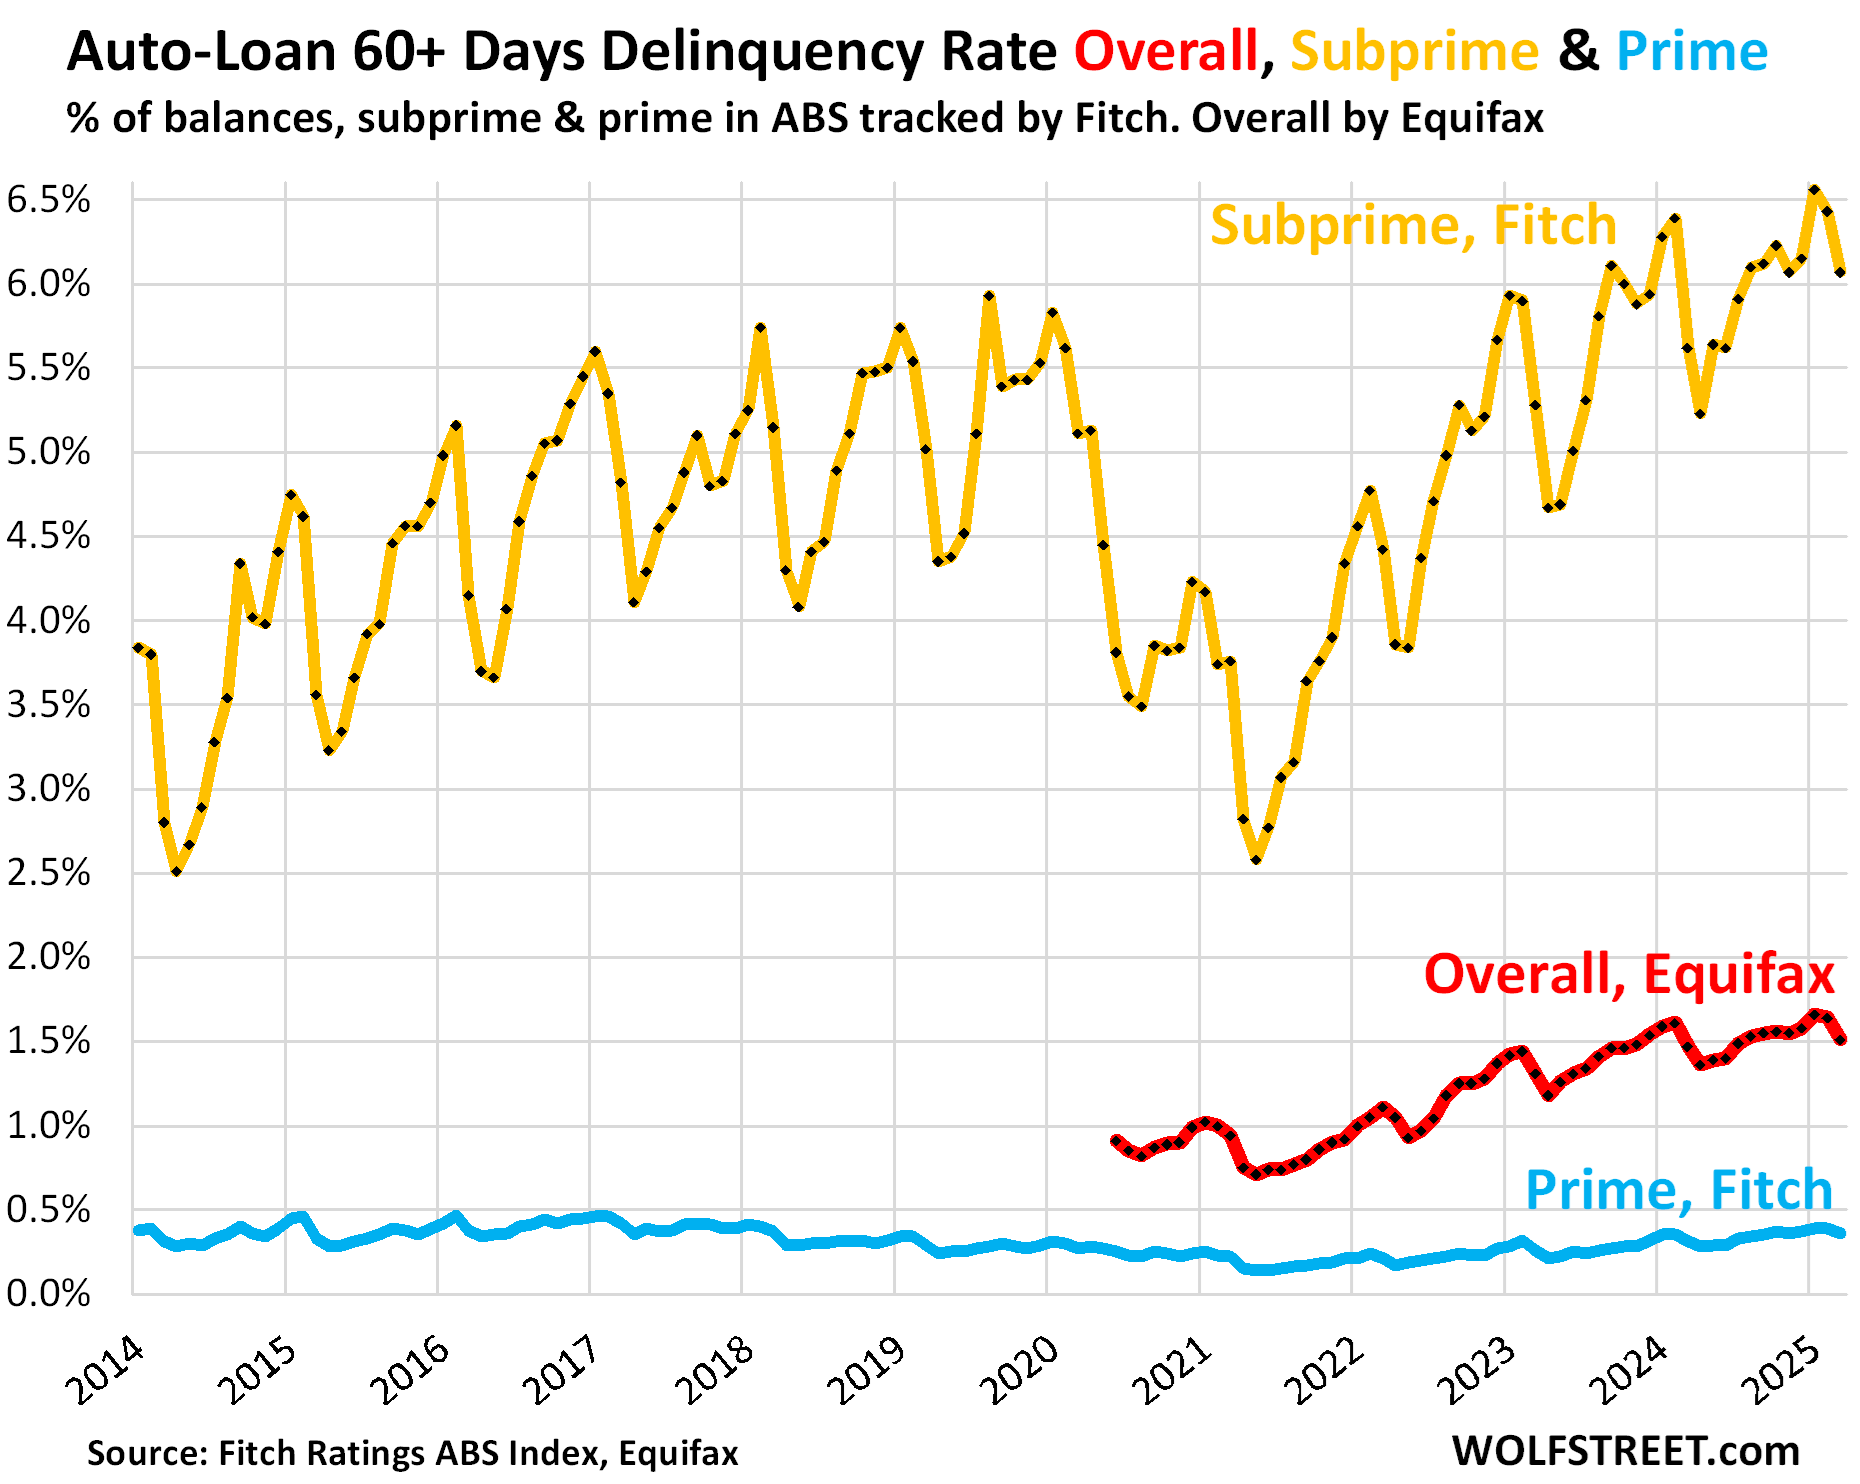
So overall, auto loans are in good shape, with the small segment of subprime borrowers – a high-risk-high-profit business – always being in trouble except when the free money temporarily lowered the risks and increased the profits and the recklessness in the industry. Since the free money ended, a number of the PE-firm-owned specialized subprime dealer-lender chains have collapsed. And the biggie in the subprime dealer-lender industry, publicly traded America’s Car-Mart [CRMT], ran into trouble, and its shares have plunged by 70%. But that comes with high-risk-high-profit activities.
In terms of our Drunken Sailors, as we’ve come to call them lovingly and facetiously, the vast majority of them is handling their auto loans – those that don’t pay cash for their cars – just fine.
In case you missed the earlier parts of the debts of our Drunken Sailors:
Enjoy reading WOLF STREET and want to support it? You can donate. I appreciate it immensely. Click on the mug to find out how:

![]()
Wolf, good stuff. It’d be great to see charts that draw parallels during prior calamities, especially 2008.
Charts 1 & 2 cover the “prior calamities” of 2008. So you can see.
The Equifax delinquency data doesn’t go back that far (red in the last chart). The Fitch data on prime and subprime goes back to the 1990s, which was the beginning of the subprime ABS era, and it blew up in the late 1990s. I was still in the business when the subprime ABS bubble was forming (it was called “special finance” at the time), and I kept the dealership clear of it because it was a mania and didn’t make sense that way it was done at the time, but I was under a lot of pressure from all sides to jump into with both feet. By the time it blew up, I was already out of the business and no one ever thanked me for staying clear of it. My biggest unsung triumph, LOL
I have posted this chart many times before:
I like those first two charts. Just anecdotally from my experience it was a lot easier to buy and sell used cars from 07-12 due to the market conditions. I’m sure the evolution of the Internet has also increased the competition. Much harder to find a good value and profit now.
Does subprime delinquency spike in Jan because of holiday spending? And then come down due to tax refunds?
Yes, as I said in the article, so cited verbatim from the article (helps to read the article so I don’t have to post the article into the comments):
“Fitch’s subprime 60-day-plus delinquency rate declined to 6.07% in March along seasonal patterns (peaks in January or February). Compared to a year ago, it was 45 basis points higher.”
I did, in fact, RTGDFA… but was just curious what specific factors contributed to the seasonal pattern. My assumption was holiday spending but wasn’t sure if there are other variables at play that I wasn’t considering. Thanks, Wolf!
I see. Misread that line. Apologies. Holiday spending surely has something to do with it as subprime-rated consumers are generally also over their head into credit cards (they’re subprime for a reason), and when their credit cards are maxed out after the holidays, minimum payments jump, and they cannot charge new expenses, and so maxed-out credit cards are putting more pressure on them, and they have even less wriggle room, and they fall behind on their auto loans. Then with tax refunds coming in March and April, they’re able to catch up again on their auto loans. That’s kind of the vague theory of seasonality here.
Looks like a pretty healthy DTI ratio.
“ Debt-to-income ratios and debt-to-cash-flow ratios are classic measures of borrowers’ ability to deal with the burden of their debt.”~ true words good wisdom to pass on.
Driven by wealth gains for working class since 2020?
The free money era might have been bad for inflation, but it led to lower-income people having a rare financial window to find better jobs for themselves, especially in the food service, hospitality, and related sectors.
Another contributor might be that the economy continues to shift more toward serving wealthier consumers, who are more likely to be able to and want to pay in cash.
“to shift more toward serving wealthier consumers, who are more likely to be able to and want to pay in cash.”
False conclusion. Re-read what I said about it: It’s USED CARS that are mostly paid in cash, not new cars that wealthier people are more likely to buy. Lost of wealthy people like leases because they can get a new vehicle every two years in a very convenient way.
The free money era with its 30% overall increase in prices absolutely crushed retired people on a fixed income and lots of the working class who were saving for homes that increased in price by 40% plus in many locations (undercounted by the government statisticians by “owners equivalent rent” BS).
Just wait until I buy my new 4runner despite having no job
Is there any way to see a linkage, or predict a linkage, between the auto loans and the upcoming student loan garnishments?
I’ve seen it reported that borrowers with student loans in default would be subject to a significant downgrade in their credit score, a garnishment of up to 15% of their wages, and also the seizure of 100% of their federal tax returns. Since there’s a clear spike in auto buying from tax return seasons, does the reduction in disposable income, as well as no tax returns, imply a muted auto sales season next year? Or somehow a spike in loans that weren’t subprime when they were made, becoming subprime, and defaulting this year?
Is there any way to tell before it might happen?
If that shows up as a big enough of an issue to be noticeable, it should dent in auto sales. Then auto loans might follow auto sales down.