Student loans are loans again, OOPS.
By Wolf Richter for WOLF STREET.
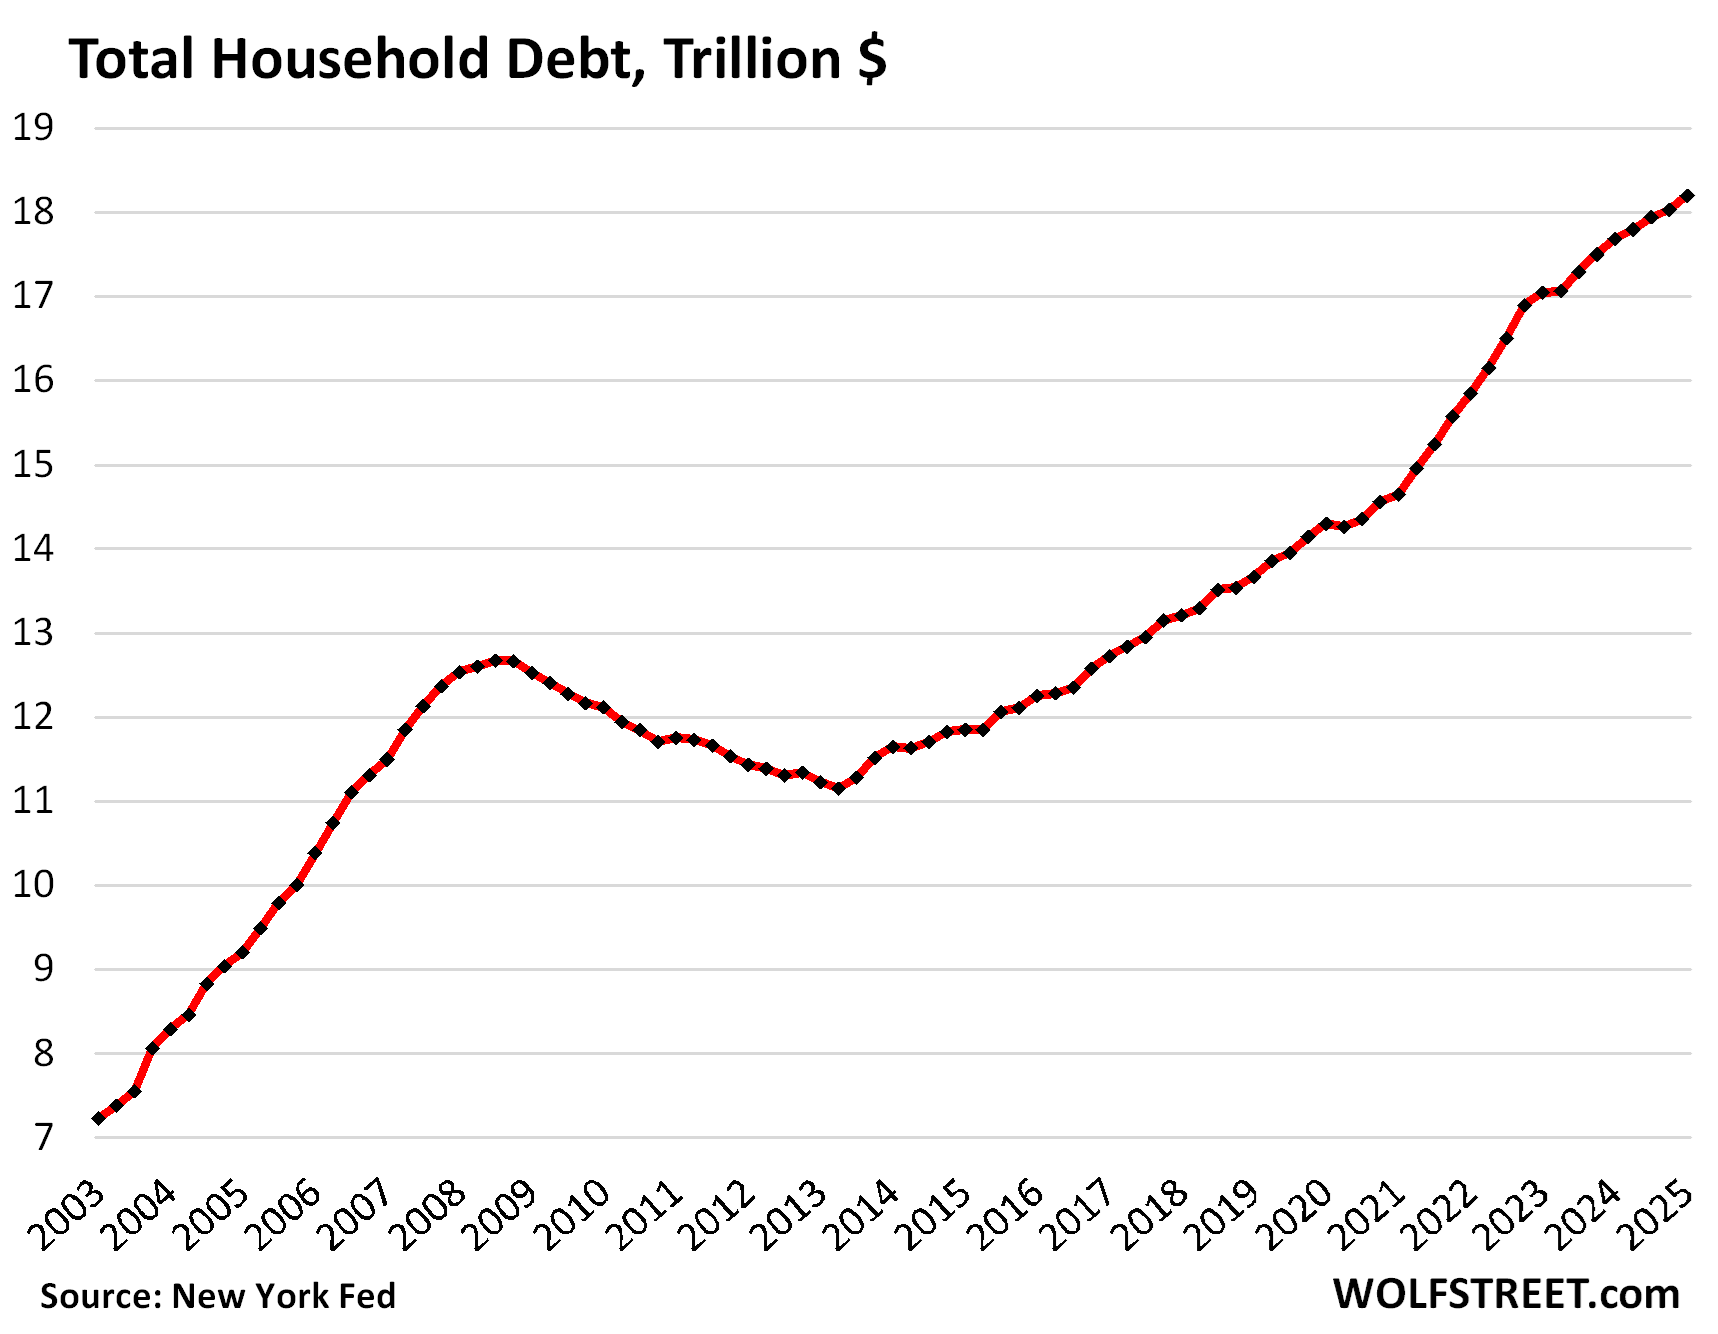
Total household debt outstanding rose by $167 billion in Q1, or by 0.9%, from Q4, to $18.2 trillion, according to the Household Debt and Credit Report from the New York Fed today. Year-over-year, total household debt grew by $516 billion, or by 2.9%, the smallest growth rate since Q1 2021.
And spread over 2.08 million more workers (+1.3%) year-over-year, amid higher wages that helped boost disposable income by 4.0% year-over-year, the overall burden of their debts in terms of their income (the debt-to-income ratio) declined even further; more in a moment.
Balances declined quarter over quarter in the categories of auto loans, credit cards, and “other” revolving credit (personal loans, BNPL loans, etc.). Balances increased in the other three: mortgages, HELOCs, and student loans. We’ll get into housing debt, auto loans, and credit cards each in a separate article over the next few days. Today, we’ll look at the overall debt, its burden, delinquencies, collections, foreclosures, and bankruptcies.
The burden of household debt: Debt-to-income ratio.
A classic way of looking at the burden of household debt is the debt-to-disposable-income ratio, which accounts for more workers and higher incomes.
Disposable income, released by the Bureau of Economic Analysis, is household income from all sources except capital gains, minus payroll taxes: So income from after-tax wages, plus income from interest, dividends, rentals, farm income, small business income, transfer payments from the government, etc. This is essentially the cash that consumers have available to spend on housing, food, toys, debt payments, etc. And what they don’t spend, they save.
Disposable income rose faster than debt in Q1:
- QoQ: disposable income +1.6%, total debts +0.9%.
- YoY: disposable income +4.0%, total debts +2.9%.
So the debt-to-income ratio declined to 81.9% in Q1, the lowest ratio in the data going back to 2003, except for a brief period during the free-money-stimulus era that had inflated disposable income into absurdity.
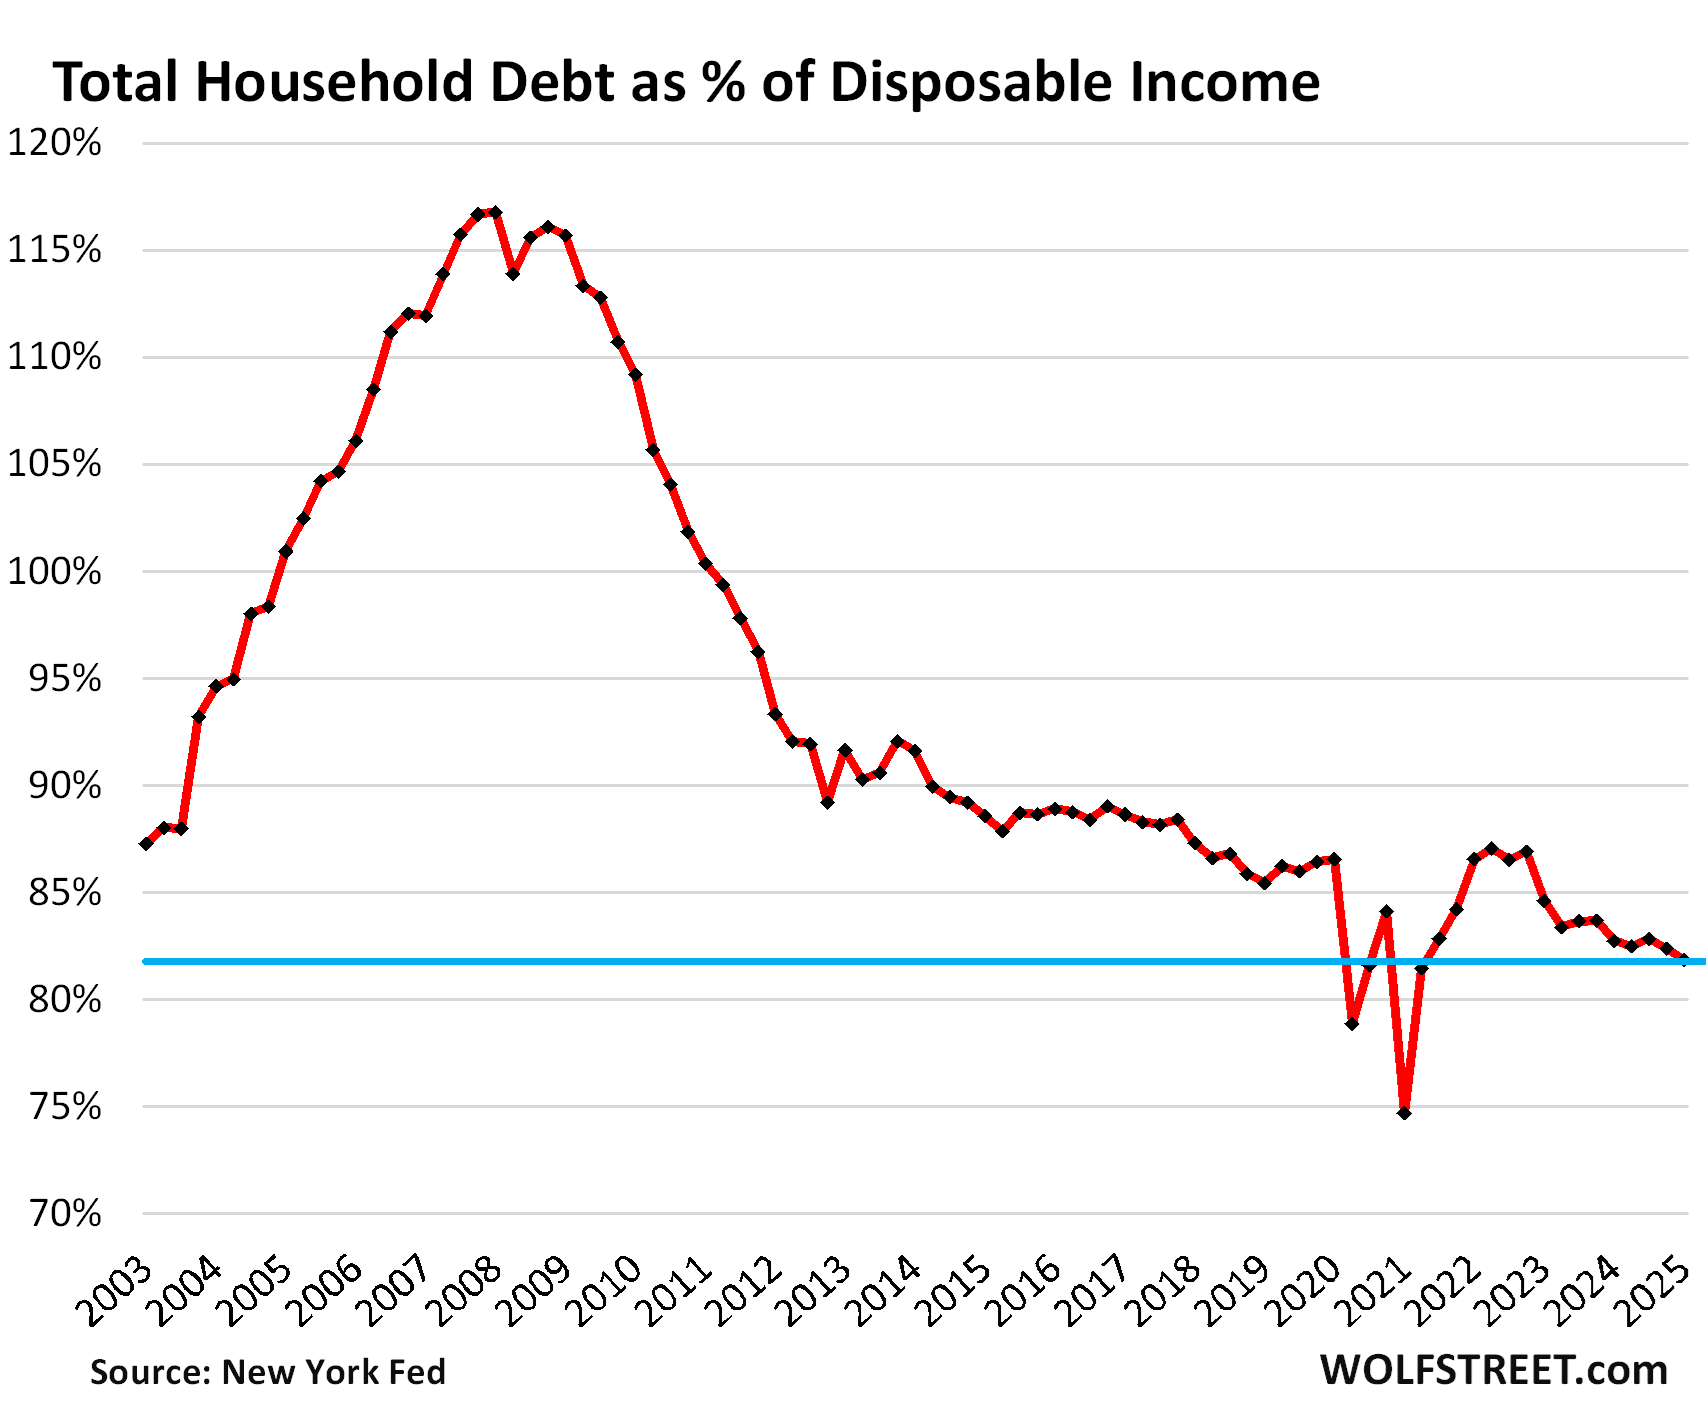
So the aggregate balance sheet of consumers is in good shape. That is not to say that subprime-rated borrowers – a small subset of consumers that’s always in trouble – isn’t in trouble with precariously high debt-to-income ratios and a tangle of bad credit, which is why this segment is called “subprime.”
The heavily leveraged economic entities aren’t consumers. It’s the federal government [we get into the weeds here: US Government Fiscal Mess: Debt, Deficit, Interest Payments, and Tax Receipts]; and many businesses.
This balance-sheet strength of consumers — 65% own their own homes, over 60% hold equities, they sit on $11 trillion in money markets and CDs, and their debt burden is at historic lows — explains in part why growth of consumer spending has held up well, despite higher interest rates.
Our Drunken Sailors, as we lovingly and facetiously call them, learned a lesson and became a sober bunch, most of them, after they blew up their balance sheets in the early 2000s – and in the process, the banks.
Student loans are loans again. OOPS.
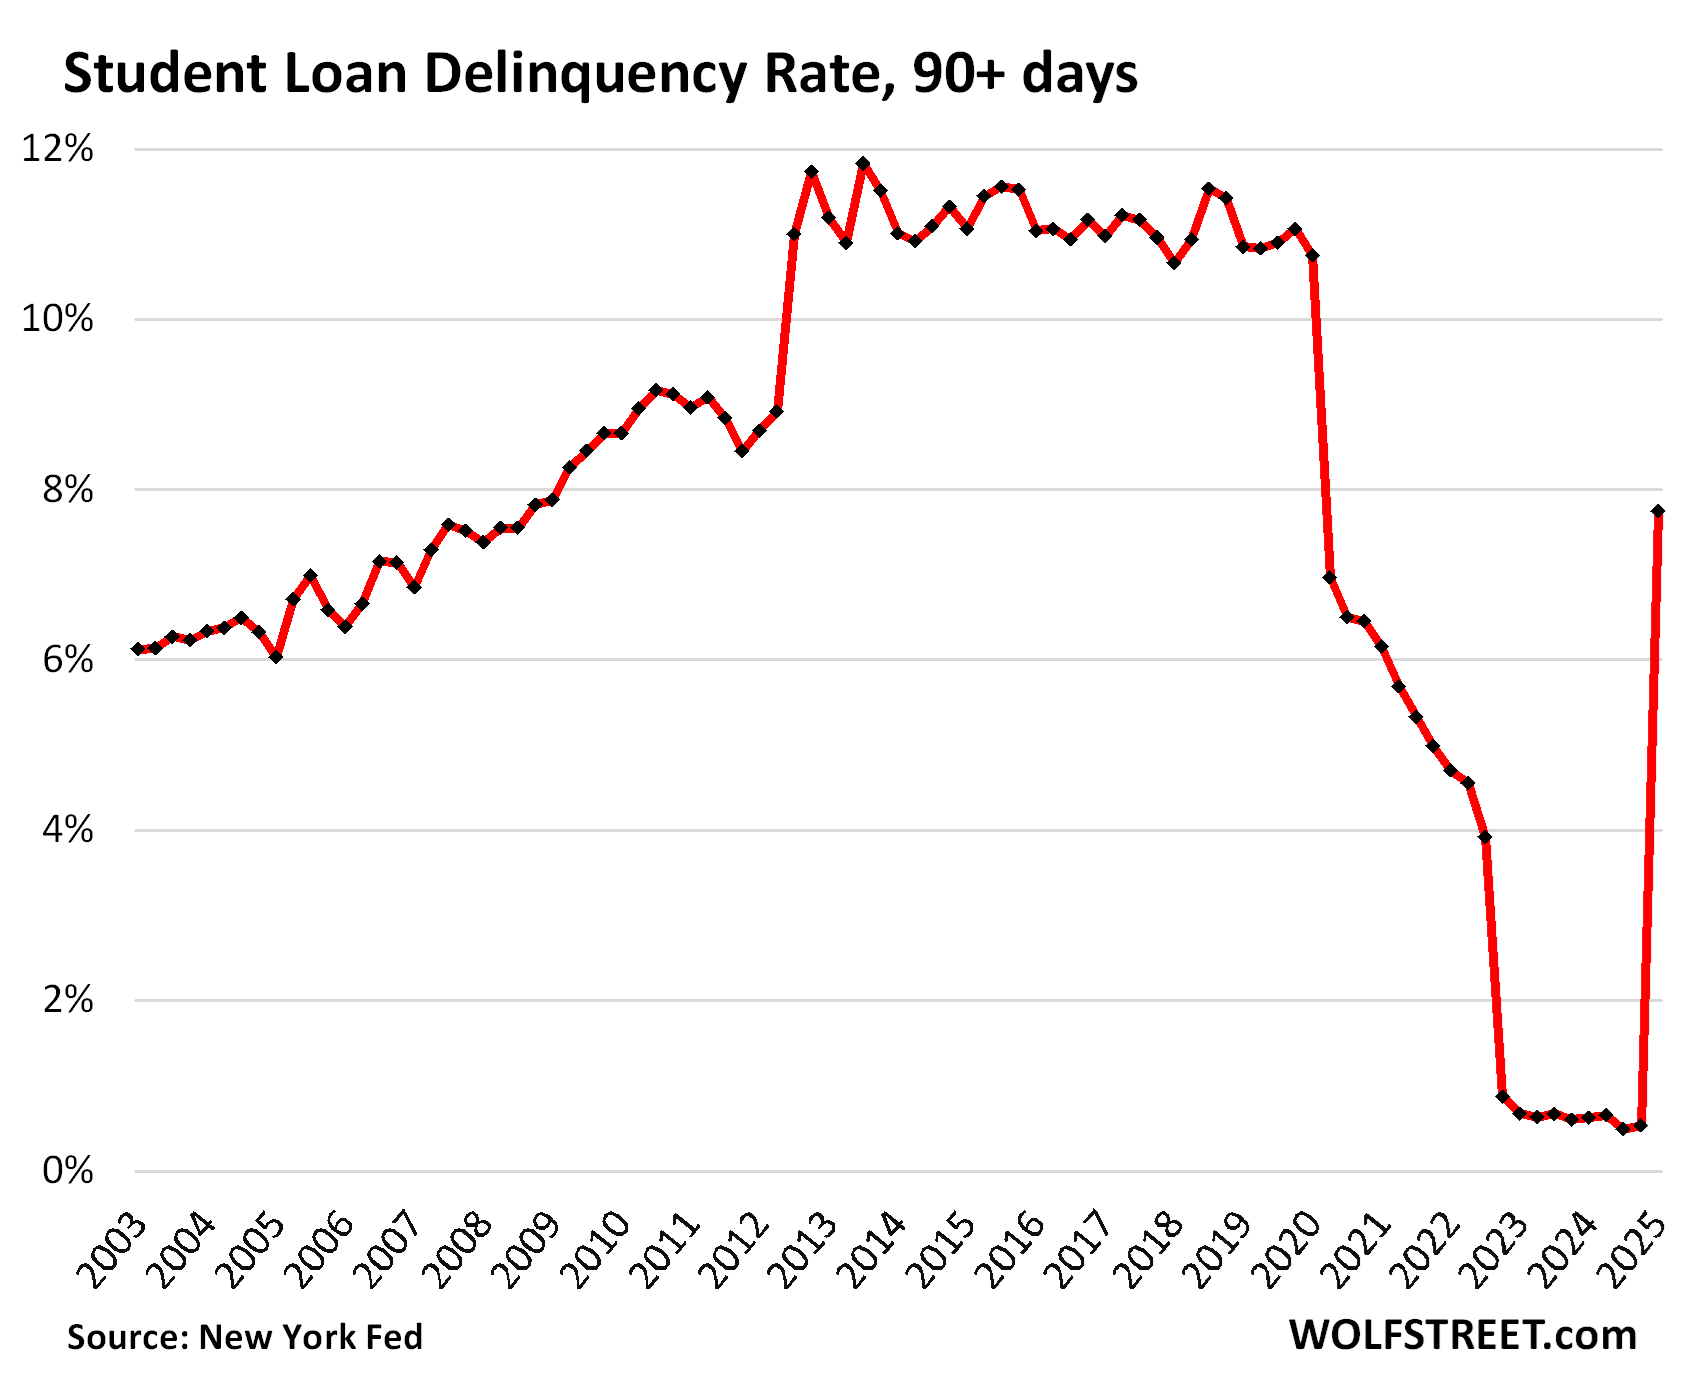
There for a while, student loans weren’t really loans anymore. Borrowers didn’t have to make payments, interest didn’t accrue, nothing was delinquent despite years of not making payments, a bunch of them were forgiven by the Biden administration, and some of those forgiven loans remained forgiven, but other forgiveness strategies lost in court and became unforgiven again, etc. And now this whole mess officially became a mess again when these delinquent balances became officially delinquent again.
So the serious delinquency rate (90 days or more past due), after having been near 0% for over two years, re-spiked to 7.7% in Q1, according to the NY Fed’s report today, based on Equifax data. And it will likely do some more catching up in Q2.
Total student loan balances rose to $1.63 trillion in Q1, and $126 billion of it was 90 days or more delinquent. In fact, much of it was years delinquent suddenly again.
This chart looks obviously funny. Student loans are now largely a creature of government, and government can do funny things, such as trying to forgive student loans (this was taxpayer money they were trying to give away) but not getting away with it:
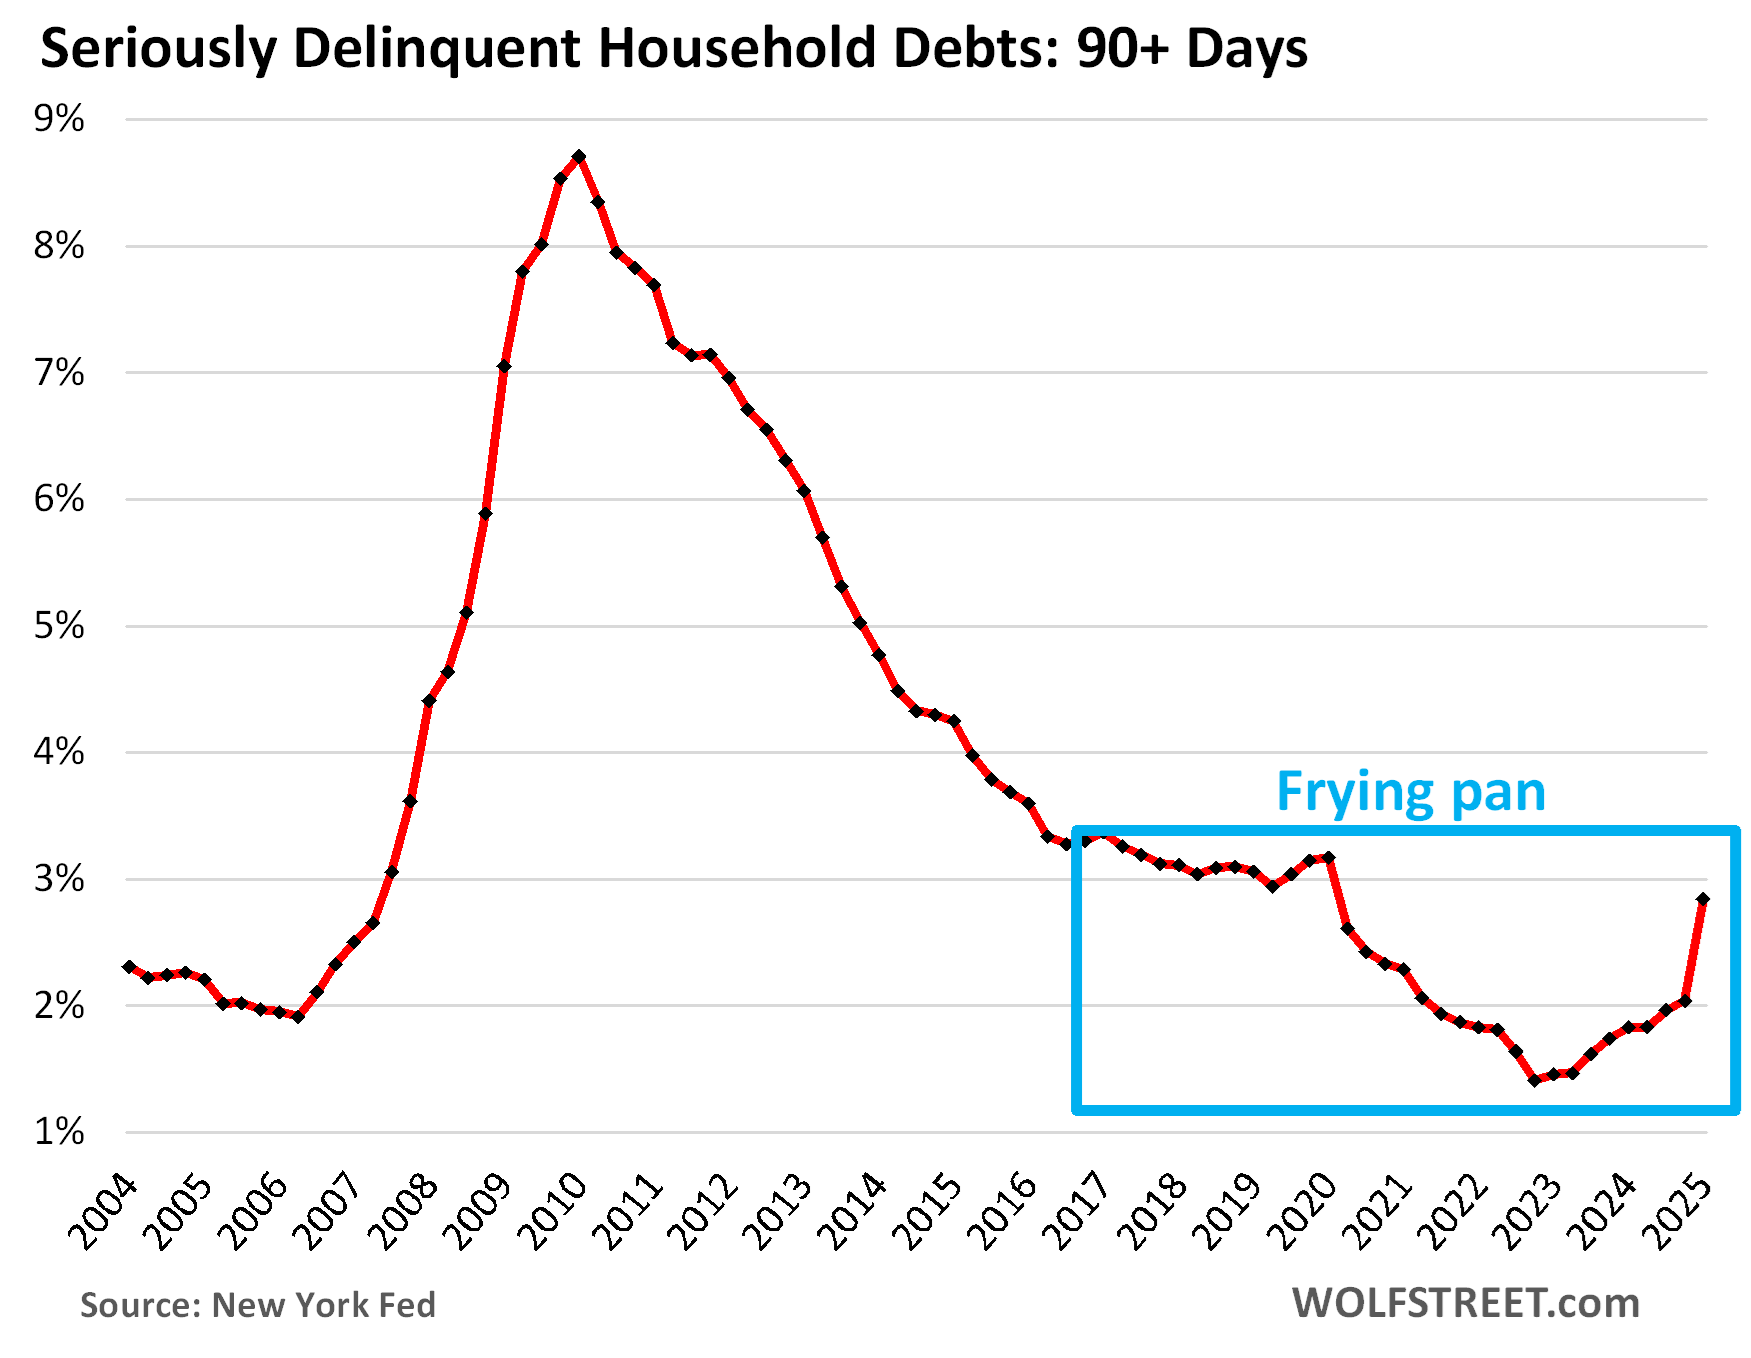
The overall delinquency rate got whacked by the sudden student loan delinquencies and spiked to 2.8% in Q1 from 2.0% in Q4. But even 2.8% was still below prepandemic levels.
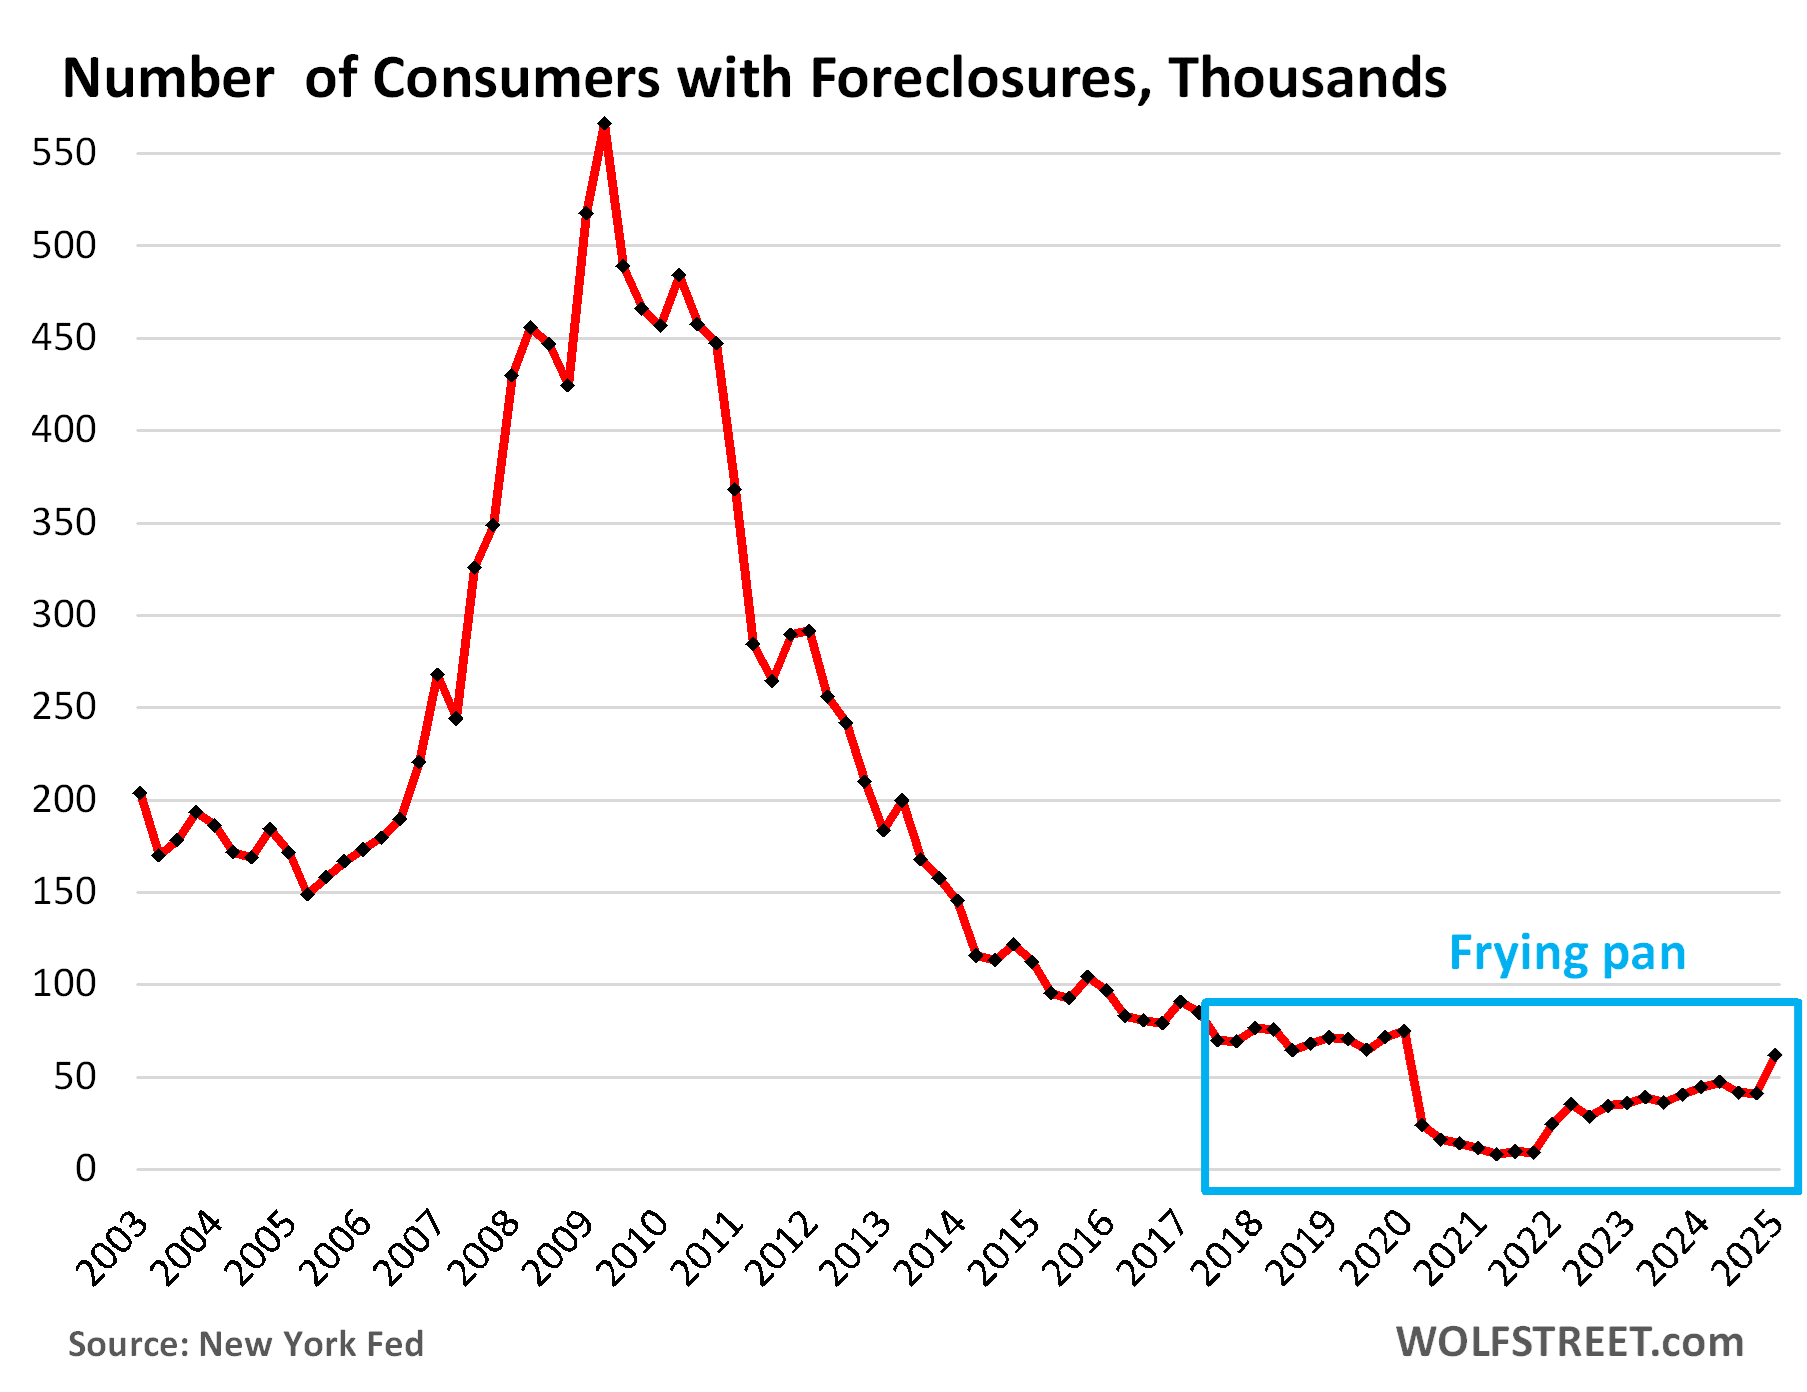
The infamous “frying pan pattern” – so dubbed right here some time ago – is now forming, where the panhandle represents the prepandemic level, the pan represents the free-money level, and the other edge of the pan represents the post-free-money return to prepandemic levels:
The foreclosures frying-pan pattern. The number of consumers with foreclosures in Q1 rose to 61,660, still below the range of the Good Times in 2018-2019 between 65,000 and 90,000.
During the Free-Money era, which included government-sponsored mortgage-forbearance programs under which foreclosures were essentially impossible, the number of foreclosures fell to near zero.
What is keeping foreclosures still low currently is that home prices exploded during the free-money era, by 50%, 60%, or more in many markets, so most strung-out homeowners can sell their home for more than they owe on it, pay off the mortgage, and walk away with some cash, and their credit intact.
It’s only when home prices spiral down for years, which they started to do in some markets – here is a look at condos in 15 big markets with price declines of 10% or more – that foreclosures can become a problem.
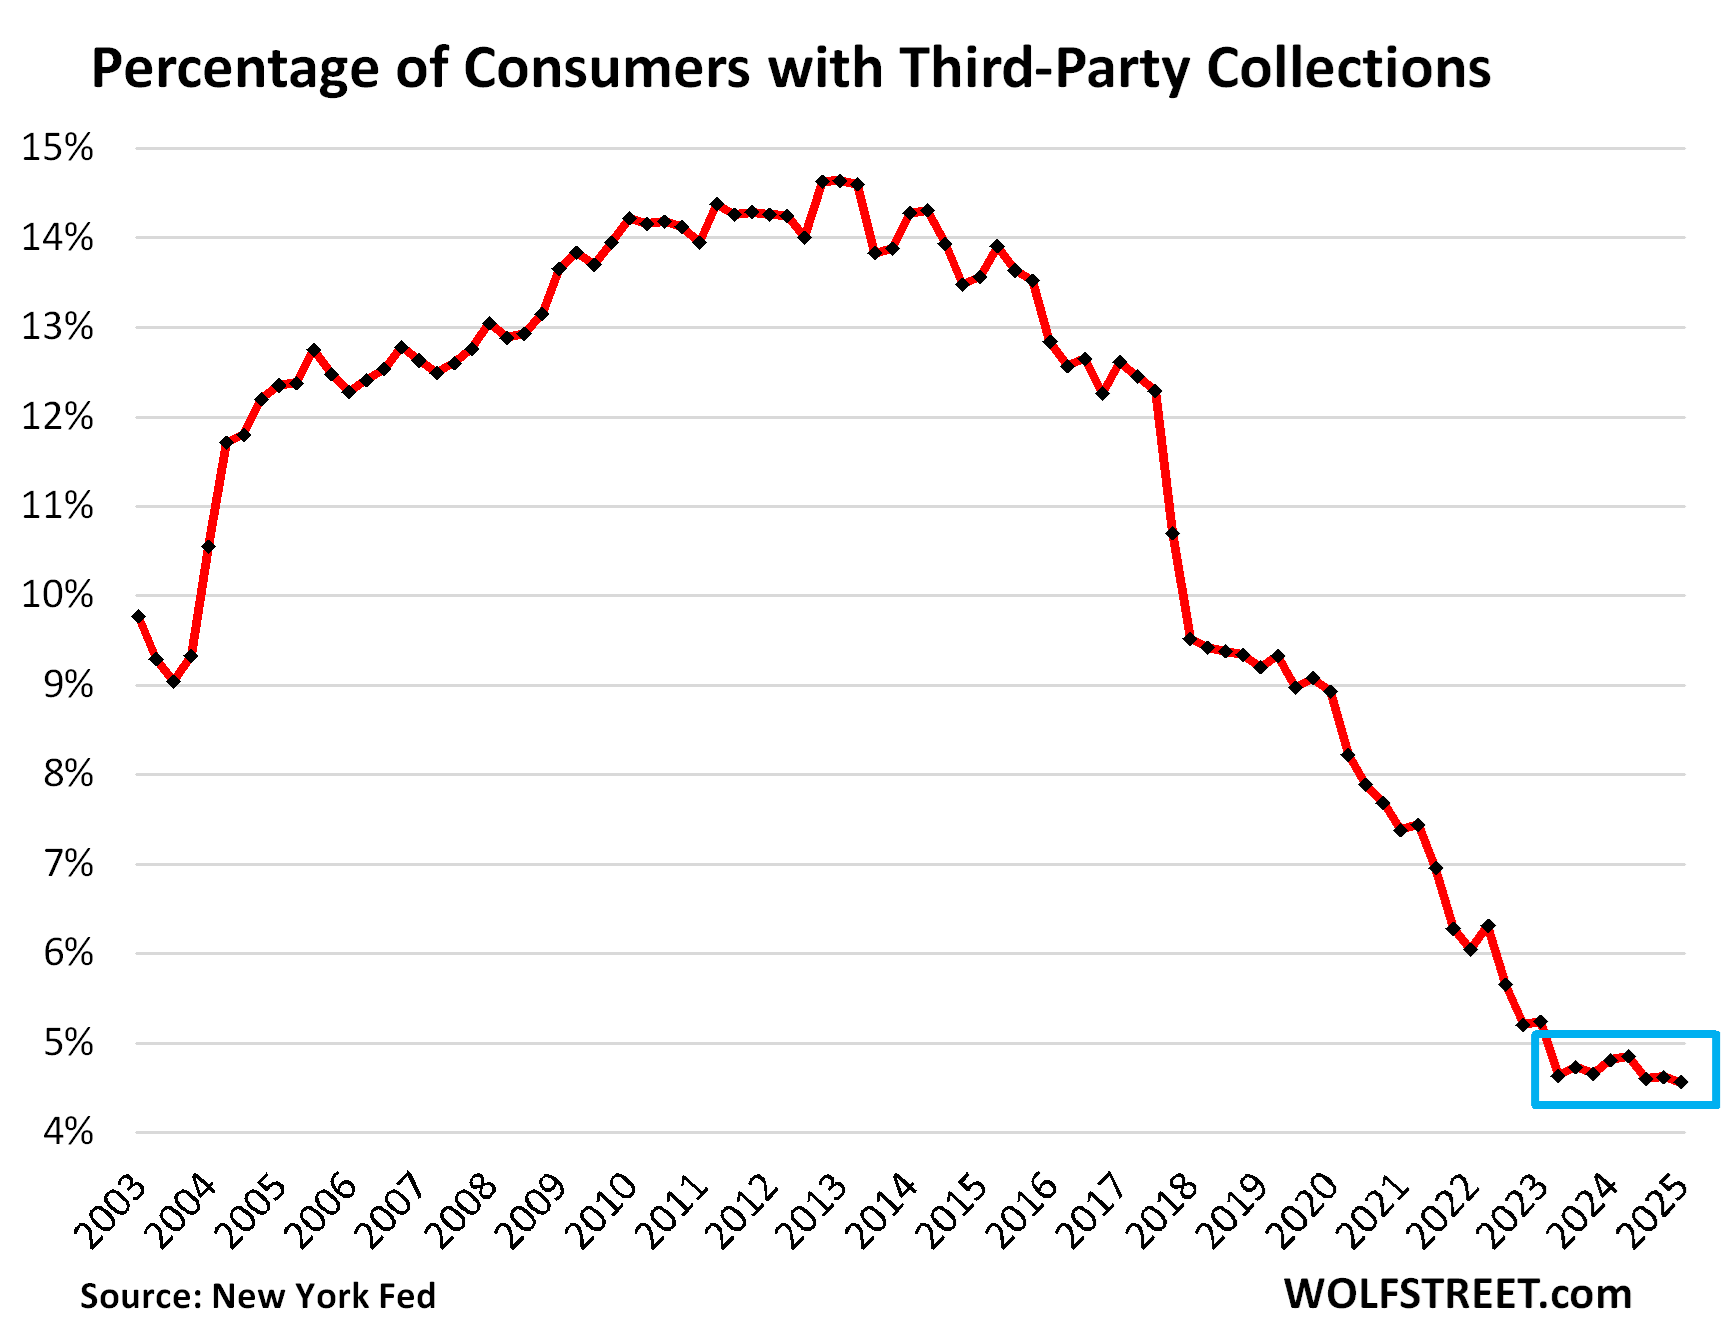
Third-party collections crawl along rock bottom. A third-party collection entry is made into a consumer’s credit history when the lender reports to the credit bureaus, such as Equifax, that it sold the delinquent loan, such as credit card debt, to a collection agency for cents on the dollar. The New York Fed obtained this data on third-party collections in anonymized form through its partnership with Equifax.
The percentage of consumers with third-party collections has hobbled from record low to record low since the advent of free money in Q2 2020, and even after the free money vanished, third-party collections continued to hit record lows and in Q1 edged down to a new record low of 4.56%:
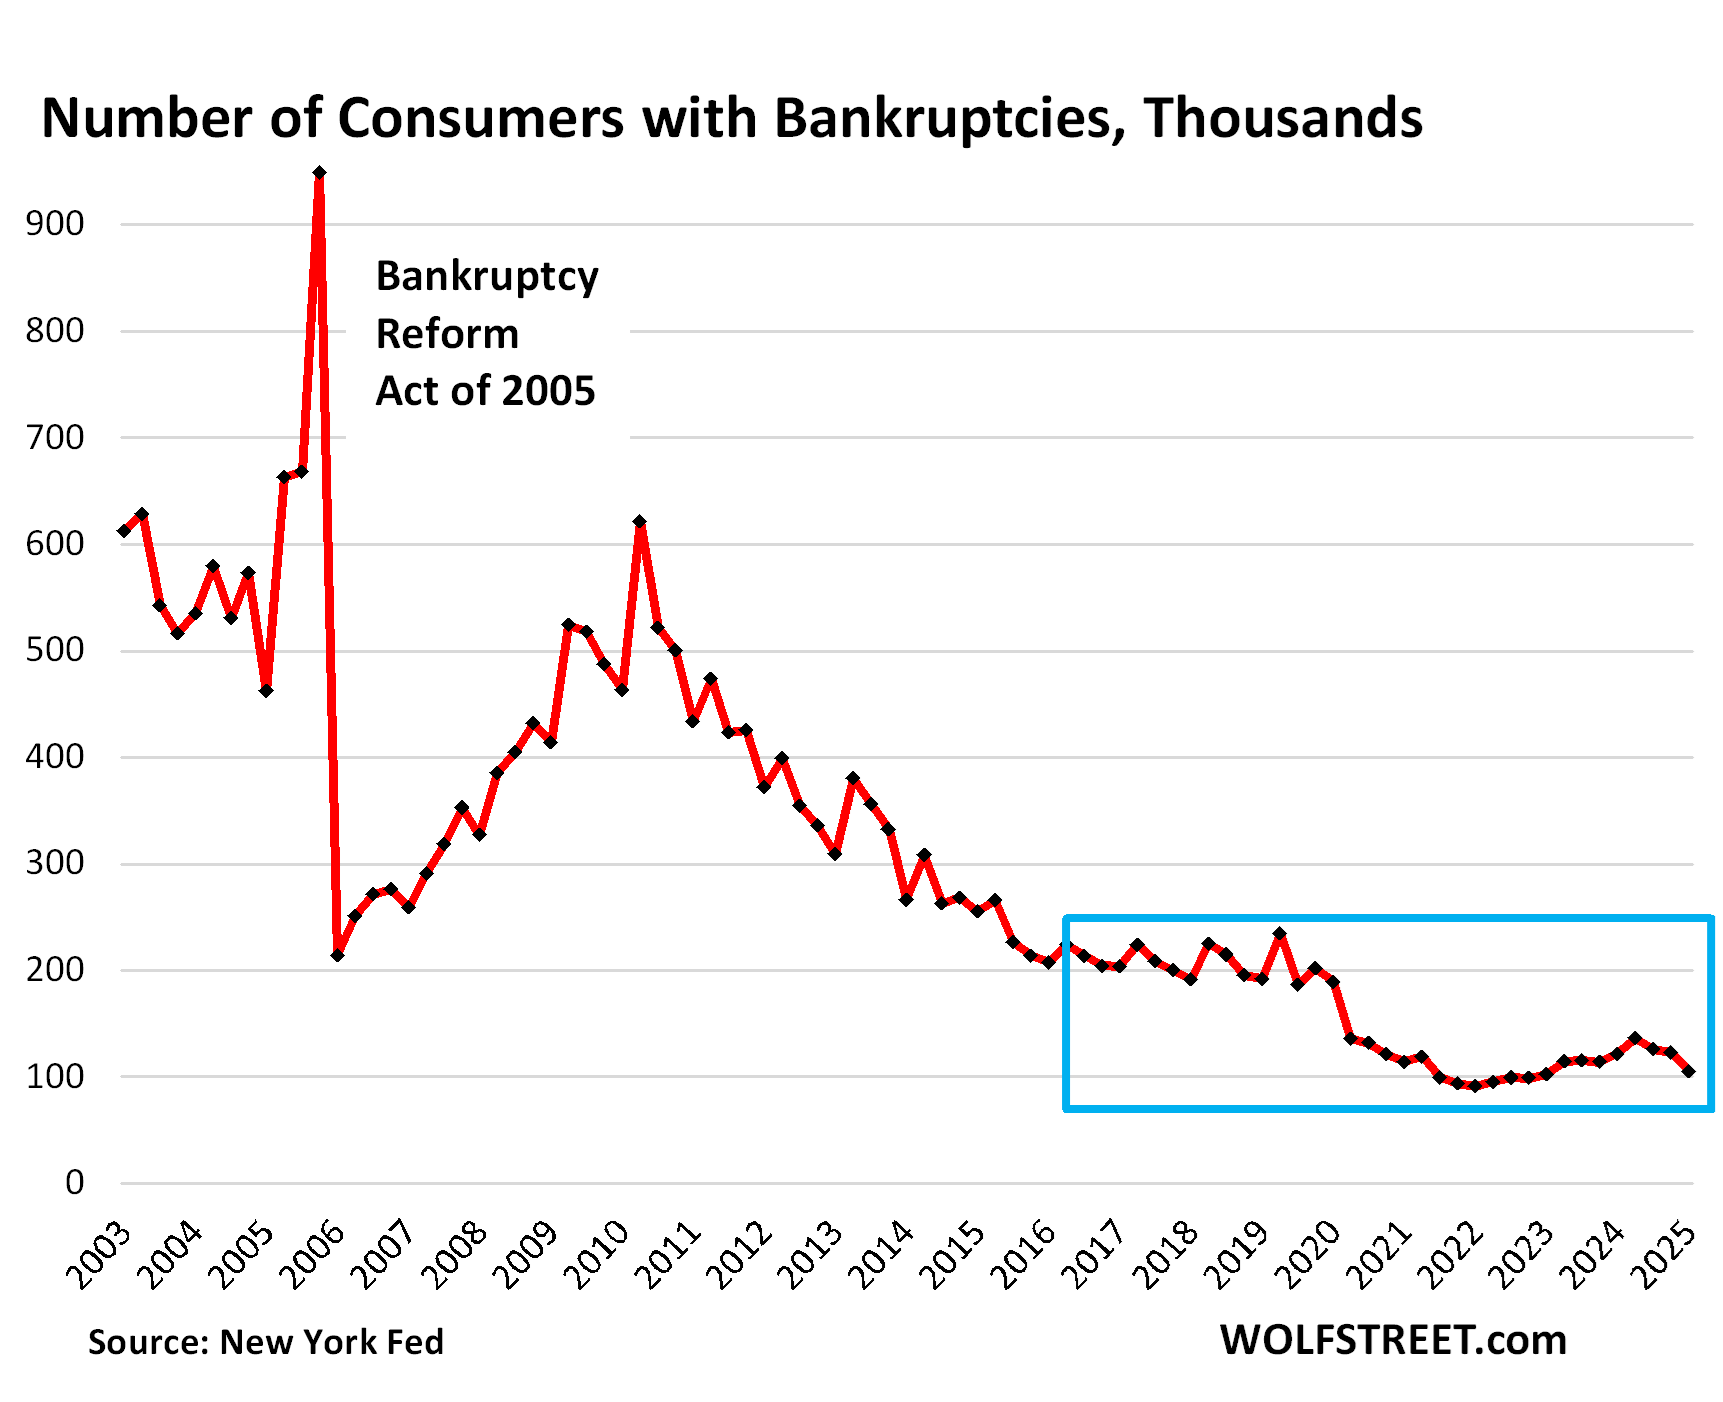
Bankruptcies form a “broken frying-pan pattern,” a new phenomenon here. The number of consumers with bankruptcy filings dipped to 104,860 in Q1, the third quarter in a row of declines, and now just a hair above the all-time free-money low in Q4 2021.
During the Good Times before the pandemic, the number of consumers with bankruptcy filings ranged from 186,000 to 234,000, which had also been historically low.
This decline in bankruptcy filings broke the side of the pan that is opposite to the handle and forms an odd-looking broken frying-pan pattern.
We’re going to wade into housing debt, credit card debt, and auto debt in separate articles over the next few days. Next one up is housing debt.
Enjoy reading WOLF STREET and want to support it? You can donate. I appreciate it immensely. Click on the mug to find out how:

![]()
The government, or I should say the taxpayers, should never have been giving loans to students. Colleges and universities should be the ones to give them loans. They are the ones who profited from them.
Governments do a lot of things they should have never done. The problem always is, what should you do after you’ve done things you should’ve never done. Undoing them is not straightforward.
“what should you do after you’ve done things you should’ve never done”
1) Retroactively tax the decades-untaxed endowments of universities in order to at least partially offset the billions and billions in student loans in default.
2) Sue the universities under federal False Claim/Qui Tam provisions for spending decades pumping out misleading employment/salary stats concerning their graduates.
3) Sweep up the resulting rubble of these long corrupted “non-profit” institutions, and start fresh – with much more actual integrity and much less empty moral posturing.
Is that specific enough?
The topic shouldn’t be the loans, the topic should be how the educational system is financed. Universities core goal should be to deliver high-quality education against a low cost to society, not to make profit. Running universities as a company is a choice, not a necessity. Virtually every developed Nation has subsidized education to avoid developing an education based class structure, they sponsor tuition fees, they have loan programs for student living costs which are then payed off based on income capacity, and lastly, they all score higher than the U.S. on higher education. Not to mention the myriad of other problems created by burdening young people with high debts.
The vast majority (88% according to a search I just did) of higher education students in the US attend nonprofit public and private institutions. Public universities are subsidized, some of them significantly. For example, in California, over 50% of California residents attending a University of California school pay no tuition at all, with many more paying reduced rates. From community colleges to public universities, you may not be able to attend the specific school you want to in the US, but there are lots of options to keep costs, and the need for loans, down to a reasonable level. The problem, at least as I see it, is the government guarantee of student loans allowed universities to issue loans indiscriminately regardless what the student studied and their potential to pay it back.
US higher education also performs very well in every international ranking I’ve seen, so to assert that “all” developed nations score higher than the US on higher education is either wrong or is the function some questionable methodology.
“The vast majority…attend nonprofit public and private institutions. ”
The problem with this model is intuitions become inefficient and bloated employing increasingly numbers of administration personnel to dysfunction. Epsilon Theory wrote about this before they changed their tack.
There isn’t a single country that “scores higher” than the US at the university level, if that’s what you mean by “higher education”. The majority of the best science and technology schools are based in the US with the UK and China being distant 2nd and 3rd.
There are plenty of countries that beat us educationally at K-12 if that’s what you are talking about.
I assume you are both looking at Top University Rankings like ARWU/QS/THE? Those rankings use (various) models that attribute the majority of weight to research & reputation, not to teaching. E.g. expenditure, renoun, publications, citation impact etc. Needless to say, these rankings mostly originate from the U.S./U.K..
If you look at any independent global comparison on higher education, whether they are survey based or using metrics, we have been dropping for 30 odd years and in most categories ranks near the bottom of developed countries. U.S. higher education is very top-heavy, highly concentrated on a few top performing universities and on average well at the bottom of the OECD. This is showing in virtually all scores:
– U.S. full literay rate has dropped to 79% (PIAAC 2014)
– U.S. 34th in PISA math (2022) and declining in reading & science
– Lowest paid (primary&secondary) teachers in comparison to equal skill jobs
– Highest amount of hours worked per teacher
– Highest average (including those non-profit institutions mentioned above) tuition fees by far
– Second highest average debt per student
– Highest student debt default rates
– Confidence in higher-education dropped to record lows
We’re spending a whole lot (more than average) and are getting very little in return. The system is twisted because performance per institution is being measured by the wrong things: #of students/publications/references/exchanges etc, which in turn is caused by how the we fund higher education. This is not unique to the U.S. btw, but it’s definitely taken on the most grotesque proportions here.
Don’t take my word for it:
https://nces.ed.gov/pubs2019/2019179/index.asp
https://worldpopulationreview.com/country-rankings/education-rankings-by-country
https://worldostats.com/country-stats/education-quality-index-by-country/
https://www.thirdway.org/report/the-state-of-american-higher-education-outcomes-in-2023
https://news.gallup.com/poll/646880/confidence-higher-education-closely-divided.aspx
Hi thurd2,
The immutable Law of Supply and Demand when applied to Student loans predicts two macroeconomic effects.
Student loans will inevitably both increase the cost of attending college and debase the value of a college degree.
But, but, but…….
The notion that the government should “never” be “giving” loans for higher education is absurd… It was a good idea to help increase national STEM knowledge in the US in the cold war and its a good idea now. Good doesn’t mean perfect or without problems that should be addressed. In my view not through blanket forgiveness and yes, I agree, increased college accountability and targeted at specific skills, disciplines, and/or trades.
It would be really simple to link the amount of money a student can borrow to the average earnings from that school in their chosen major.
We could also require the college to pay debts of any defaulting student, and watch a whole bunch of the soft science majors completely vanish, as they should.
And it would be far better to have the loans administered privately with government backup, as it was before Obama made this giant stupid mess.
I have been saying this for years. Time for everyone to put their money where their mouth is. In fact, maybe banks could go back to just being banks again, not gambling houses. Due diligence, what’s that?
My college career was the very early 1980s. I was from what was at the time a lower middle-class family and was the first in my family to go to college. At the time, attending the University of Florida was heavily subsidized by the State of Florida (with associated price controls). I don’t remember the prices, but I could pay for everything with $30/month from my parents and the school’s work program, where I put in 20 hours/week cleaning labs, shelving books, whatever labor was needed. Oh, and I did earn important beer money in the summer working construction. Graduated with zero debt. In order to cut taxes, the State has basically ended subsidizing college. So students have to borrow to attend. When the private sector wasn’t willing to give a whole bunch to 18 year olds, the feds stepped in. When colleges found out they could charge the feds whatever they wanted, costs blew through the roof.
agree with your general point, but with regard to florida, everyone reasonably smart qualifies for bright futures now, and tuition is paid for. you still have room and board, but you can attend a school near your hometown and live with the parents for free, which many kids do.
they almost hinted at culprates of HIGH COST universities
student loans
but IMHO make school responsible for 50% of loan and watch how many DON”T GET THEM
All 3 of my kids went to school with bright futures.
kent, i’m not following. if your three kids all used this program, which still exists today, why do you say that florida stopped subsidizing public colleges?
“When colleges found out they could charge the feds whatever they wanted, costs blew through the roof.”
Same thing happening in INSURANCE and HEALTH CARE…
Hmmm, maybe there is a common denominator here, maybe having the government pick winners and losers isn’t such a smart idea…
Now let’s talk about MILITARY/DEFENSE spending shall we…
LMFAO!
Something happened in the early 2000s, with the education, medical and housing bubbles blooming thereabouts. Also, it seems to me heavy offshoring of manufacturing started around then. A new paradigm it seems to me. I don’t know the root cause. Part of it was the rise of information processing and software power to let people see and manage money as a more abstract concept. Combined with new economic theories (“Rich guys always do what’s best for everyone!” – Simpsons; “Business will self-regulate as that will maximize income” – Greenspan). An accelerated hollowing out of manufacturing, becoming a service-oriented economy being considered a laudable goal. I guess a combination of factors in a perfect storm leading to significant simmering dissatisfaction (protest candidates rising – recall “deez nuts” winning).
A combination of factors likely. I wonder about a root cause.
Nope. Medical costs were already high. 35 years after Medicare…..nope. Where is the cost??? Private sector elitism caused the price to rise. People simply seek rent. Forcing the active elderly to ration would destroy consumer balance sheets. Post smarter,
Worked my way through school after building houses and pools for three years. Impossible to do now, thanks to the under reporting of inflation.
Remember, the formula for calculating inflation changed in the 80’s.
Yep, the list of scummy, profiting bad actors in “higher education” is long.
“profiteering” not just “profiting”…
An alternative phrase to “give away” might be “investment”, depending on if you think society benefits from having college be accessible to lower deciles or not.
society does benefit by having smart people, of all incomes, go to college to learn useful skills. it doesn’t benefit by having non-smart people, of all incomes, go to college to learn crap or to fail out.
Money flowed from government, through the student, to the university. The student was a pass-through entity for that money flow. While the university received the money, the student was stuck with the debt. Government is more than happy to funnel vast amounts this way, universities happy to accept. Making the debt-to-government non-dischargeable in bankruptcy makes it like a tax.
Bullshit. At what point does the student take responsibility for their own actions? I wish I could choose not to pay may taxes. People have a choice not to go to college. UNLIKE INSURANCE…
What up.
Looking at these numbers, it seems that we are nowhere close to a recession or a housing crash.
Hi Vlad,
I live in the Eastern Time Zone and was up very early this morning. By chance I happened to catch Trump’s (or tRump’s for those who prefer that moniker) remarks to the GCC which were carried live on the Fox Business channel.
After the President concluded I idly switched over to catch the market data on Bloomberg TV and was bemused by their reporting on the event I’d just watched live.
It seems i must be existing simultaneously in two universes with alternate realities.
Those conflicting interpretations of the numbers you mentioned only seem to confirm my suspicions.
That is why we read data and don’t count on the news to translate. Economic data can be viewed several ways, for free. It is released daily from all over the world. The news picks some things to share and not others that are extremely important to see the full view all over the wold.
I’d have to agree, unless a Black Swan event occurs.
Yeah the data say it’s a pretty uneventful time. About the only thing to report is the air slowly going out of the housing bubble. But I remind people that we already had several mini-crashes in the 2020s, including a very steep crash in 2020. The expected hard times didn’t materialize and the busts just didn’t last.
the hard times didn’t materialize because all pain was covered over with federal borrowing or printing, or both. as long as the federal government subsidizes all problems, and as long as it can borrow unlimited amounts of money for 4.5%, there will never be a recession or any real hard times.
Hardly all pain was covered. Small businesses were decimated. Though some shouldn’t have survived and this period quickened their demise. But the government absolutely shit the bed and didn’t help small business. Several of us obstinate ones maxed our credit lines. And if you were part of those, like me, with a small rental portfolio, you were awarded renters that didn’t have to pay rent for a period. Yet we still have mortgages. Yes. I’m still bitter the government bent me over while frivolously giving money to those that didn’t need it. Still climbing out of that hole years later
mike, i don’t disagree that the pandemic response was an abomination, and that small businesses who were forced to close got hosed, while small landlords also got hosed.
but my larger point stands. no one ever really lost their jobs and thus cut back on spending, because federal largesse ensured that would never happen. that’s been the case since 2011 or so.
Mike,
“you were awarded renters that didn’t have to pay rent for a period”
I hear you.
*But*
Landlords have had their revenge – and then some – for over three years.
That is why we read data and don’t count on the news to translate. Economic data can be viewed several ways, for free. It is released daily from all over the world. The news picks some things to share and not others that are extremely important to see the full view all over the wold.
AIG and Chubb pulled out of my ski town neighborhood. Even if you are cash buyer no one wants to be self insured for a portion of their home or pay top dollar for insurance. If you have multiple homes the carry cost is going up faster than the appreciation, it’s time to reduce houses and sell! I believe wolf evidence that the housing bubble is popping. I believe we will experiencing a dot com bubble like event with AI and mag 7 and a housing crash, a one two punch with side of inflation and rising long bond yields. I know risk has been on fire for the past month and the $vix is beat down(due to bounce). Housing mopped up covid liquidity, now that liquidity is evaporating from housing. You guys are talking about black swan events, it would take a black swan event to create enough new liquidity to keep this thing going higher.
re: “it would take a black swan event…”
There have been seismic changes in the money market propelling the economy forward. The O/N RRP facility being one. The flow of funds through the MMMFs another (representing the activation of monetary savings).
I.e., funds flowing through the MMMFs, from the payment’s system, increase the supply of loanable funds, but not the supply of new money – a velocity relationship.
That and the shifting of funds from “time deposits” to transaction’s deposits in the payment’s system increasing AD.
We are experiencing a supply demand shock in the price of oil.
Short-term money flows, the volume and velocity of our “means-of-payment” money supply is still positive.
I agree for incremental moves, but to keep housing market going up with all the downward pressure lack of affordability to income for new buyers. It’s going to take a bigger liquidity drop than before, those golden handcuff mortgage rates are an all time low. I am not sure how Wolf describes liquidity tolerance in the economy. It definitely takes more $$$ to move the needle. When the bottom falls and doom loops take place, the scale of QE will be greater than before. I don’t believe QE will happen with inflation that is already in the pump. UAW, pilots UPS etc all got a 5 year wage increase in their contract, that going to pressure upward inflation. The inflation pump is prime, we are no longer importing deflation, Bond vigilantes are going to have deficit temper tantrum soon. Right?
I wouldn’t put it past the government to engineer another event as an excuse to create new liquidity to prop everything up.
1) Threatened Alien Invasion
2) AI Chatbot Insurrection
3) Epidemic of Sexbot Social Diseases
“nowhere close to a recession or a housing crash”
Sure, maybe.
But look at the extremely sharp upward slopes in delinquency/default stats in Housing Implosion 1.0.
2007 – “Permanently High Plateau”
2008/2009 – Tim Geithner looks like he is close to suicide on national TV.
The American “system” is long practiced at sweeping economic cancers under the rug, until it can’t be sustained anymore and then the houses-of-cards implode.
A ton of macro metrics are out of whack (stupid PEs in SP 500, home valuations doubling as incomes lag far, far behind, large deformities in the labor markets biased towards G subsidized industries, etc.)
Those charts are pretty amazing. It seems that the strong consumer balance sheets correlates very well with “free money”. Correlation is not causation of course.
Curious if this debt includes margin loan debt?
If not, it would be interesting to see what the total debt to disposable income ratio is with that included.
Margin loans are in the brokerage system and included margins loans to investment firms, hedge funds, other firms, and households all combined. There is no figure for household margin loans alone. They’re relatively small in the overall debt, at about $800 billion spread over investment firms, hedge funds, other firms, and households.
“It was the best of times, it was the worst of times, it was the age of wisdom, it was the age of foolishness”. For consumers with money it’s great for consumers without money private credit is available to keep them strung out on their lifestyle(paying for DoorDash) frying pan patterns are like bearish flags when they breakout people will suffer.,,reality happens. JNK and HYG hit all time highs this week, maybe just a function of the trading Algorithm trying to keep the risk on rally going. What’s the end game of the credit bubble? When does reckoning occur? It’s a long way down if you want to rock and roll.
This is why the economy will continue to hum along. Jobs are there, incomes are fine and debt is below its historic levels. The only real issue is government spending
I think inflation is another issue. Our sailors have too much disposable income for inflation to subside.
Incomes are fine if you own a house. If you’re a renter than you’re screwed.
That’s exactly the problem. Household balance sheets are sparkling because over the last 4 or 5 years trillions of debt were transferred to the federal balance sheet.
Life… Be adults, pay your own bills and earn your own way. When you sink and fail, it is your own fault. Beyond that the government should not be in the handout business nor be making it easy for people to go into debt they cannot afford with useless programs to help people get loans they cannot afford based on non financial factors.
I have no debt except my regular income and real estate taxes plus daily living expenses.
Perhaps when Wolf writes about the consumer credit card debt, he could comment on what IF any impact the use of Credit Cards -in lieu of cash- or check type payments has had on the credit card figures and charts.
I know that in the past 5 years, virtually all of my formerly cash and monthly payments by check have all gone to the credit card. Call it “convenience” of pay method. One check goes out monthly to pay the CC balance before due date.
Does that kind of activity have an impact on the CC data? Is is significant?
Thanks Wolf, this is all above my pay grade but absolutely fascinating! Looking forward to the next articles.
Per Wolf’s article from Feb 19th: Credit Card Balances are a measure of spending, not of debt.
When I discuss credit card balances in a few days, make sure to read that article all the way down because my credit card articles ALWAYS explain how credit cards are used as universal payment device, and the statement balances are what we’re looking at, even as most people pay them off entirely every month before due-date. So the credit card balances are a measure of spending, not of debt. The interest-bearing portion of credit card debt is small, and that’s a measure of debt. So make sure to read that article when it comes later this week.
I would be curious about what people don’t use credit cards for. I certainly use my credit card for virtually everything except utilities and such via online banking. My only regular use of cash is at the farmer’s market and for the young guy who does yard work for us. I withdraw maybe $200 from the ATM every month and that’s all the cash I need.
Does Wolf find any larger meaning in this huge change in how people pay for their day to day expenses?
Here’s the Swamp’s strategy for simplifying things:
One credit card for periodic billing items every month.
Another for Gas and auto maintenance.
Use a debit card for Internet purchases.
Use checks for all utilities, and to pay the credit cards in full every month.
Everything else I pay cash. That includes groceries, hardware stores, eating out, paying my lawn man, paying the Ms hairdresser etc
Using this methodology keeps hackers at bay, and simplifies management of my finances every month, unlike the way things were a while back.
People do not use credit cards when participating in the black market (many construction workers, many farm workers, almost all illegals, not declaring tips to the irs, illegal drug market, all criminal activity, paying anything “under the table”). I imagine the black market is pretty huge, but of course, there is no good data on it since the participants are unlikely or unwilling to admit they are participating in it.
For the past 4 decades, payments have been increasingly made electronically (credit card, debit card, ACH, other electronic payment systems such as PayPal, Zelle, etc.). That’s the long-running trend. Use of checks has been fading except for some large transactions. Cash has been losing ground even in transactions of less than $25.
There is no “larger meaning” to this other than that the internet and cellphones have changed how we pay for things. Every payment device is now connected to the internet, and electronic payments flow instantly.
In Switzerland and Germany the use of cash is still prominent.
The use of cash in Switzerland and Germany is still prominent.
Not sure everyone does this but not even sure balances are reliable as long as minimal payments are made. Every year I open a new one with 12 to 15 months 0% APR with cash bonus. It only nets me around $1,000 or so a year but free money. This probably is a very small percentage of people that do this and of course your credit can temporarily take a hit but unless you need a loan then it doesn’t matter and will recover when you pay it off. Admittedly I do see the downsides to the society but sometimes need to roll with WIIFM.
credit card balances reflect every dime of whatever you do.
We have a winnah!
20 year bond closed over 5%, beating out the 30 year. That’s OK 30 year, there’s always tomorrow.
“65% [of consumers] own their own homes” – can you point me to the source for this? Thanks
Census Bureau homeownership rate, reported quarterly. Google it. It’s highest in the Midwest (69.3%) and lowest in the West (60.6%).
Ancedotal evidence, but I know a couple of people who were just caught unaware and are now deliqent on their student loans. All of them were employed and able to pay, there was just zero alerts or notifications to them that this had resumed from their lenders. They certainly had some responsibility to monitor this, but even one email could have kept this number down a lot… I suspect that this delinquency rate will come down rapidly, but they all took huge hits to their credit scores.
Your comment highlights a problem. Many people were employed and able to repay, but they were given a free pass anyway.
How hard would it be to simply require employed people to repay their student loans? Why give everybody a free pass?
Government has not managed our money wisely. Thanks to the current administration for finally requiring some accountability in this area. Every little bit helps.
Isn’t Debt-SERVICE cost as a % of disposable income a meaningful metric?
A long-term trend on that figure would be interesting…
1. Not better, but an alternative in theory. Like with the government, we look primarily at the debt-to-GDP ratio, and secondarily at ratios based on tax receipts.
2. The problem a debt-service ratio has is that it fluctuates with interest rates and so is not a long-term indicator of the burden of the debt.
3. The problem that the consumer debt service ratio has is that the interest-paid part is very difficult to nail down, and the Fed, which tracks this, admitted that its metric had gone haywire and abandoned this metric in Q1 2024 altogether. I used to report on it a few times but gave up because it was just ridiculously screwed up, and the Fed warned about it being screwed up. So it has now switched to a new debt-service metric in partnership with Equifax, but it just started doing this new metric, and I’m going to watch it for a while before I get too excited about it, having been through the morass of its first iteration.
Thanks!
Since the GFC in 2009 I’ve been fixated on the growing use of debt in all areas of the economy: government (Fed’s and local), corporate, consumer, financial industry, and actuarial (pensions, insurance, etc). And that growth has been trending upward over the longer-term…
It seems logical that the negative stresses rising relative debt puts on economic activity and prices would have to increase as the relative debt levels increase — especially if/as interest rates increase. As rates rise, the higher systemic debt would lead to a higher level of “brittleness.” The 2010 McKinsey report “Debt and Deleveraging: The Global Credit Bubble and Its Economic Consequences” dealt with this.
I asked about debt service as % of GDP as an attempt to uncover trends that might lead to stress and price volatility.
I sure appreciate your insights and thoroughness, Wolf.
Did you know Google was plastering ad boxes over your content again?
Was that on mobile or laptop/PC?
Can you take a screenshot next time you see this and send it to me:
howlatwolfstreet@gmail.com
Thanks
Sent 3. It was Ipad.
Oh yeah, it’s not the Gigolo engine, it’s Quack Quack Getlost.
Thanks for the screenshots. It seems this was a tech issue that happens only when WS’s 3-column laptop version is reduced to a single-column format, such as on a laptop when you narrow the browser down to where WS forms just one column, or on an iPad, as in your case. Then an ad in the right column gets lost and appears in the center column on top of the text.
I don’t know why it suddenly did this, but I now temporarily rigged it, and it shouldn’t do that anymore. Can you confirm that it stopped doing it? Thanks.
A curious aside to some of this data is where goeth college. It appears that many degreed citizens are finding it hard to get a civilized job related to their field of study. Gen Z is making muffled noises hinting that a college degree is just not worth it. A crap shoot rather than a wise investment.This even includes the brain-damaging STEM studies. Why beat your brains out for four or five years only to end up doing what you would have done straight out of HS. “Would you like fries with that?”
There is a trend towards steering youth to the trades. Some companies are forgoing a BS or MS requirement in lieu of accepting quicker to get, less expensive certifications. Will youth who follow these routes turn out, in the future, to have made wise choices? Time will tell
Household debt has significantly outpaced inflation over the last 20 years, but so has disposable income? Really?
In other words, the concentration of wealth continues…
Yes, and by a wide margin. Adjusted for inflation, “real” disposable income has risen by 52% in 20 years.
So what’s with the constant narrative of wages not keeping up with inflation?
“BS,” that’s what it is over the 20-year period. But there was a period in 2021 and 2022, when the suddenly surging inflation overshot wage increases by quite a bit, and “real” disposable income declined. That ended in late 2022, and in 2023, 2024, and so far in 2025, wages have increased faster than inflation, and real disposable income growth was substantially positive.
When we look at the economy, we look at all consumers’ debts, and all consumers’ disposable incomes. That’s what matters for the overall economy. Sure there are some individuals whose wages didn’t keep up with inflation, and there are others whose wages overshot inflation by a wide margin, but that’s a topic for a social studies site and social justice site, not here.