Student loans are loans again, OOPS.
By Wolf Richter for WOLF STREET.
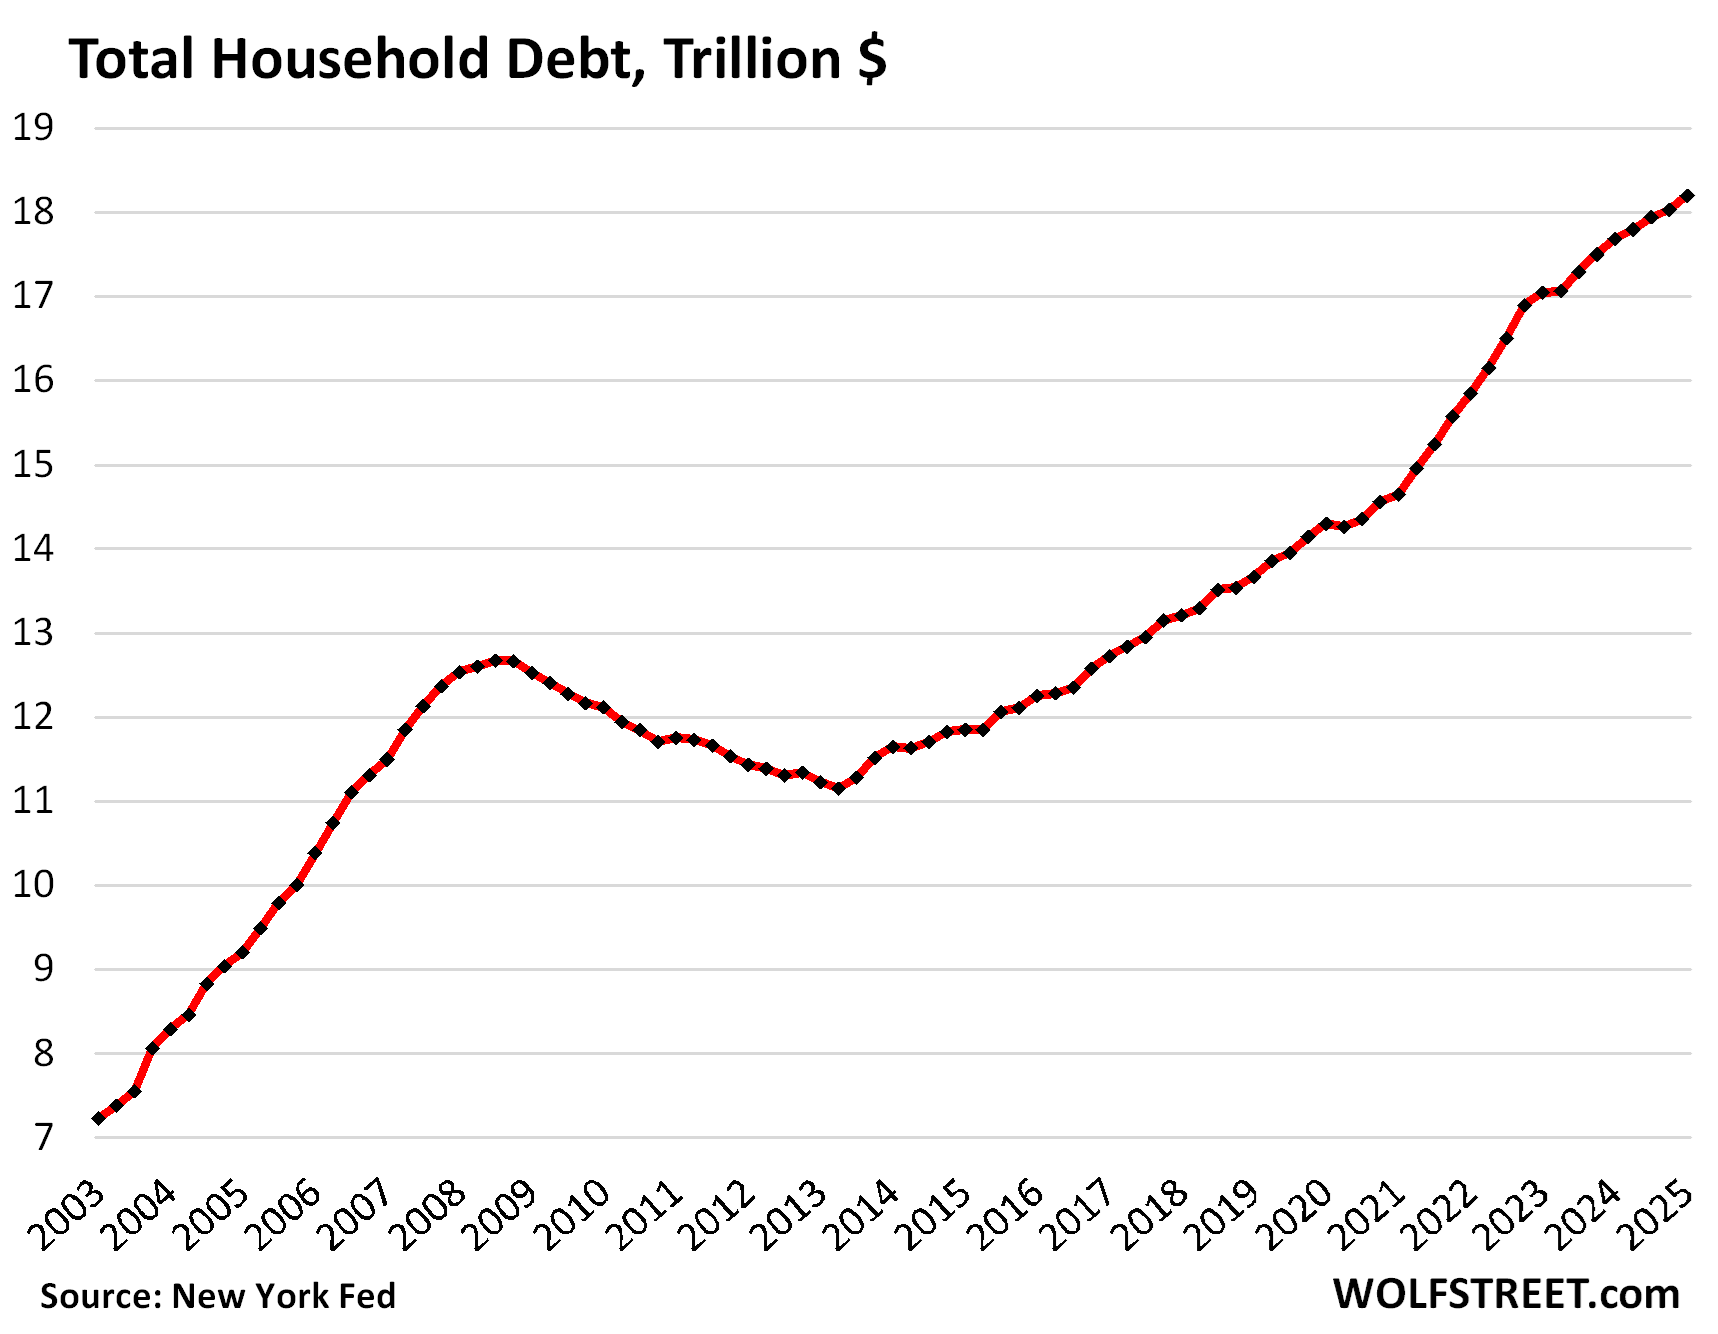
Total household debt outstanding rose by $167 billion in Q1, or by 0.9%, from Q4, to $18.2 trillion, according to the Household Debt and Credit Report from the New York Fed today. Year-over-year, total household debt grew by $516 billion, or by 2.9%, the smallest growth rate since Q1 2021.
And spread over 2.08 million more workers (+1.3%) year-over-year, amid higher wages that helped boost disposable income by 4.0% year-over-year, the overall burden of their debts in terms of their income (the debt-to-income ratio) declined even further; more in a moment.
Balances declined quarter over quarter in the categories of auto loans, credit cards, and “other” revolving credit (personal loans, BNPL loans, etc.). Balances increased in the other three: mortgages, HELOCs, and student loans. We’ll get into housing debt, auto loans, and credit cards each in a separate article over the next few days. Today, we’ll look at the overall debt, its burden, delinquencies, collections, foreclosures, and bankruptcies.
The burden of household debt: Debt-to-income ratio.
A classic way of looking at the burden of household debt is the debt-to-disposable-income ratio, which accounts for more workers and higher incomes.
Disposable income, released by the Bureau of Economic Analysis, is household income from all sources except capital gains, minus payroll taxes: So income from after-tax wages, plus income from interest, dividends, rentals, farm income, small business income, transfer payments from the government, etc. This is essentially the cash that consumers have available to spend on housing, food, toys, debt payments, etc. And what they don’t spend, they save.
Disposable income rose faster than debt in Q1:
- QoQ: disposable income +1.6%, total debts +0.9%.
- YoY: disposable income +4.0%, total debts +2.9%.
So the debt-to-income ratio declined to 81.9% in Q1, the lowest ratio in the data going back to 2003, except for a brief period during the free-money-stimulus era that had inflated disposable income into absurdity.
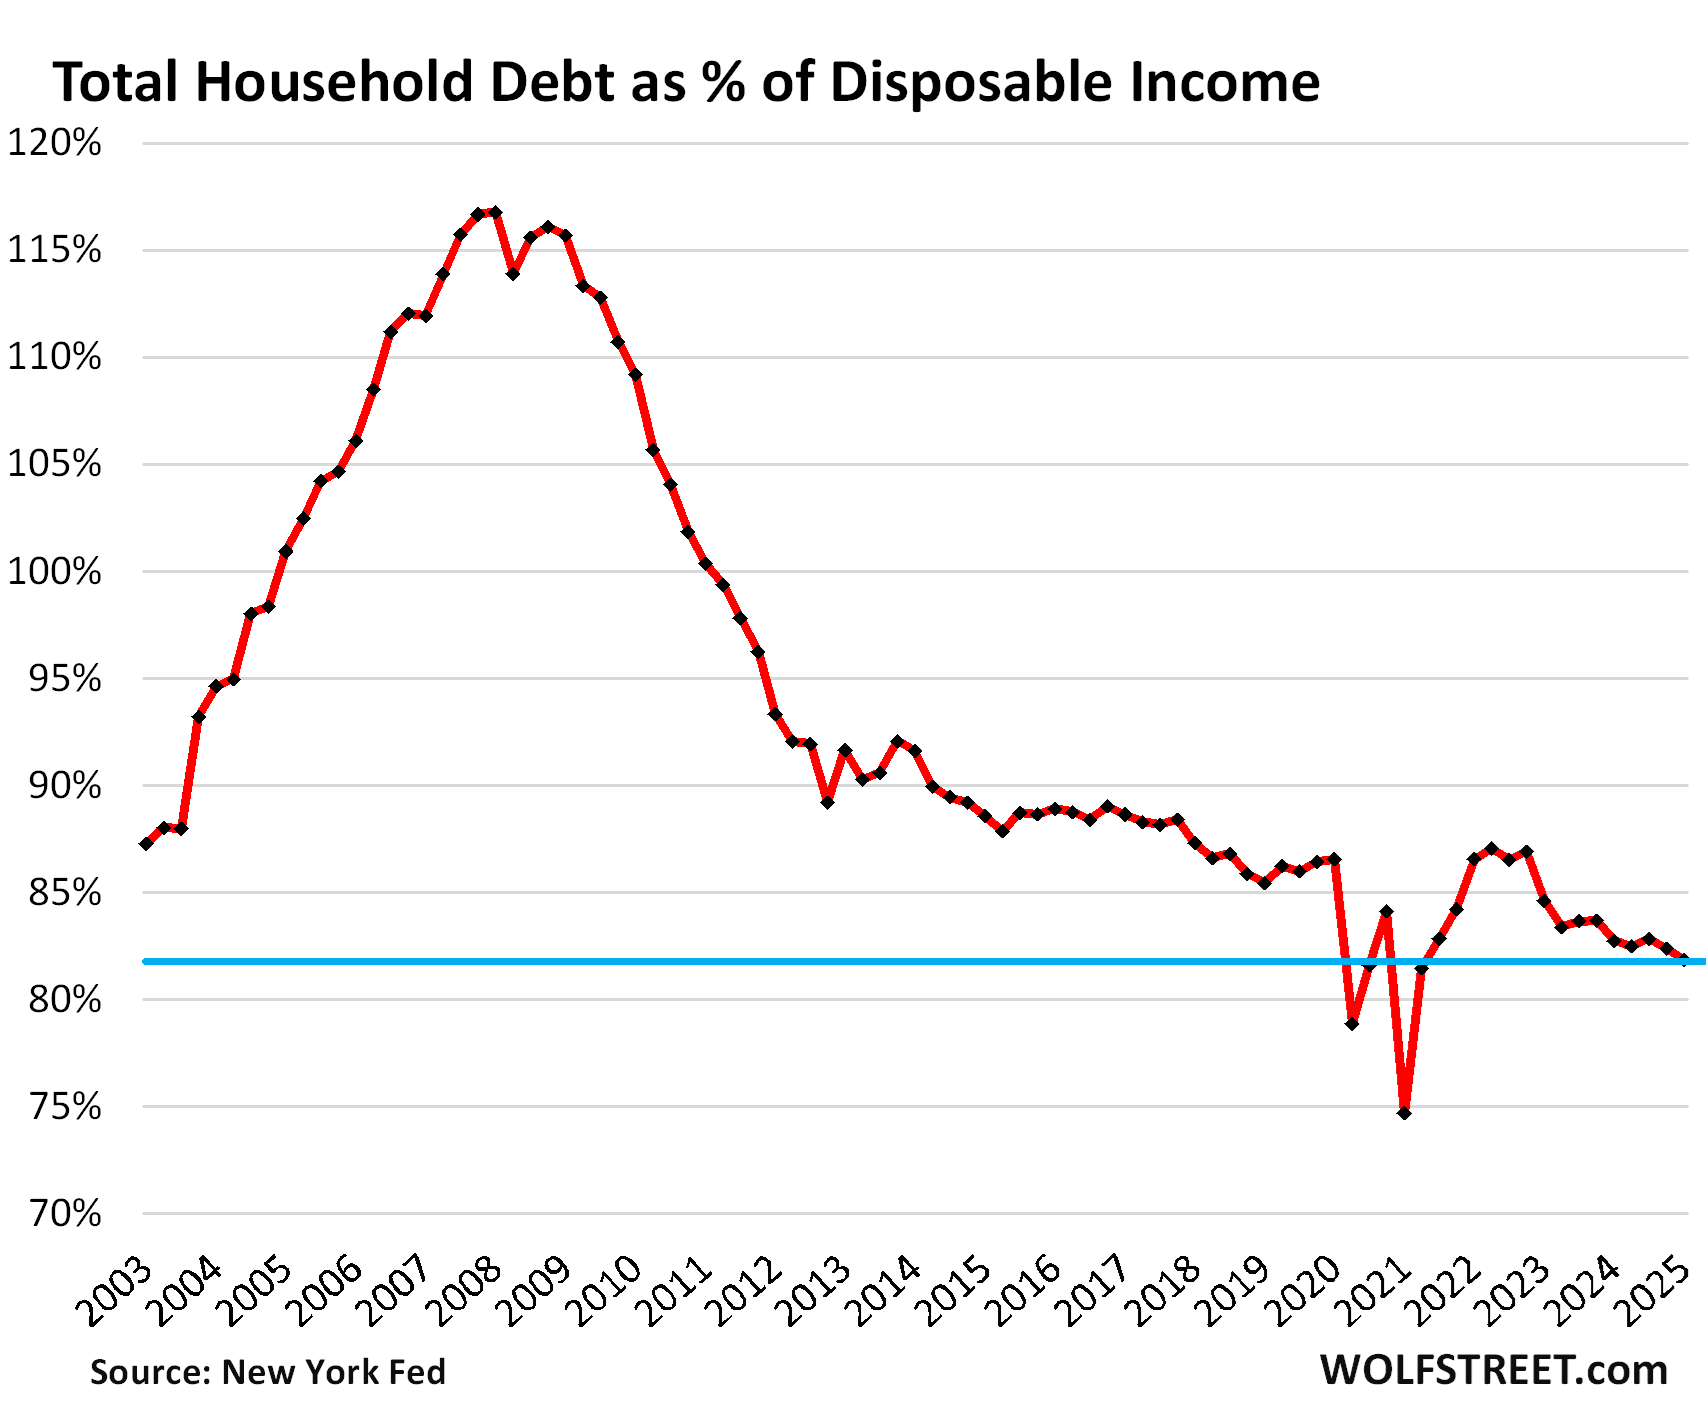
So the aggregate balance sheet of consumers is in good shape. That is not to say that subprime-rated borrowers – a small subset of consumers that’s always in trouble – isn’t in trouble with precariously high debt-to-income ratios and a tangle of bad credit, which is why this segment is called “subprime.”
The heavily leveraged economic entities aren’t consumers. It’s the federal government [we get into the weeds here: US Government Fiscal Mess: Debt, Deficit, Interest Payments, and Tax Receipts]; and many businesses.
This balance-sheet strength of consumers — 65% own their own homes, over 60% hold equities, they sit on $11 trillion in money markets and CDs, and their debt burden is at historic lows — explains in part why growth of consumer spending has held up well, despite higher interest rates.
Our Drunken Sailors, as we lovingly and facetiously call them, learned a lesson and became a sober bunch, most of them, after they blew up their balance sheets in the early 2000s – and in the process, the banks.
Student loans are loans again. OOPS.
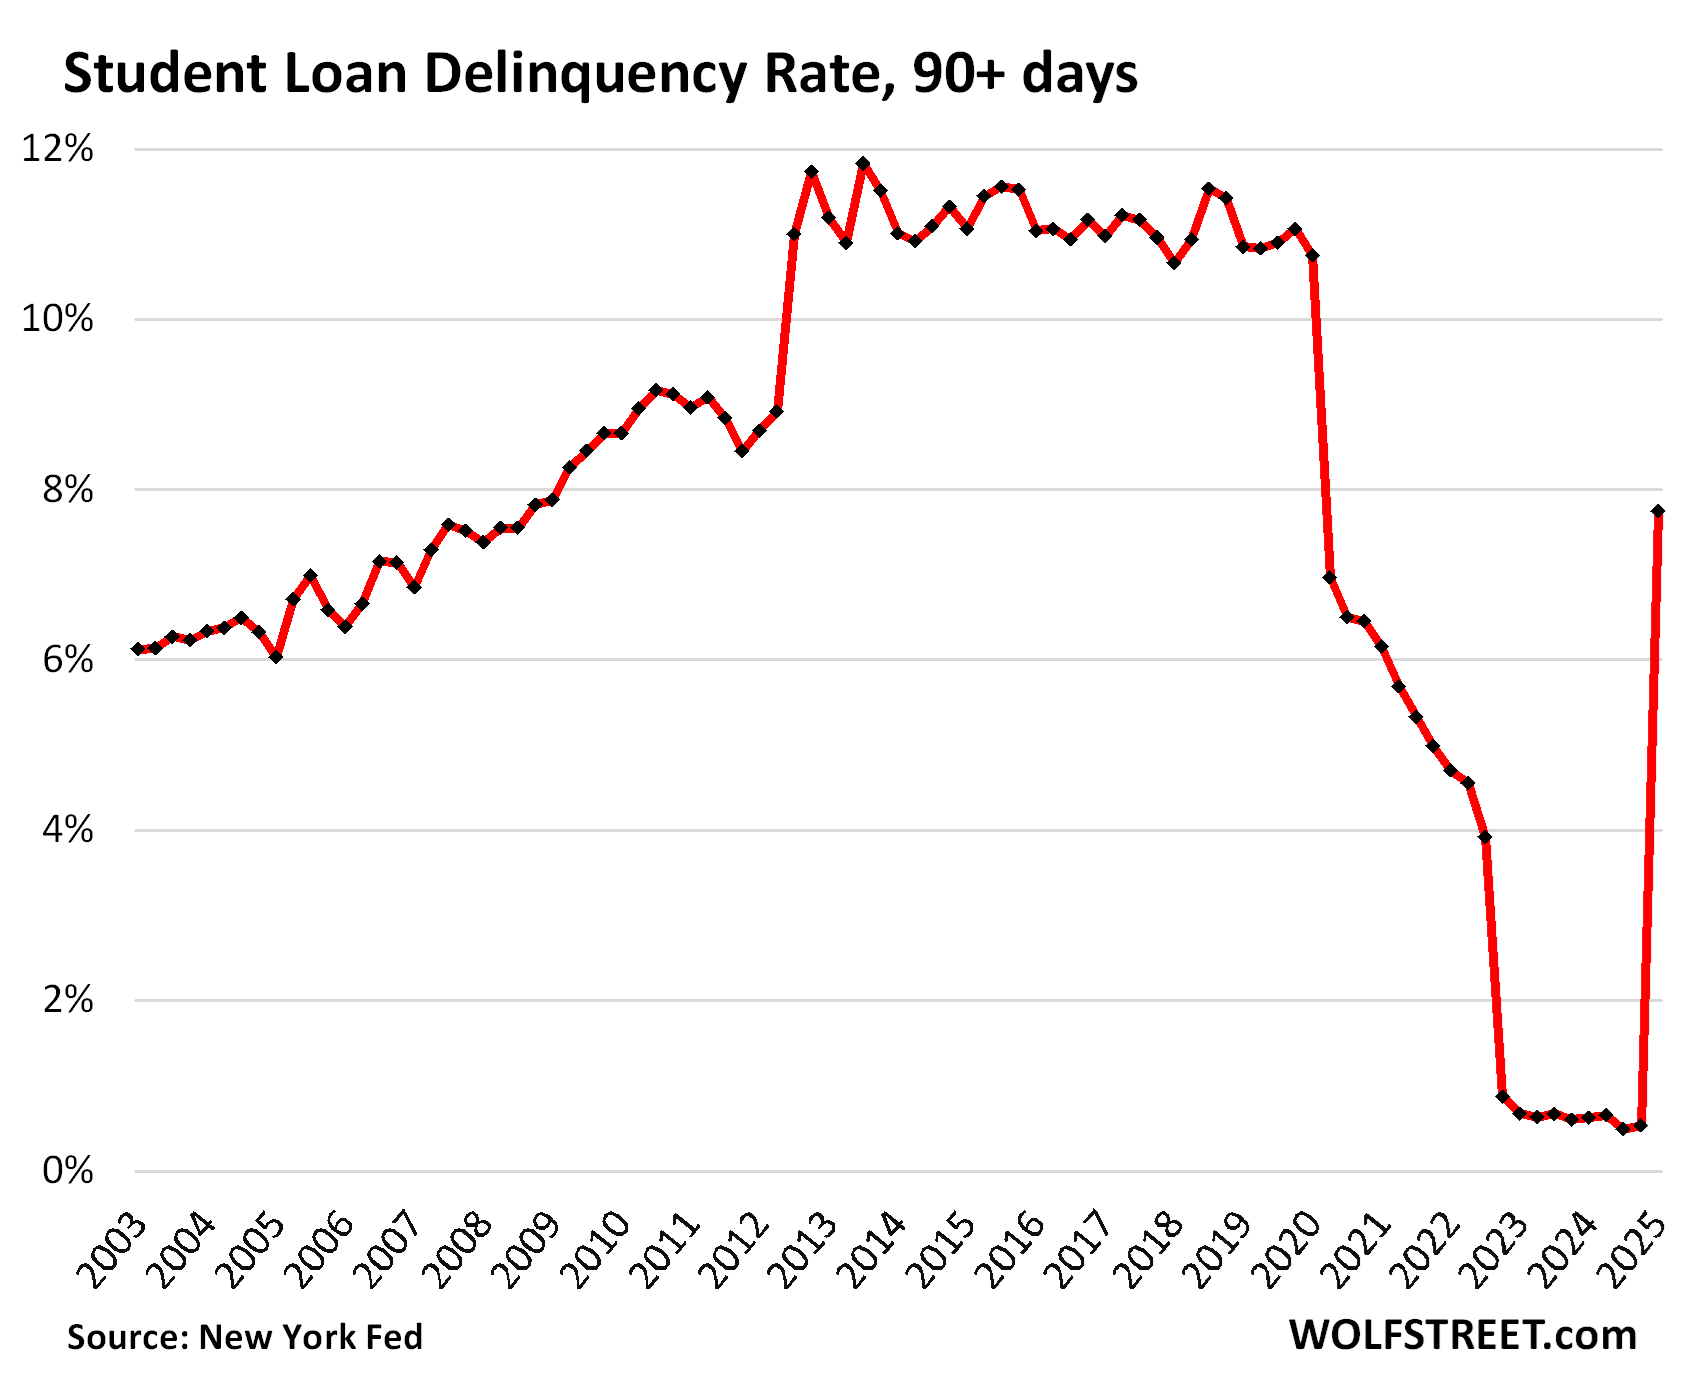
There for a while, student loans weren’t really loans anymore. Borrowers didn’t have to make payments, interest didn’t accrue, nothing was delinquent despite years of not making payments, a bunch of them were forgiven by the Biden administration, and some of those forgiven loans remained forgiven, but other forgiveness strategies lost in court and became unforgiven again, etc. And now this whole mess officially became a mess again when these delinquent balances became officially delinquent again.
So the serious delinquency rate (90 days or more past due), after having been near 0% for over two years, re-spiked to 7.7% in Q1, according to the NY Fed’s report today, based on Equifax data. And it will likely do some more catching up in Q2.
Total student loan balances rose to $1.63 trillion in Q1, and $126 billion of it was 90 days or more delinquent. In fact, much of it was years delinquent suddenly again.
This chart looks obviously funny. Student loans are now largely a creature of government, and government can do funny things, such as trying to forgive student loans (this was taxpayer money they were trying to give away) but not getting away with it:
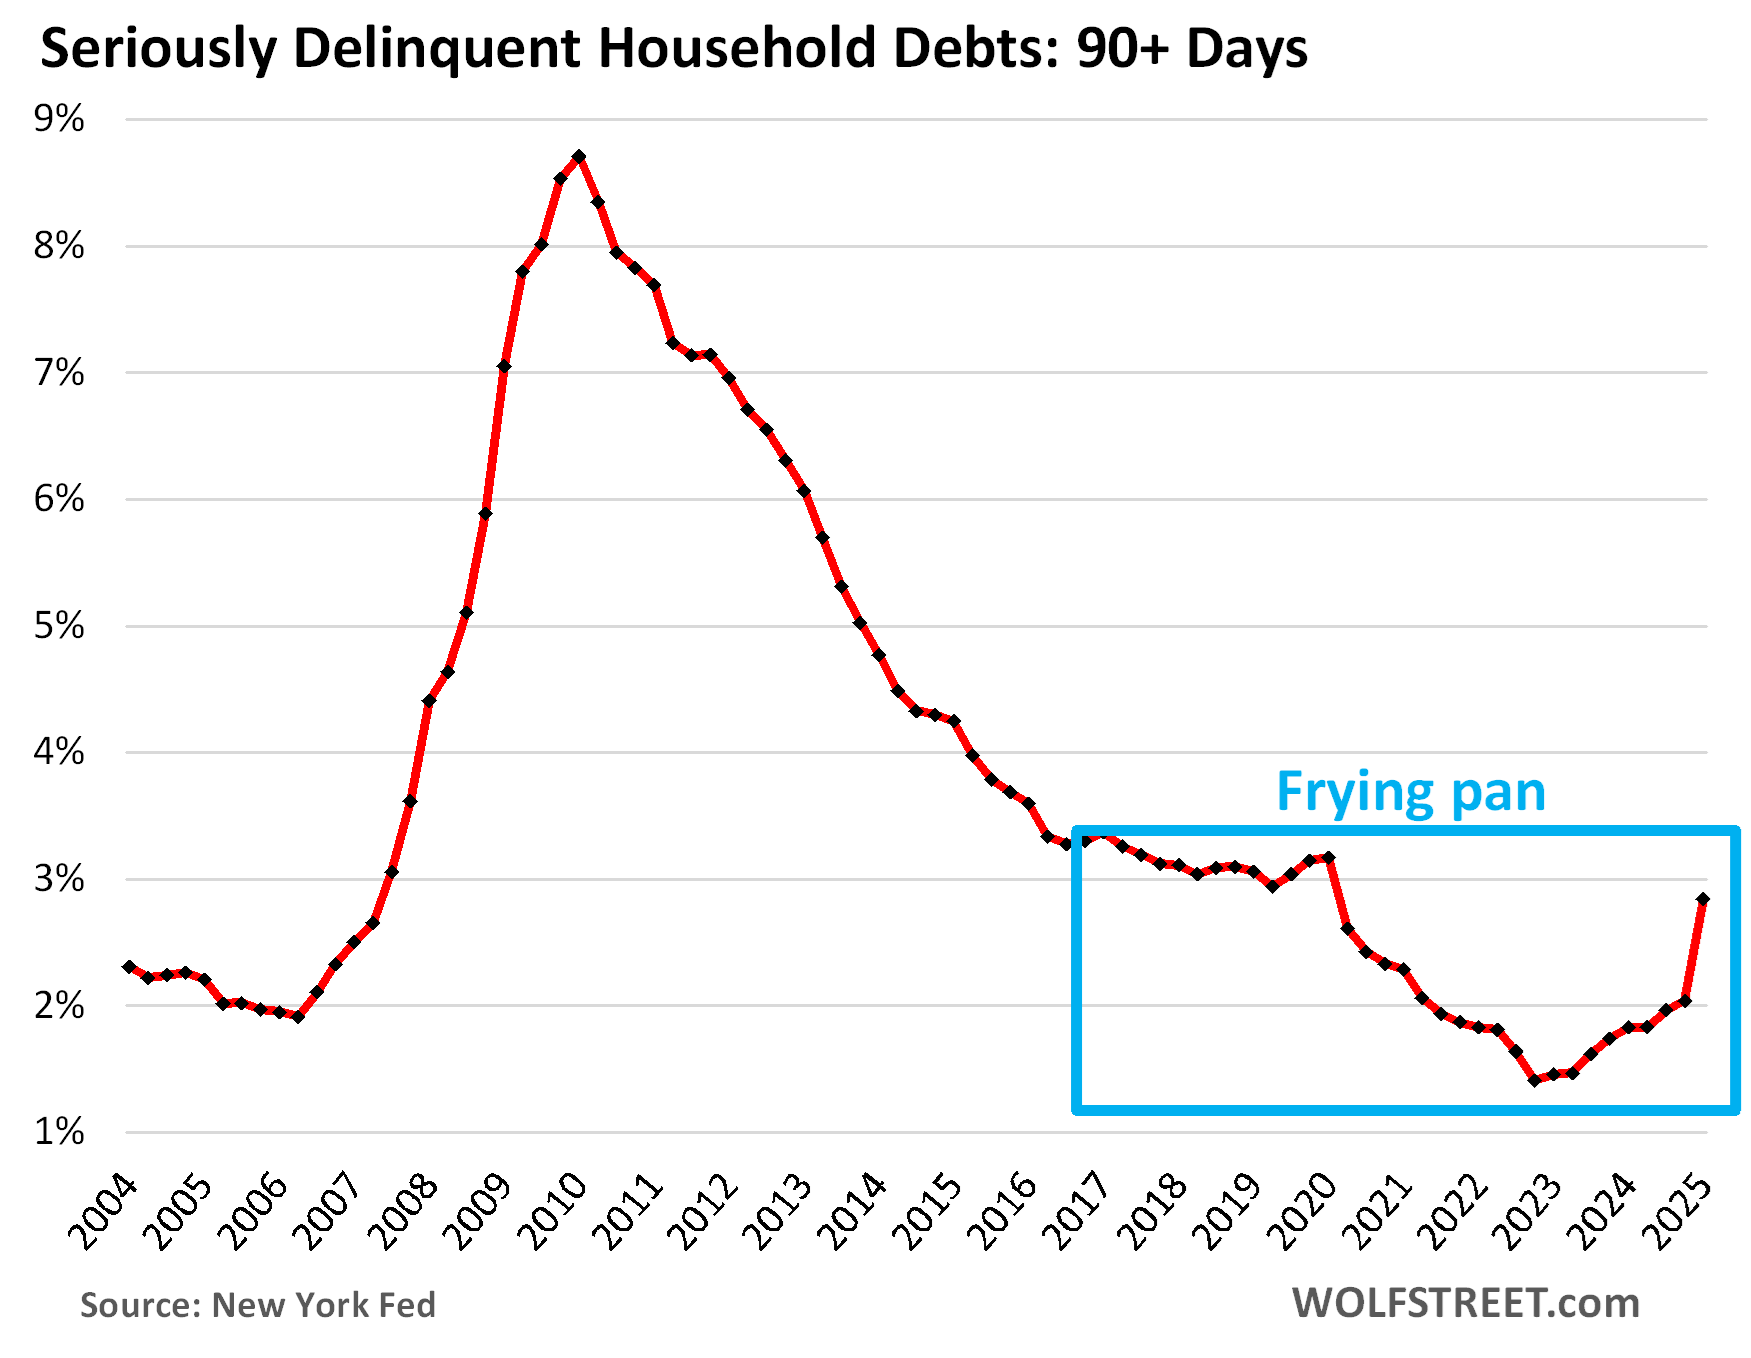
The overall delinquency rate got whacked by the sudden student loan delinquencies and spiked to 2.8% in Q1 from 2.0% in Q4. But even 2.8% was still below prepandemic levels.
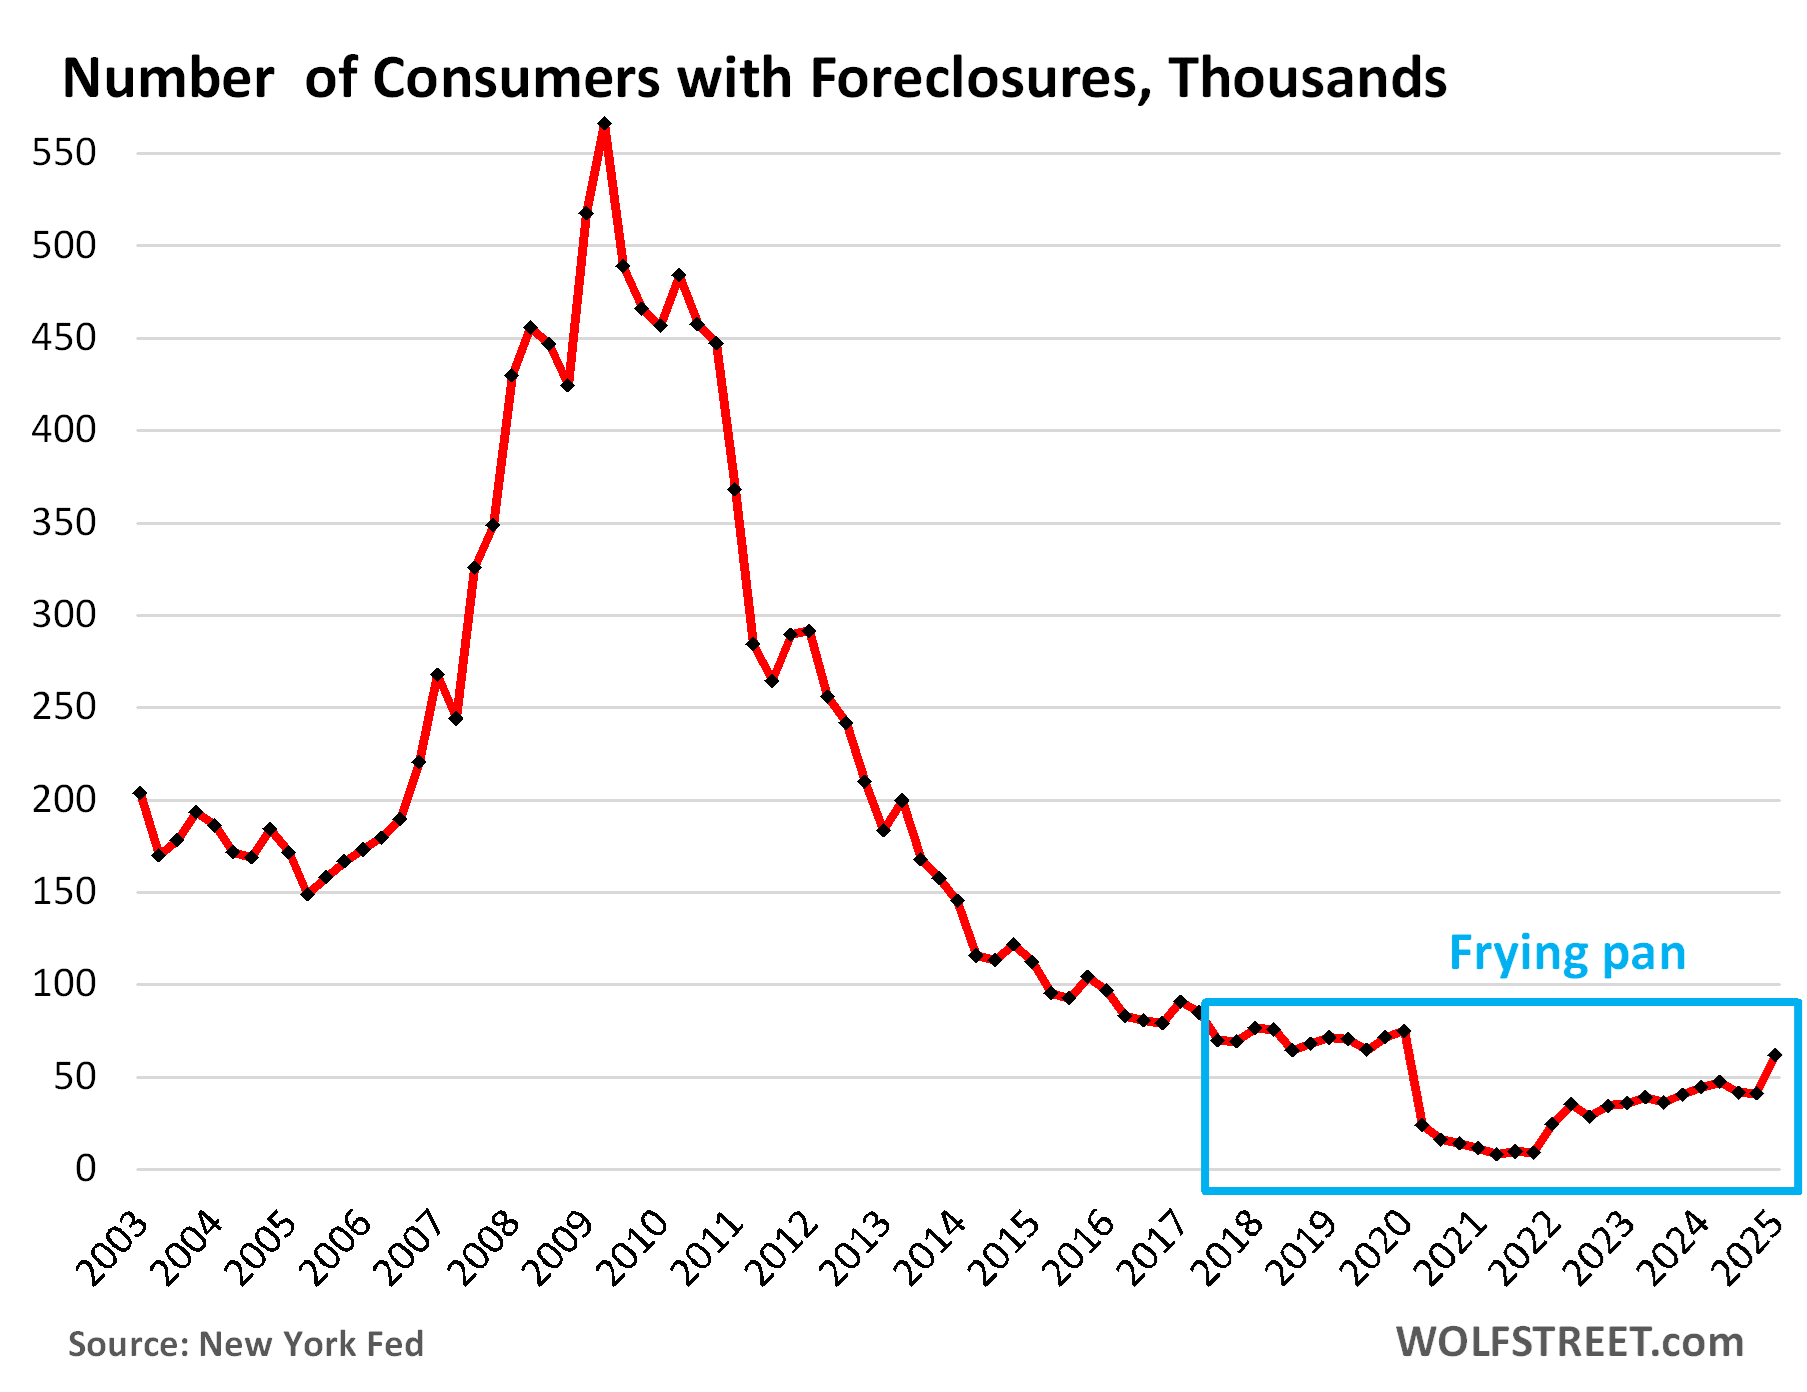
The infamous “frying pan pattern” – so dubbed right here some time ago – is now forming, where the panhandle represents the prepandemic level, the pan represents the free-money level, and the other edge of the pan represents the post-free-money return to prepandemic levels:
The foreclosures frying-pan pattern. The number of consumers with foreclosures in Q1 rose to 61,660, still below the range of the Good Times in 2018-2019 between 65,000 and 90,000.
During the Free-Money era, which included government-sponsored mortgage-forbearance programs under which foreclosures were essentially impossible, the number of foreclosures fell to near zero.
What is keeping foreclosures still low currently is that home prices exploded during the free-money era, by 50%, 60%, or more in many markets, so most strung-out homeowners can sell their home for more than they owe on it, pay off the mortgage, and walk away with some cash, and their credit intact.
It’s only when home prices spiral down for years, which they started to do in some markets – here is a look at condos in 15 big markets with price declines of 10% or more – that foreclosures can become a problem.
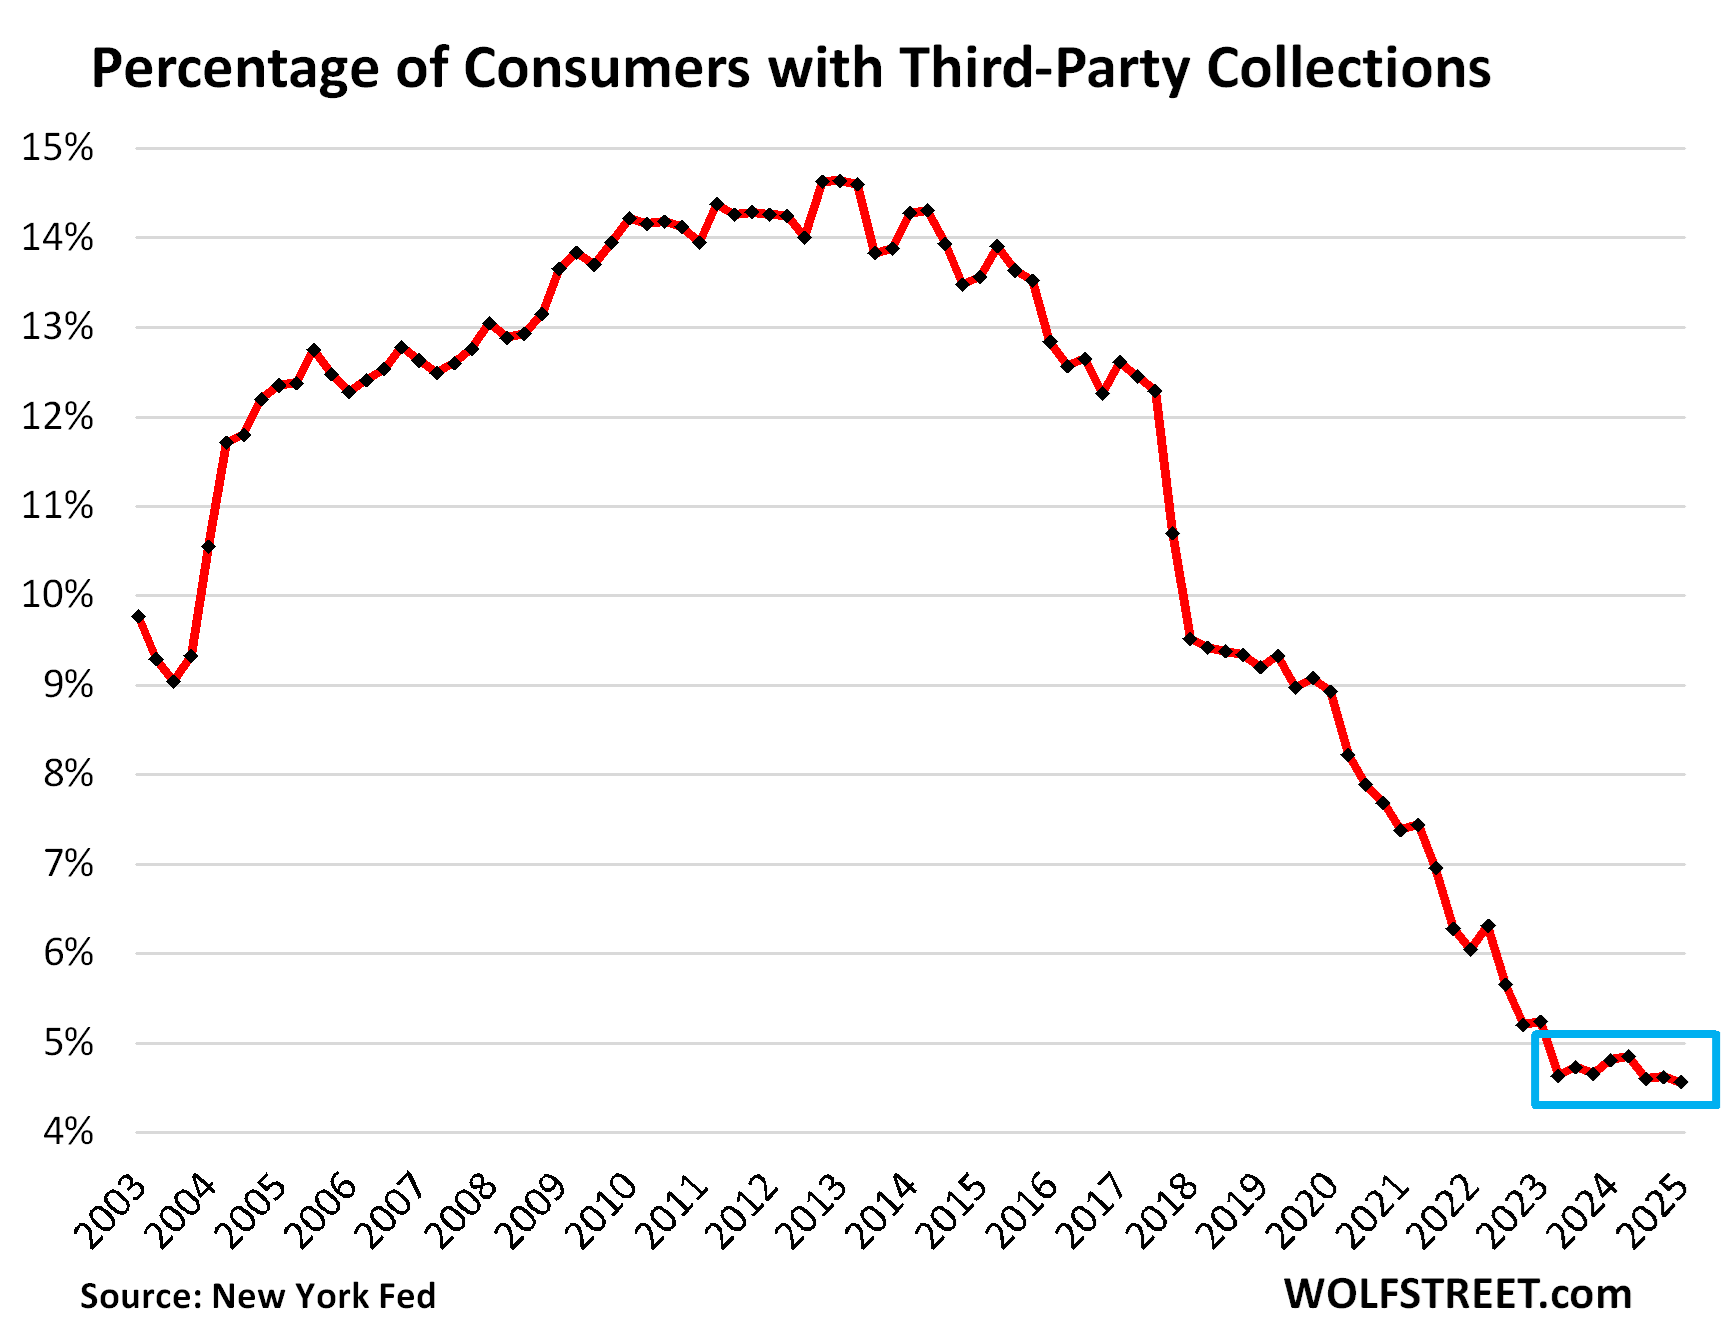
Third-party collections crawl along rock bottom. A third-party collection entry is made into a consumer’s credit history when the lender reports to the credit bureaus, such as Equifax, that it sold the delinquent loan, such as credit card debt, to a collection agency for cents on the dollar. The New York Fed obtained this data on third-party collections in anonymized form through its partnership with Equifax.
The percentage of consumers with third-party collections has hobbled from record low to record low since the advent of free money in Q2 2020, and even after the free money vanished, third-party collections continued to hit record lows and in Q1 edged down to a new record low of 4.56%:
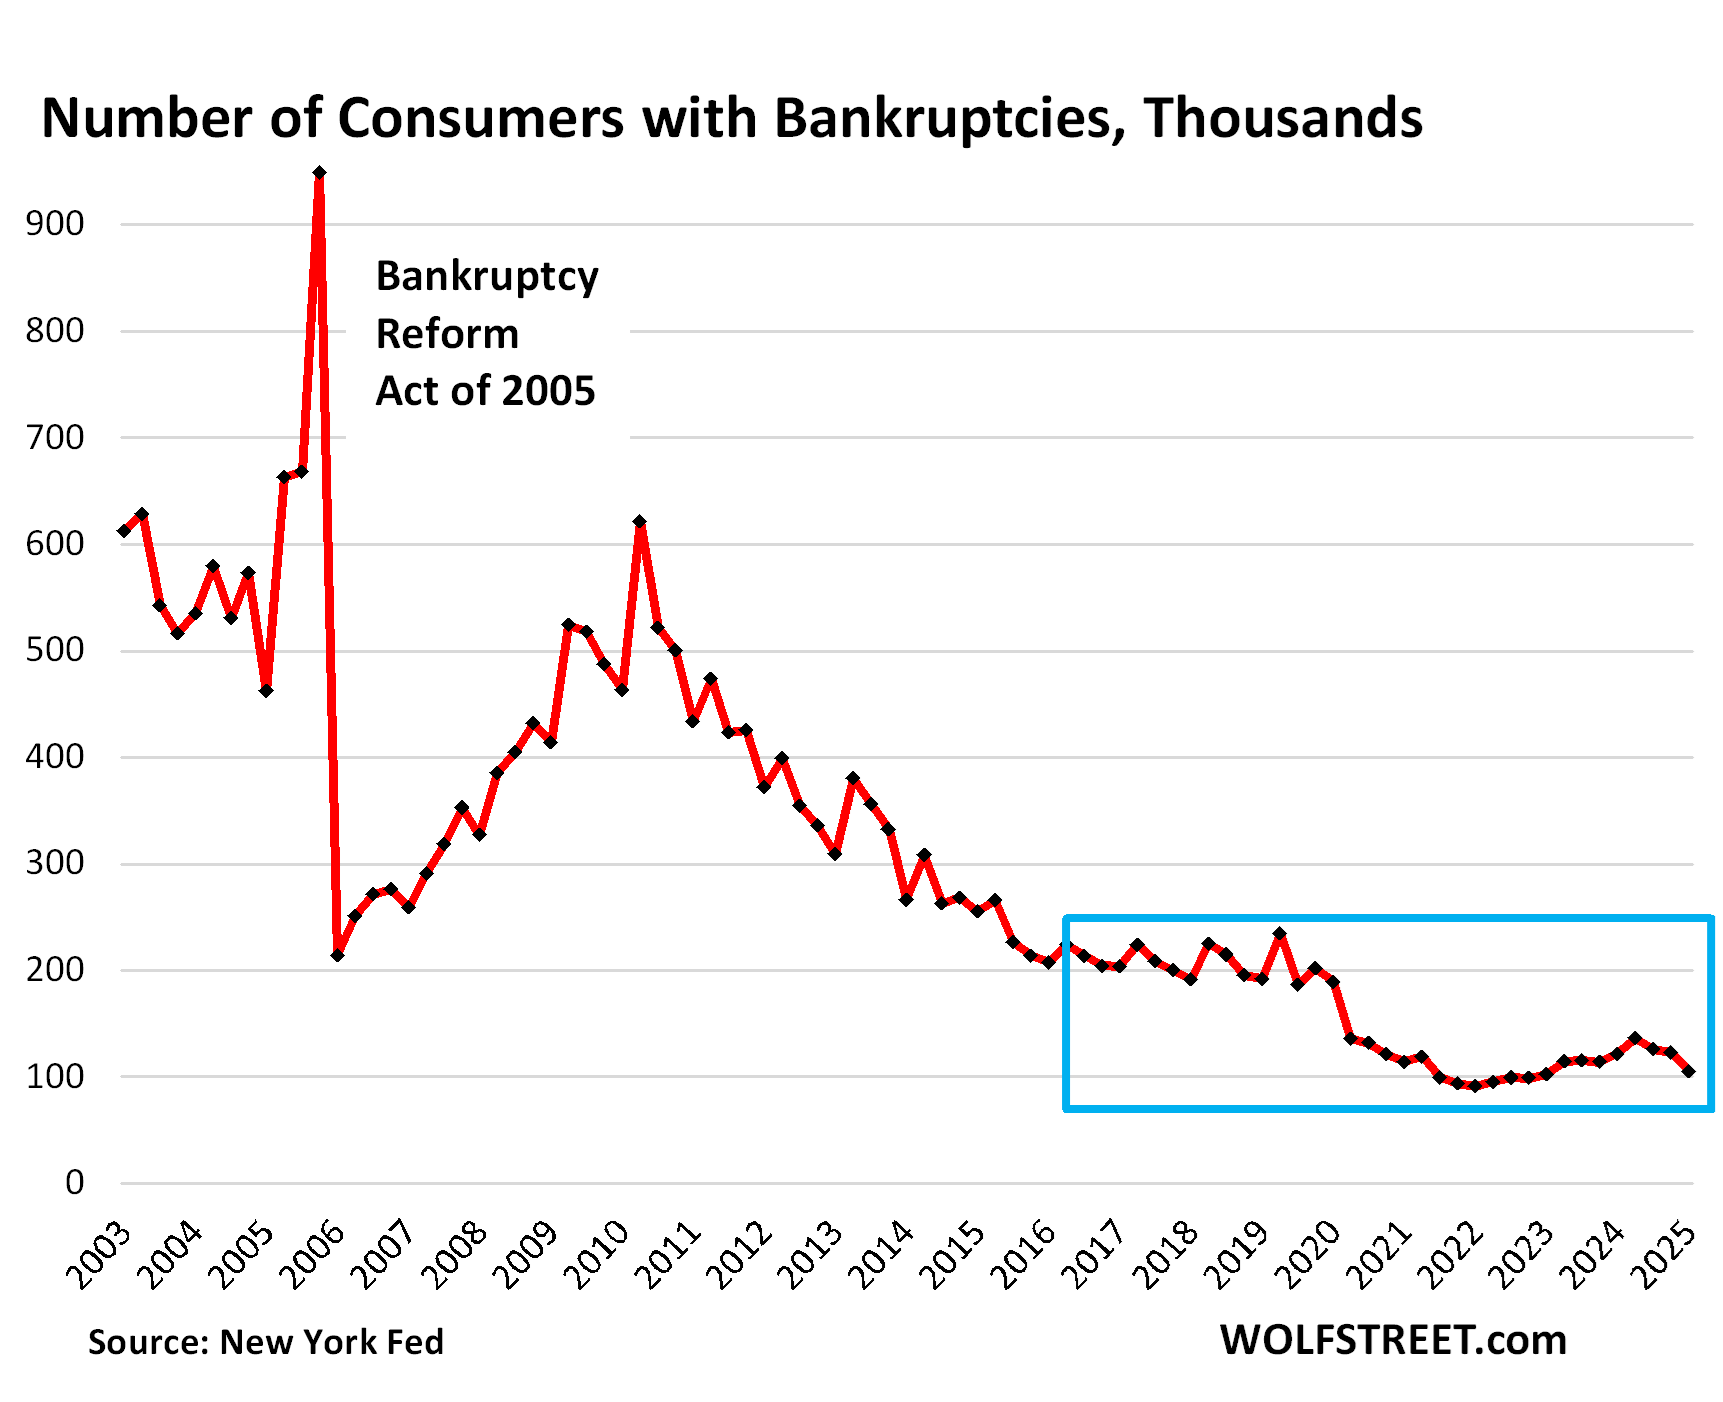
Bankruptcies form a “broken frying-pan pattern,” a new phenomenon here. The number of consumers with bankruptcy filings dipped to 104,860 in Q1, the third quarter in a row of declines, and now just a hair above the all-time free-money low in Q4 2021.
During the Good Times before the pandemic, the number of consumers with bankruptcy filings ranged from 186,000 to 234,000, which had also been historically low.
This decline in bankruptcy filings broke the side of the pan that is opposite to the handle and forms an odd-looking broken frying-pan pattern.
We’re going to wade into housing debt, credit card debt, and auto debt in separate articles over the next few days. Next one up is housing debt.
Enjoy reading WOLF STREET and want to support it? You can donate. I appreciate it immensely. Click on the mug to find out how:

![]()
The government, or I should say the taxpayers, should never have been giving loans to students. Colleges and universities should be the ones to give them loans. They are the ones who profited from them.
Governments do a lot of things they should have never done. The problem always is, what should you do after you’ve done things you should’ve never done. Undoing them is not straightforward.
The topic shouldn’t be the loans, the topic should be how the educational system is financed. Universities core goal should be to deliver high-quality education against a low cost to society, not to make profit. Running universities as a company is a choice, not a necessity. Virtually every developed Nation has subsidized education to avoid developing an education based class structure, they sponsor tuition fees, they have loan programs for student living costs which are then payed off based on income capacity, and lastly, they all score higher than the U.S. on higher education. Not to mention the myriad of other problems created by burdening young people with high debts.
Hi thurd2,
The immutable Law of Supply and Demand when applied to Student loans predicts two macroeconomic effects.
Student loans will inevitably both increase the cost of attending college and debase the value of a college degree.
But, but, but…….
The notion that the government should “never” be “giving” loans for higher education is absurd… It was a good idea to help increase national STEM knowledge in the US in the cold war and its a good idea now. Good doesn’t mean perfect or without problems that should be addressed. In my view not through blanket forgiveness and yes, I agree, increased college accountability and targeted at specific skills, disciplines, and/or trades.
I have been saying this for years. Time for everyone to put their money where their mouth is. In fact, maybe banks could go back to just being banks again, not gambling houses. Due diligence, what’s that?
My college career was the very early 1980s. I was from what was at the time a lower middle-class family and was the first in my family to go to college. At the time, attending the University of Florida was heavily subsidized by the State of Florida (with associated price controls). I don’t remember the prices, but I could pay for everything with $30/month from my parents and the school’s work program, where I put in 20 hours/week cleaning labs, shelving books, whatever labor was needed. Oh, and I did earn important beer money in the summer working construction. Graduated with zero debt. In order to cut taxes, the State has basically ended subsidizing college. So students have to borrow to attend. When the private sector wasn’t willing to give a whole bunch to 18 year olds, the feds stepped in. When colleges found out they could charge the feds whatever they wanted, costs blew through the roof.
agree with your general point, but with regard to florida, everyone reasonably smart qualifies for bright futures now, and tuition is paid for. you still have room and board, but you can attend a school near your hometown and live with the parents for free, which many kids do.
they almost hinted at culprates of HIGH COST universities
student loans
but IMHO make school responsible for 50% of loan and watch how many DON”T GET THEM
“When colleges found out they could charge the feds whatever they wanted, costs blew through the roof.”
Same thing happening in INSURANCE and HEALTH CARE…
Hmmm, maybe there is a common denominator here, maybe having the government pick winners and losers isn’t such a smart idea…
Now let’s talk about MILITARY/DEFENSE spending shall we…
LMFAO!
Worked my way through school after building houses and pools for three years. Impossible to do now, thanks to the under reporting of inflation.
Remember, the formula for calculating inflation changed in the 80’s.
Looking at these numbers, it seems that we are nowhere close to a recession or a housing crash.
Hi Vlad,
I live in the Eastern Time Zone and was up very early this morning. By chance I happened to catch Trump’s (or tRump’s for those who prefer that moniker) remarks to the GCC which were carried live on the Fox Business channel.
After the President concluded I idly switched over to catch the market data on Bloomberg TV and was bemused by their reporting on the event I’d just watched live.
It seems i must be existing simultaneously in two universes with alternate realities.
Those conflicting interpretations of the numbers you mentioned only seem to confirm my suspicions.
I’d have to agree, unless a Black Swan event occurs.
Like the Anti-Christ is already here in plain sight? Ushered right in by the same people who believe in The End Times.
🙄
Whaaat?
Yeah the data say it’s a pretty uneventful time. About the only thing to report is the air slowly going out of the housing bubble. But I remind people that we already had several mini-crashes in the 2020s, including a very steep crash in 2020. The expected hard times didn’t materialize and the busts just didn’t last.
the hard times didn’t materialize because all pain was covered over with federal borrowing or printing, or both. as long as the federal government subsidizes all problems, and as long as it can borrow unlimited amounts of money for 4.5%, there will never be a recession or any real hard times.
Hardly all pain was covered. Small businesses were decimated. Though some shouldn’t have survived and this period quickened their demise. But the government absolutely shit the bed and didn’t help small business. Several of us obstinate ones maxed our credit lines. And if you were part of those, like me, with a small rental portfolio, you were awarded renters that didn’t have to pay rent for a period. Yet we still have mortgages. Yes. I’m still bitter the government bent me over while frivolously giving money to those that didn’t need it. Still climbing out of that hole years later
mike, i don’t disagree that the pandemic response was an abomination, and that small businesses who were forced to close got hosed, while small landlords also got hosed.
but my larger point stands. no one ever really lost their jobs and thus cut back on spending, because federal largesse ensured that would never happen. that’s been the case since 2011 or so.
AIG and Chubb pulled out of my ski town neighborhood. Even if you are cash buyer no one wants to be self insured for a portion of their home or pay top dollar for insurance. If you have multiple homes the carry cost is going up faster than the appreciation, it’s time to reduce houses and sell! I believe wolf evidence that the housing bubble is popping. I believe we will experiencing a dot com bubble like event with AI and mag 7 and a housing crash, a one two punch with side of inflation and rising long bond yields. I know risk has been on fire for the past month and the $vix is beat down(due to bounce). Housing mopped up covid liquidity, now that liquidity is evaporating from housing. You guys are talking about black swan events, it would take a black swan event to create enough new liquidity to keep this thing going higher.
re: “it would take a black swan event…”
There have been seismic changes in the money market propelling the economy forward. The O/N RRP facility being one. The flow of funds through the MMMFs another (representing the activation of monetary savings).
I.e., funds flowing through the MMMFs, from the payment’s system, increase the supply of loanable funds, but not the supply of new money – a velocity relationship.
That and the shifting of funds from “time deposits” to transaction’s deposits in the payment’s system increasing AD.
We are experiencing a supply demand shock in the price of oil.
Short-term money flows, the volume and velocity of our “means-of-payment” money supply is still positive.
I wouldn’t put it past the government to engineer another event as an excuse to create new liquidity to prop everything up.
Those charts are pretty amazing. It seems that the strong consumer balance sheets correlates very well with “free money”. Correlation is not causation of course.
Curious if this debt includes margin loan debt?
If not, it would be interesting to see what the total debt to disposable income ratio is with that included.
Margin loans are in the brokerage system and included margins loans to investment firms, hedge funds, other firms, and households all combined. There is no figure for household margin loans alone. They’re relatively small in the overall debt, at about $800 billion spread over investment firms, hedge funds, other firms, and households.
“It was the best of times, it was the worst of times, it was the age of wisdom, it was the age of foolishness”. For consumers with money it’s great for consumers without money private credit is available to keep them strung out on their lifestyle(paying for DoorDash) frying pan patterns are like bearish flags when they breakout people will suffer.,,reality happens. JNK and HYG hit all time highs this week, maybe just a function of the trading Algorithm trying to keep the risk on rally going. What’s the end game of the credit bubble? When does reckoning occur? It’s a long way down if you want to rock and roll.
This is why the economy will continue to hum along. Jobs are there, incomes are fine and debt is below its historic levels. The only real issue is government spending
Life… Be adults, pay your own bills and earn your own way. When you sink and fail, it is your own fault. Beyond that the government should not be in the handout business nor be making it easy for people to go into debt they cannot afford with useless programs to help people get loans they cannot afford based on non financial factors.
I have no debt except my regular income and real estate taxes plus daily living expenses.
Perhaps when Wolf writes about the consumer credit card debt, he could comment on what IF any impact the use of Credit Cards -in lieu of cash- or check type payments has had on the credit card figures and charts.
I know that in the past 5 years, virtually all of my formerly cash and monthly payments by check have all gone to the credit card. Call it “convenience” of pay method. One check goes out monthly to pay the CC balance before due date.
Does that kind of activity have an impact on the CC data? Is is significant?
Thanks Wolf, this is all above my pay grade but absolutely fascinating! Looking forward to the next articles.
Per Wolf’s article from Feb 19th: Credit Card Balances are a measure of spending, not of debt.
When I discuss credit card balances in a few days, make sure to read that article all the way down because my credit card articles ALWAYS explain how credit cards are used as universal payment device, and the statement balances are what we’re looking at, even as most people pay them off entirely every month before due-date. So the credit card balances are a measure of spending, not of debt. The interest-bearing portion of credit card debt is small, and that’s a measure of debt. So make sure to read that article when it comes later this week.