Homebuilders get more aggressive to sell the inventory, but prices are still far too high.
By Wolf Richter for WOLF STREET.
Despite huge inventories of new houses for sale, including completed houses, homebuilders have continued to build homes at an aggressive pace. Some of the big homebuilders, such as Lennar, have cut prices and thrown large incentives on the market, and their sales increased; while other homebuilders, such as PulteGroup, have been less aggressive on pricing and incentives, and their sales fell.
That kind of mix seen in Q1 earnings reports is also what the data from the Census Bureau today show: Inventories for sale are sky high, even of completed spec homes, but sales overall grew and were decent, while prices continue to wobble lower.
Single-family houses for sale at all stages of construction in March remained at 493,000 houses, roughly unchanged for the fifth month in a row, up by 8.4% from the bloated levels a year ago, and up by 49% from March 2019. All five months were the highest since November 2007. Inventories reached this level for the first time in October 2005, on the eve of the Housing Bust when oversupply and lack of demand nearly wiped out the homebuilders.
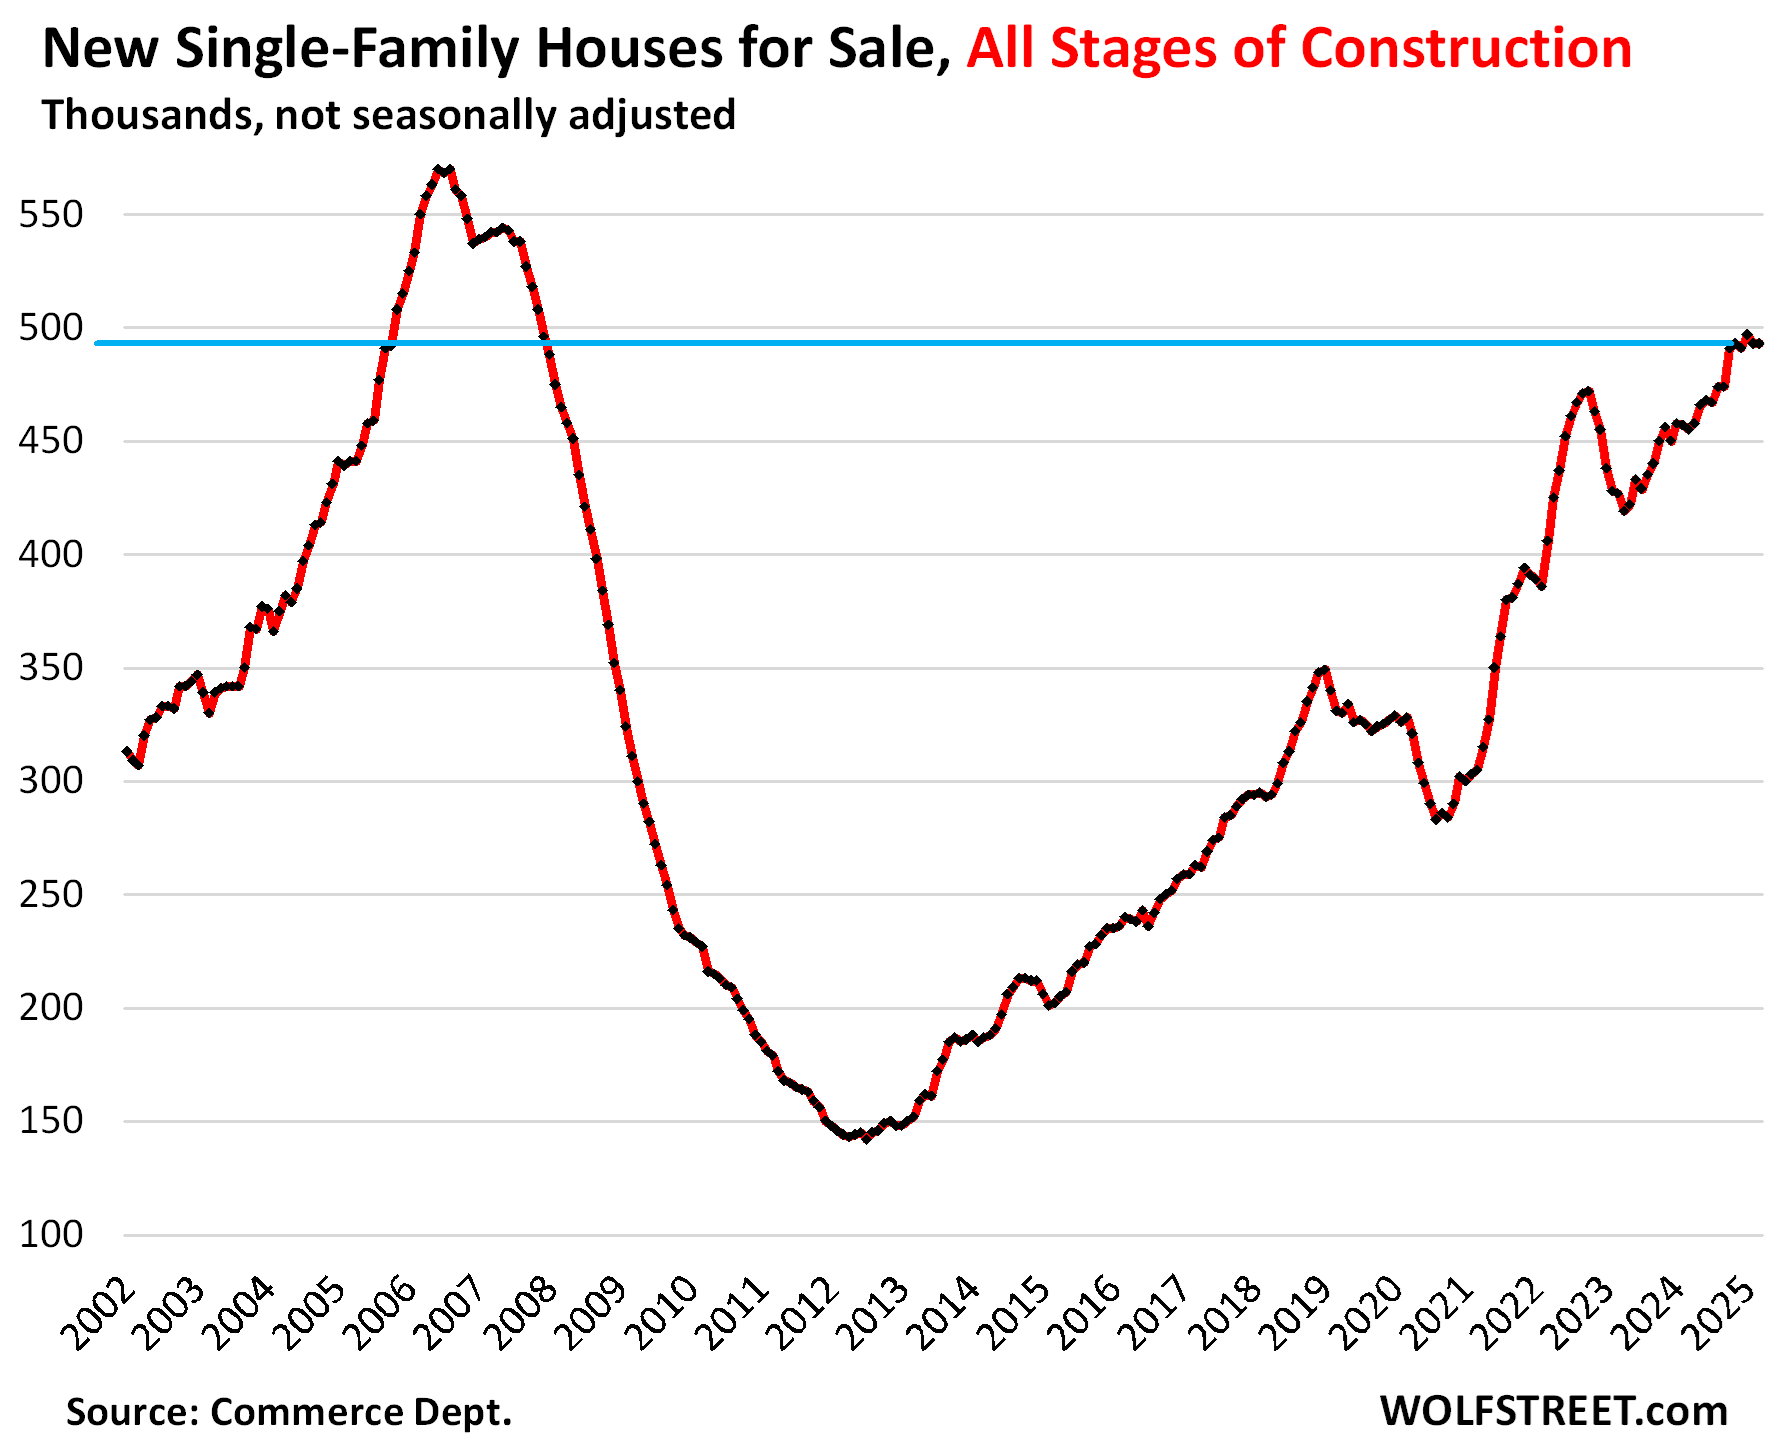
Inventory in relationship to demand: Thanks to brisk sales in March (see further below), supply improved to 7.1 months at the March sales pace.
A glut of new houses on the market is exactly what this overpriced housing market needs. And lower prices will bring out more buyers.
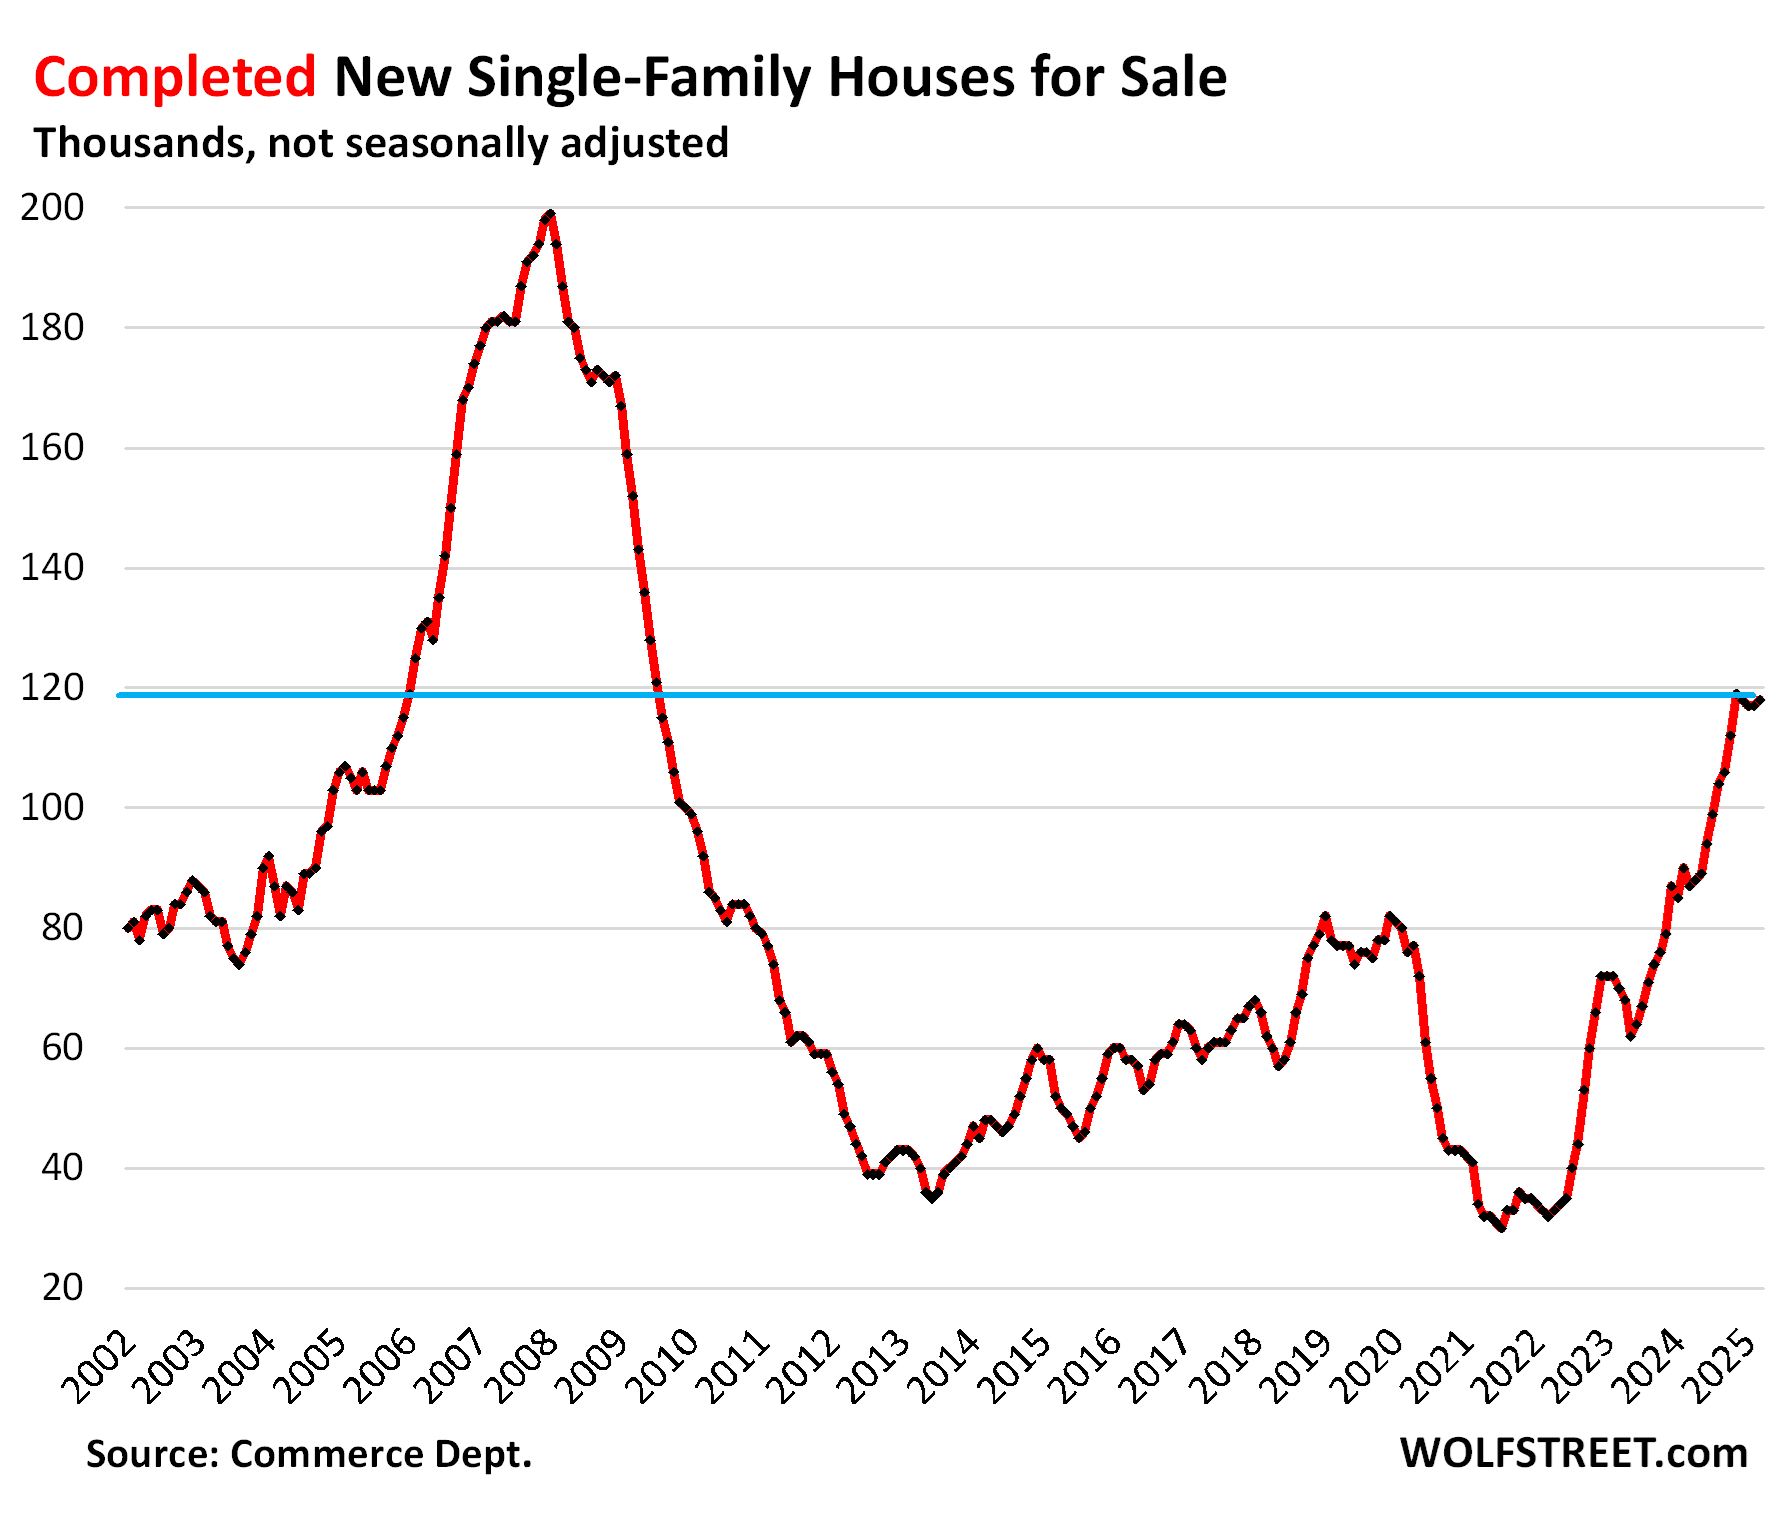
Inventories of completed new single-family houses for sale ticked up for the month and jumped by 36% year-over-year, and by 53% from March 2019, to 118,000 houses, roughly where inventories had been in January 2006, on the eve of the Housing Bust.
Homebuilders are motivated to sell spec houses quickly because they’ve sunk a lot of capital into them.
The homebuilders in Q1…
The publicly traded homebuilders have been shedding some light on how they’re dealing with this market, and their shares have zigzagged down from their highs in September, for example: DR Horton [DHI] -36%, Lennar [LEN] -39%, KB Home [KBH] -40%, and PulteGroup [PHM] -32%.
Lennar is an example of a builder that’s using lower prices and bigger incentives to increase sales, while sacrificing some of its profit margin. In Q1, year-over-year, according to its 10-Q filing on April 4:
- Average selling price (does not include costs of mortgage-rate buydowns): -1.2% to $408,000 “primarily due to continued weakness in the market.”
- Number of homes delivered: +6.2%, to 17,834 homes.
- Revenues from home sales: +5.1%.
- Gross margins: 18.7% compared to 21.8% a year ago.
“Gross margins decreased due to an increase in land costs year over year, as well as a decrease in revenue per square foot, which was partially offset by a decrease in construction costs as we continue to focus on construction cost savings,” Lennar said.
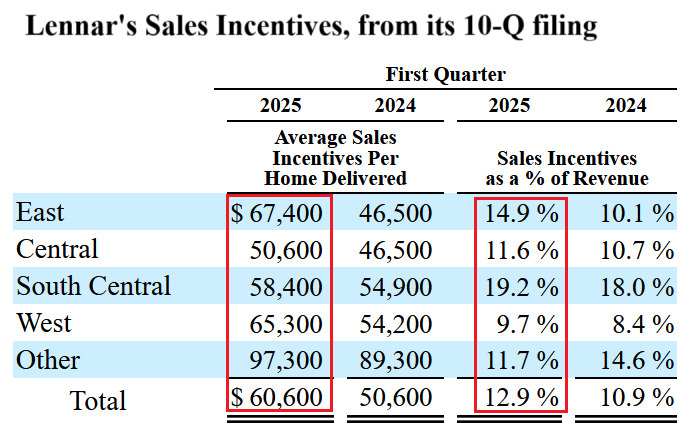
Lennar also lists its sales incentives per home sold by region. This includes the costs of mortgage-rate buydowns. Average incentives rose to $60,600 per home across the US, or 12.9% of the average selling price. These are huge incentives:
PulteGroup went the other way: higher prices, but lower unit sales, and lower revenues. It reported in its 10-Q filing on April 22:
- Average selling price: +6% to $570,000.
- Unit sales: -7.3% to 7,765 homes.
- Revenues from home sales: -1.8%.
- Gross margin 27.5% compared to 29.6% a year ago.
Homebuilders still have big-fat profit margins and net incomes — though they’ve come down — and have lots of room left to cut prices if the market forces them to before they start booking losses. For example, Lennar still booked $519 million in net income in Q1, though that’s down by 28% from $720 million a year ago. PulteGroup still booked $523 million in net income in Q1, though that’s down by 21% from $663 million a year ago. They’re not at the end of their rope of price cutting.
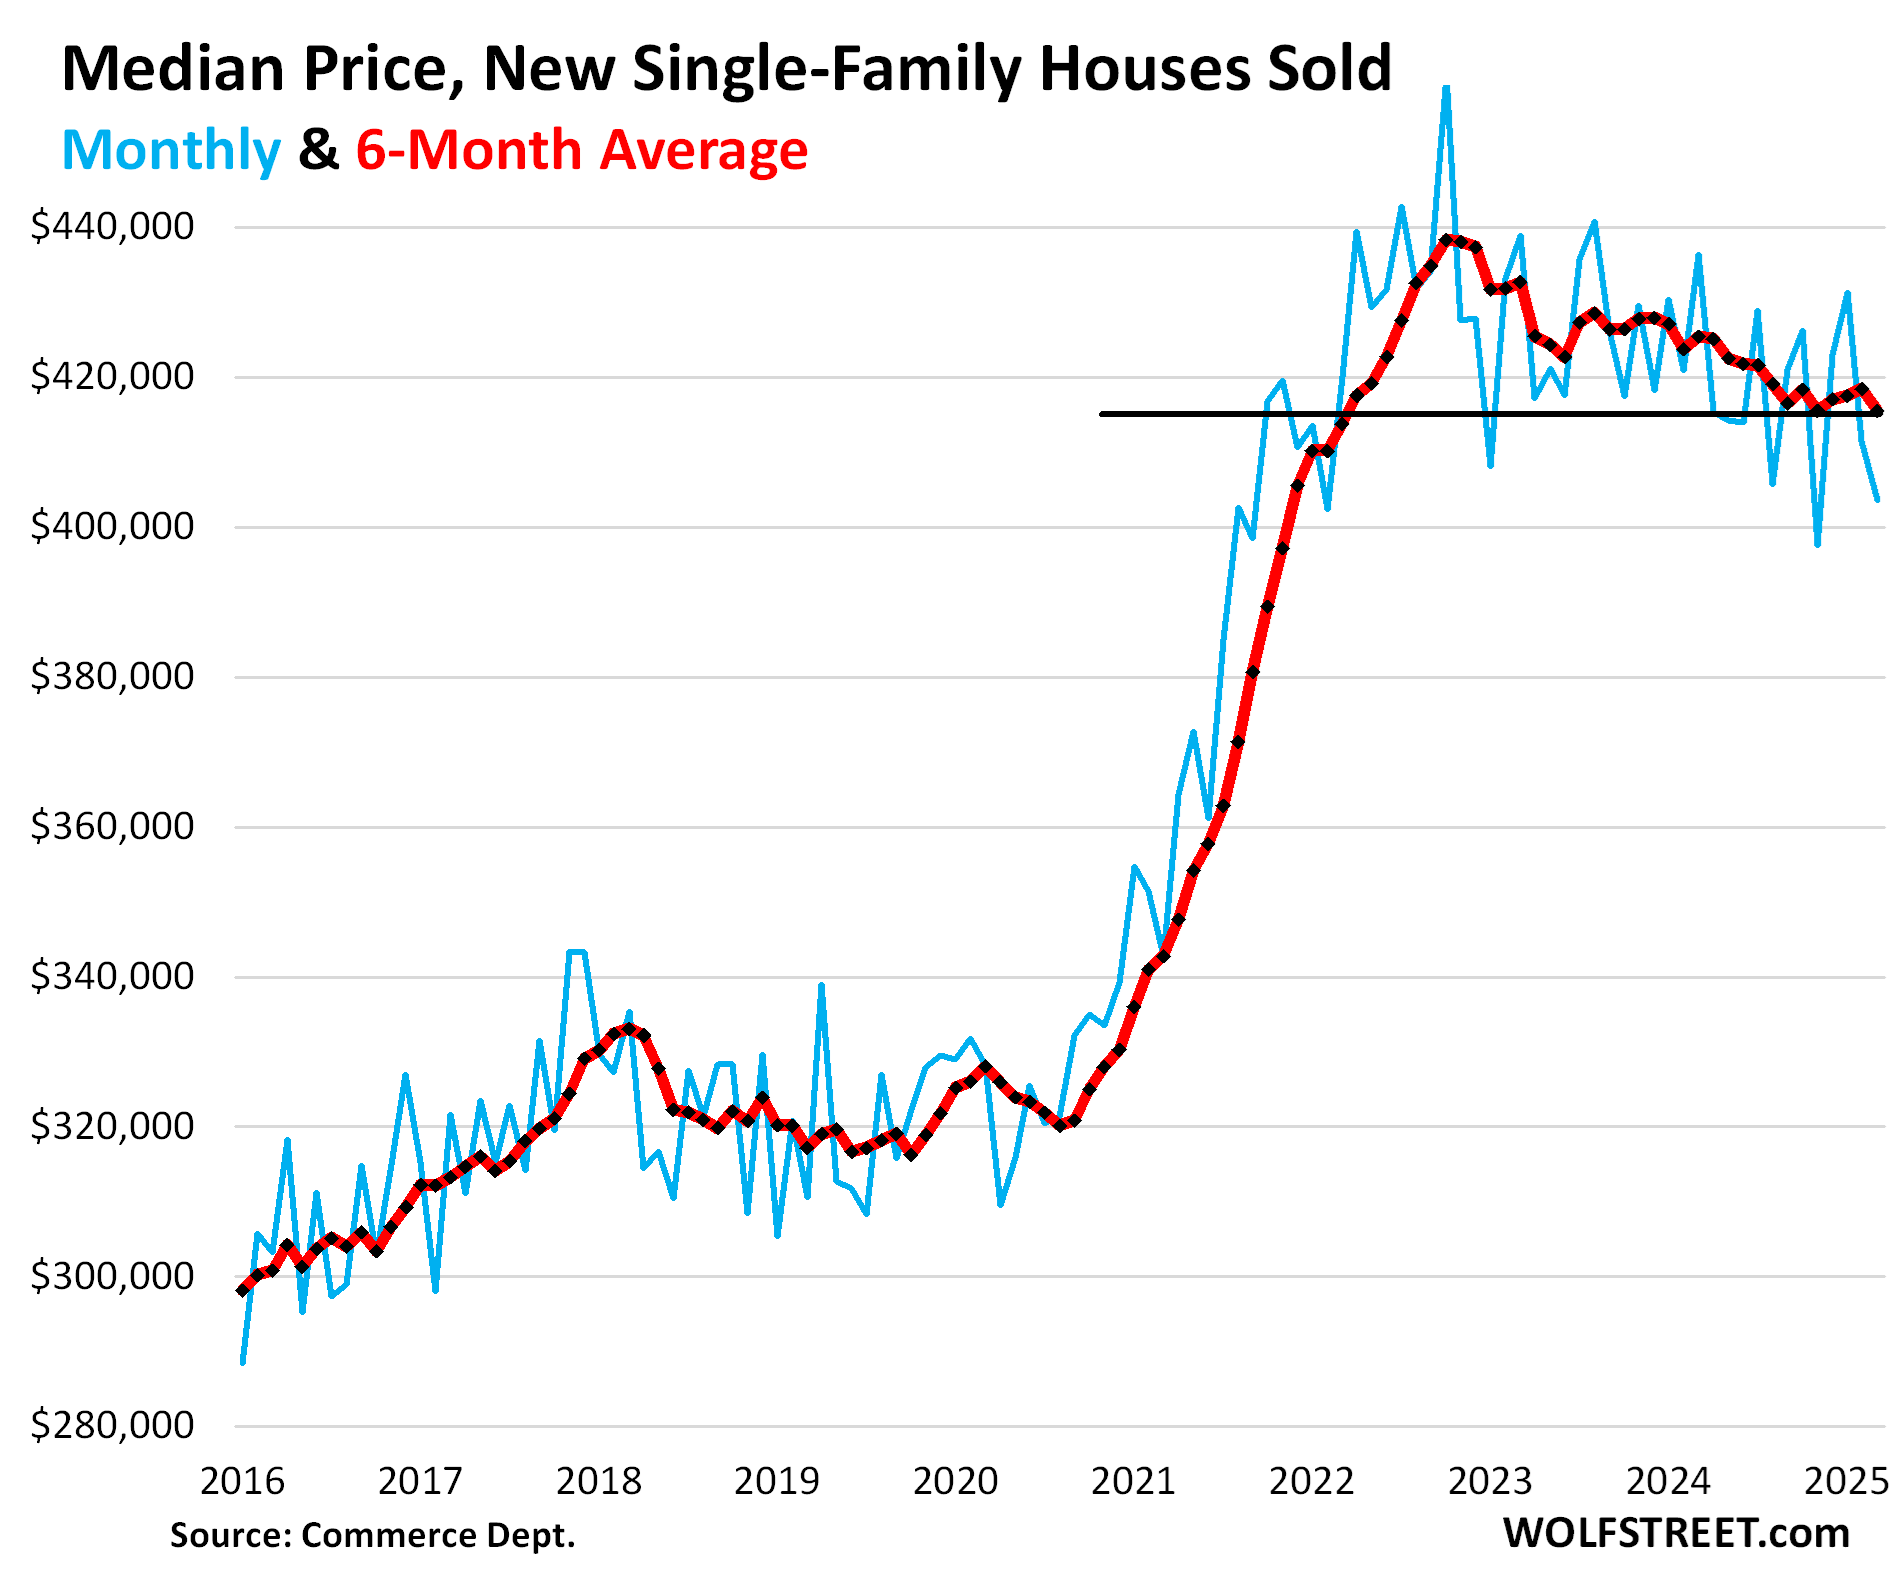
Overall prices continue to wobble lower.
The median contract price of new single-family houses at all stages of construction that sold in March fell to $403,600, down by 7.5% year-over-year, down by 8.0% from two years ago, and down by 12% from the peak in October 2022, according to the Census Bureau today (blue).
The six-month average, which irons out the random monthly ups and downs and includes the revisions, fell to $415,567, the lowest since March 2022 (red).
But these contract prices do not include the costs of the mortgage-rate buydowns and certain incentives, such as free upgrades. On the builders financial statement, some incentives show up in the price of the home sold, the remained, such as mortgage rate buydowns, is taken against its gross margin
Lennar’s breakout of incentives (see table above) sums the total costs of all incentives, including mortgage-rate buydowns that are not part of the contract prices reflected here.
Inventory for sale by region.
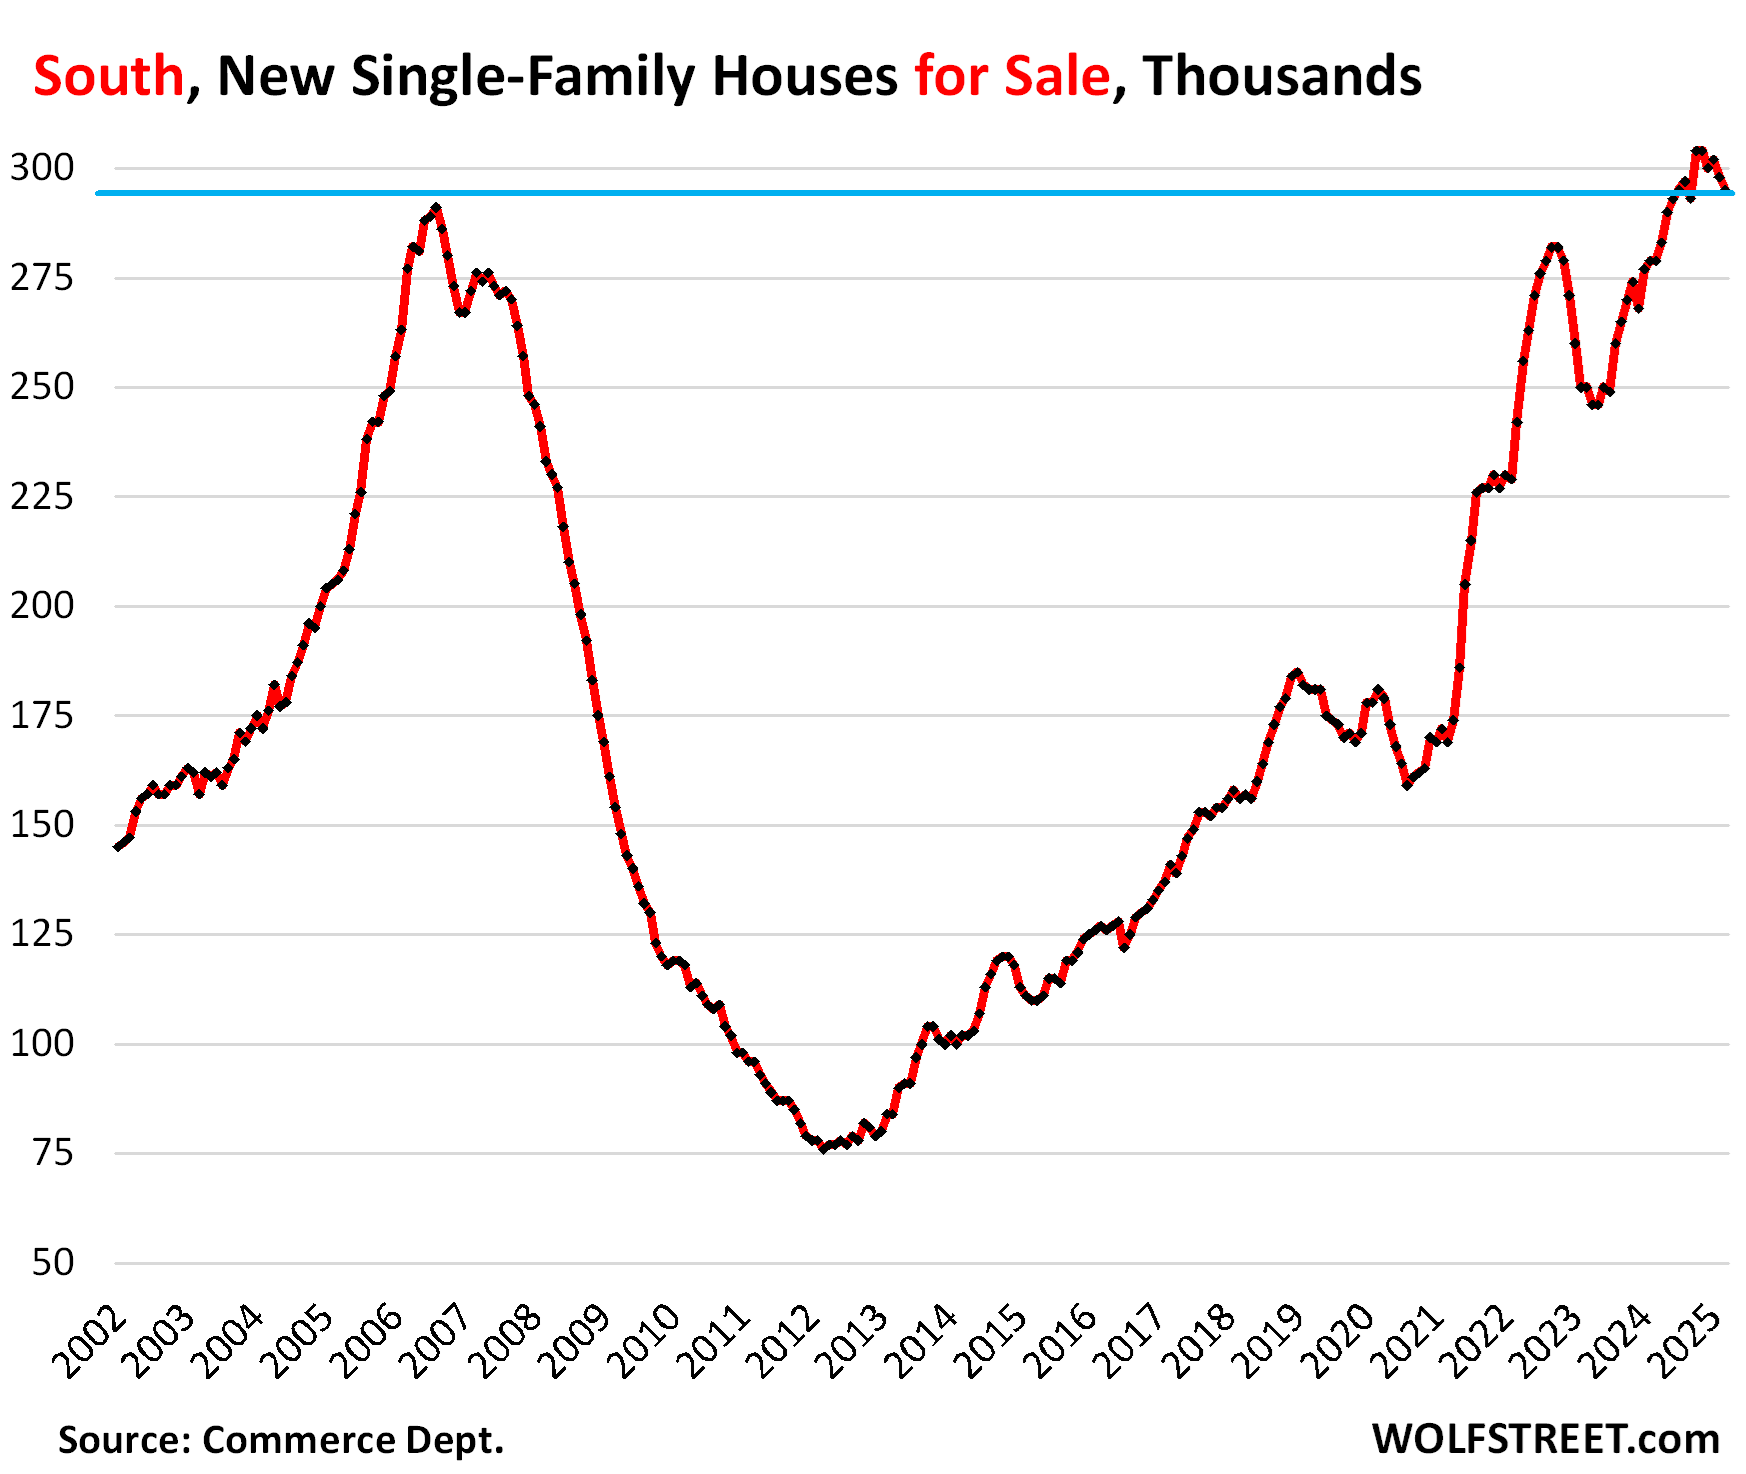
In the South, inventories of new houses for sale at all stages of construction dipped to 295,000, still above the peak levels during the Housing Bust, up by 5.7% from the bloated levels a year ago, and by 63% from March 2019!
Inventory for sale has been above the Housing Bust peak since May 2024.
The huge Census region, dominated by Texas and Florida, is by far the largest market for new houses in the US, accounting for 60% of US inventory, and for 67% of US sales (a map of the four Census regions is below the article at the top of the comments).
Large incentives and lower prices by homebuilders stimulated sales, which jumped by 21% year-over-year and also by 21% compared to March 2019. Supply declined to 6.4 months, but was still 35% higher than in March 2019.
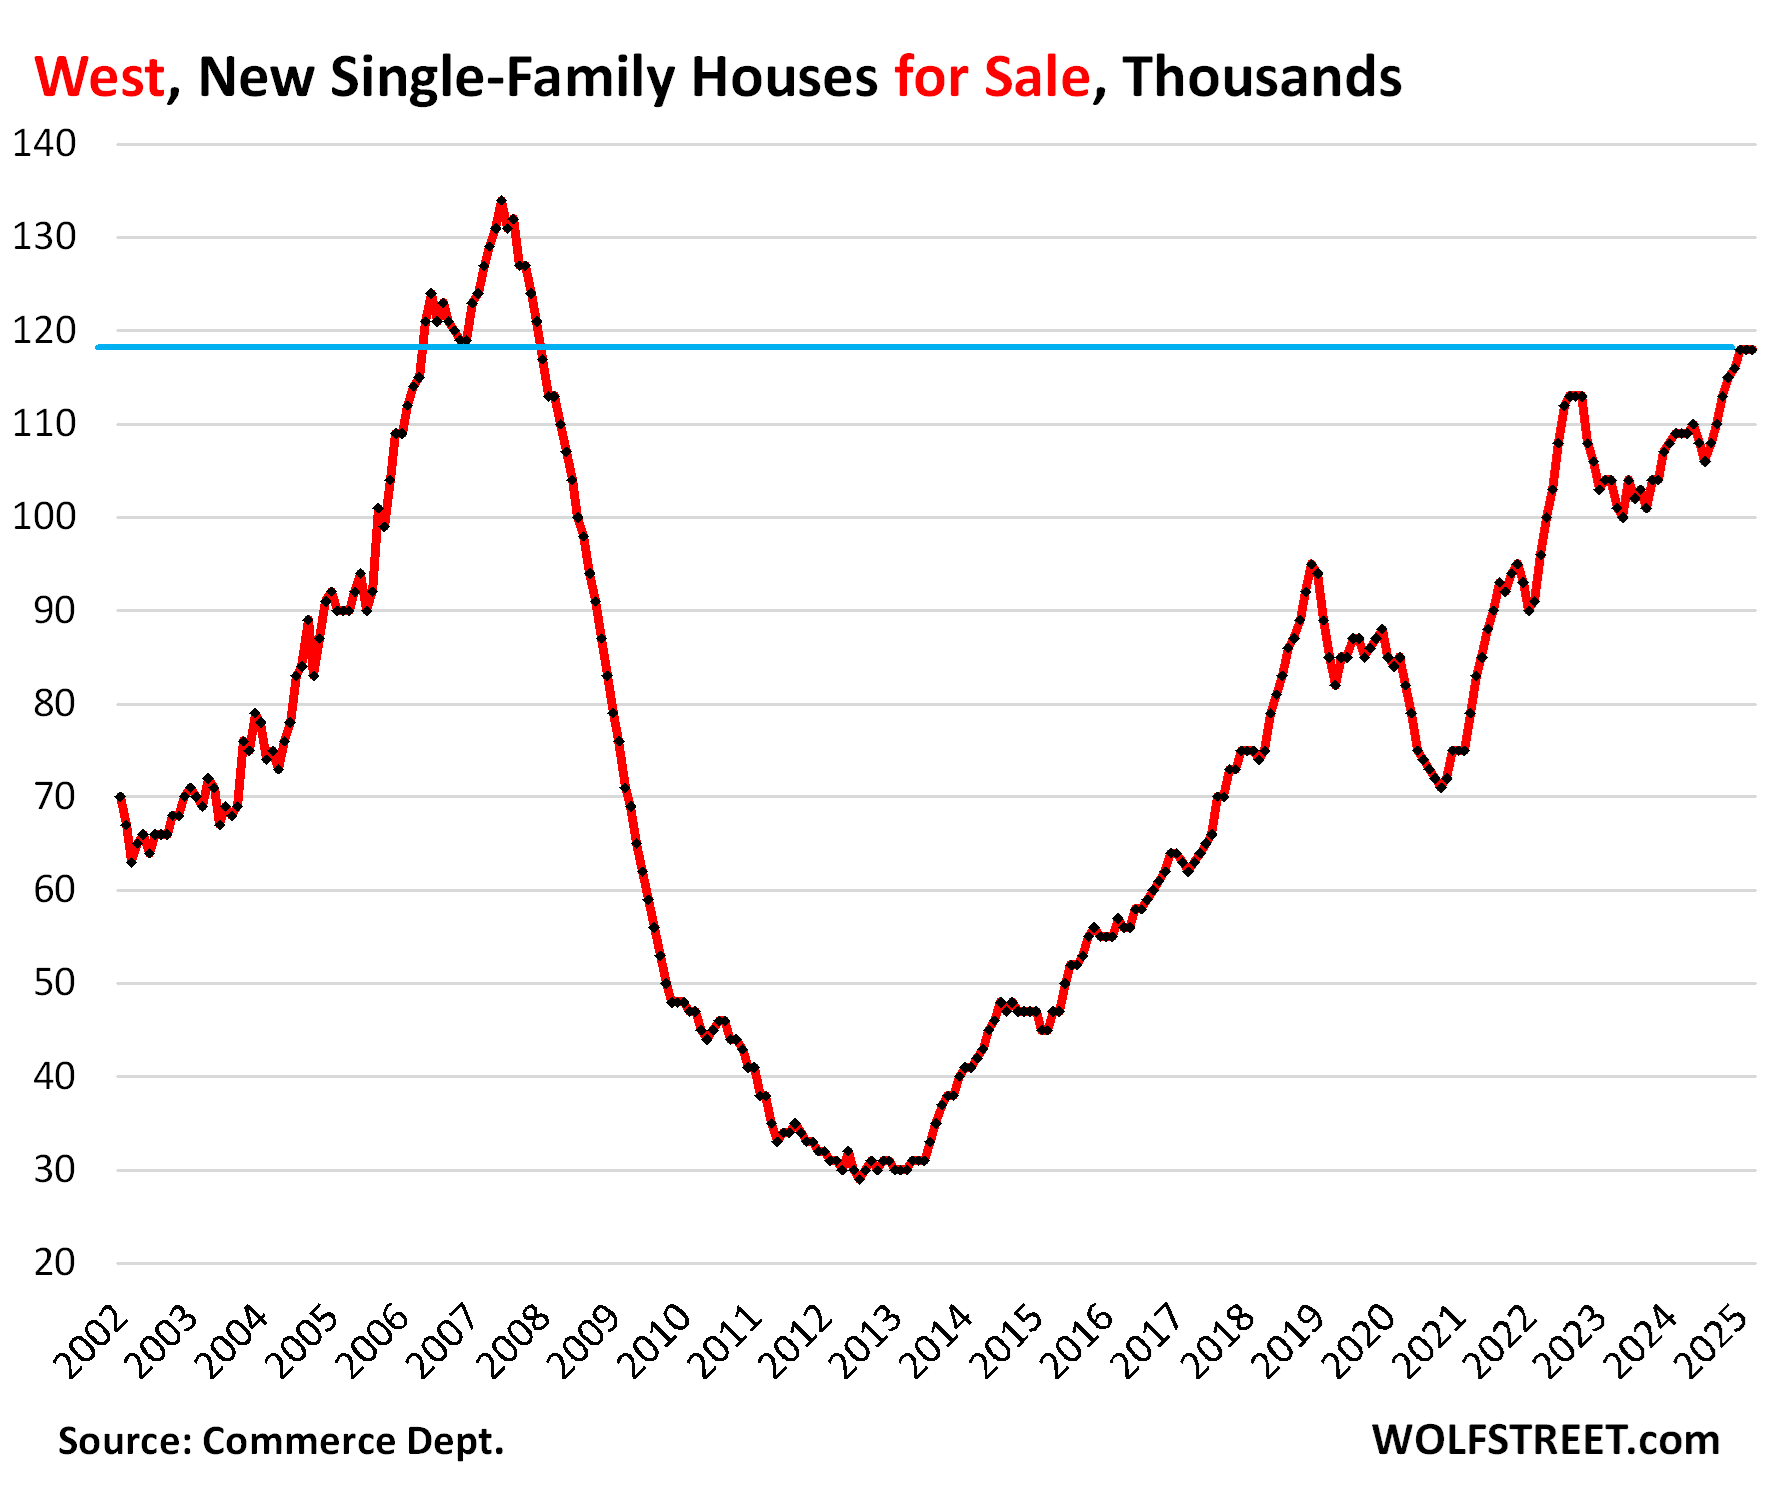
In the West, inventories of new houses for sale at all stages of construction remained at 118,000 for the third month in a row, up by 8% year-over-year, up by 39% from March 2019, and where they’d been in December 2006 as the Housing Bust was getting going.
The West accounted for 24% of the US inventory and for 19% of US sales in March.
Sales in the West fell by 13% from the already depressed levels a year ago, and by 35% from March 2019.
Supply remained at 9.1 months, up by 25% from a year ago, and more than double (+114%) where it had been in March 2019! Clearly, the price cutting needs to get serious to simulate sales and work down this inventory:
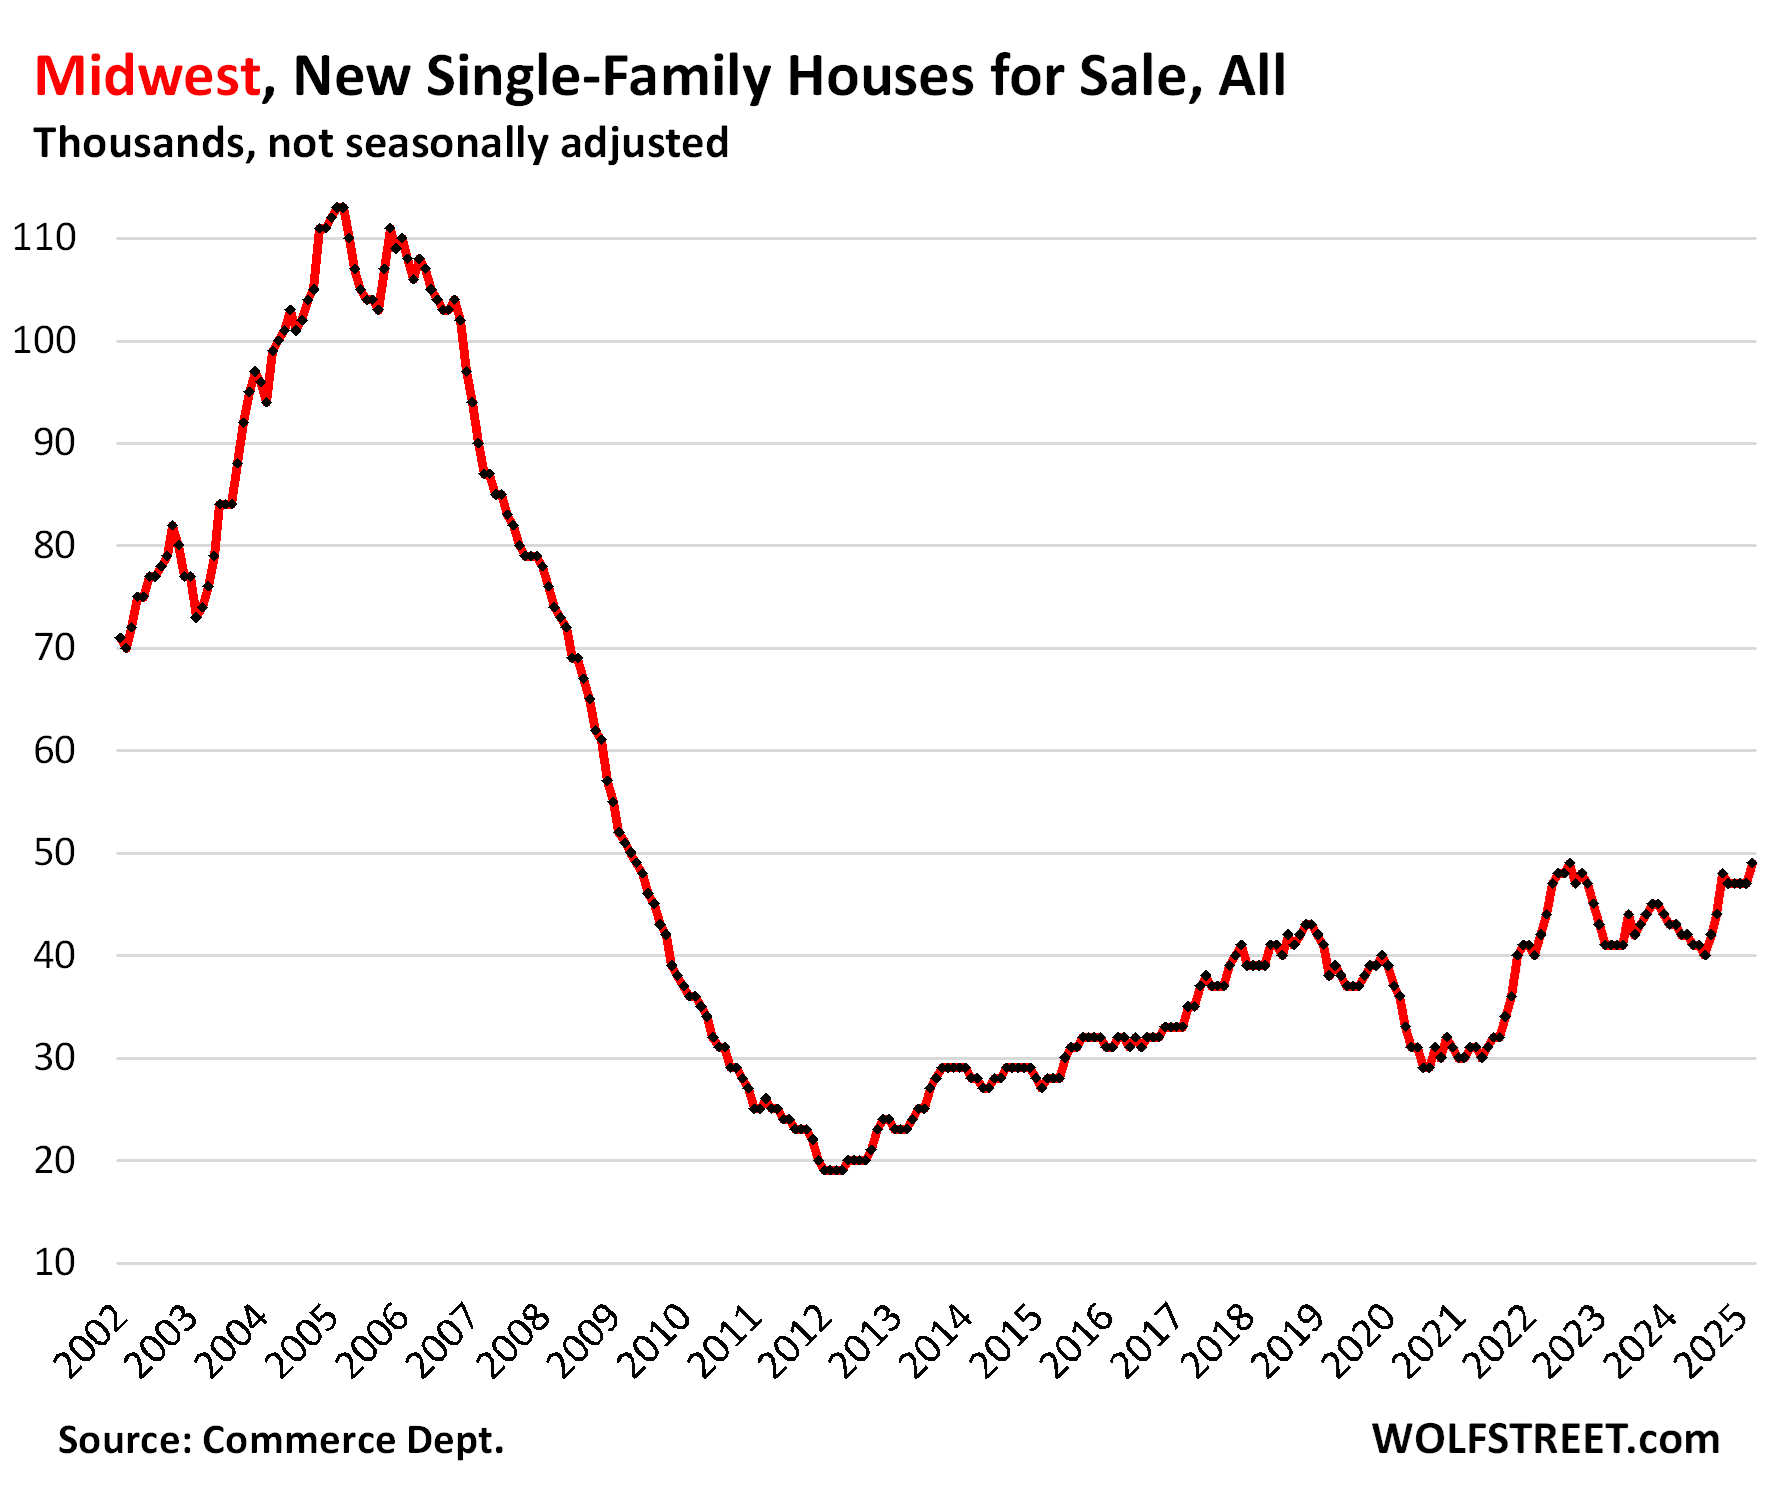
In the Midwest, inventory rose to 49,000 new houses for sale, up by 17% year-over-year and up by 29% from March 2019.
Sales, at about 7,000 houses, were down about 12% from a year ago and from 2019. Supply dipped to 7 months.
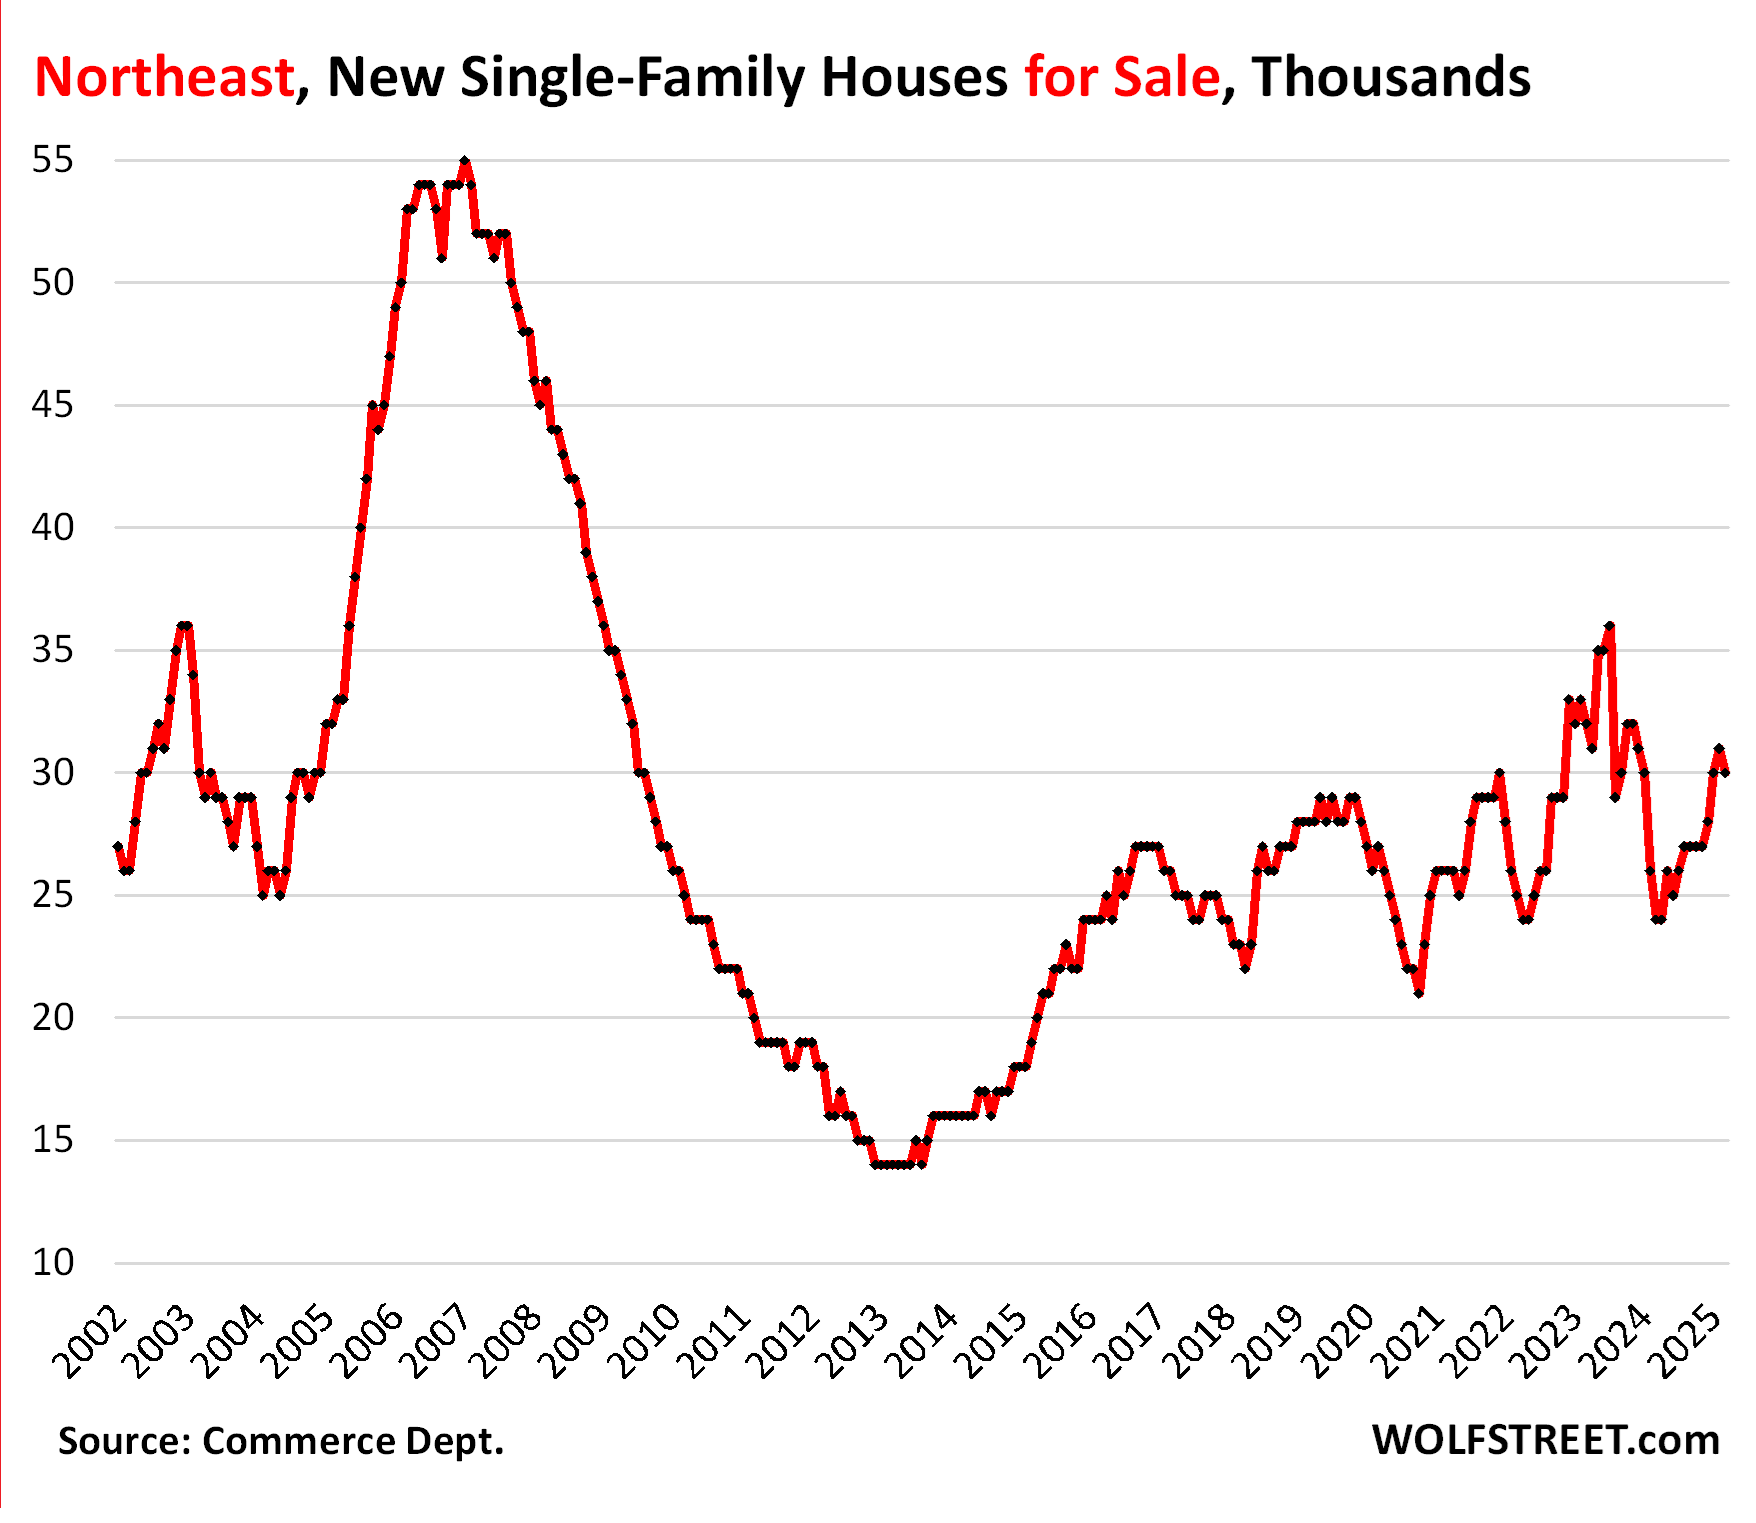
In the Northeast, inventory rose to 31,000 new houses for sale, up by 19% year-over-year and up by 11% from February 2019.
Sales of about 2,000 houses in February were down from a year ago, likely the bad weather. Supply remained at about 8 months.
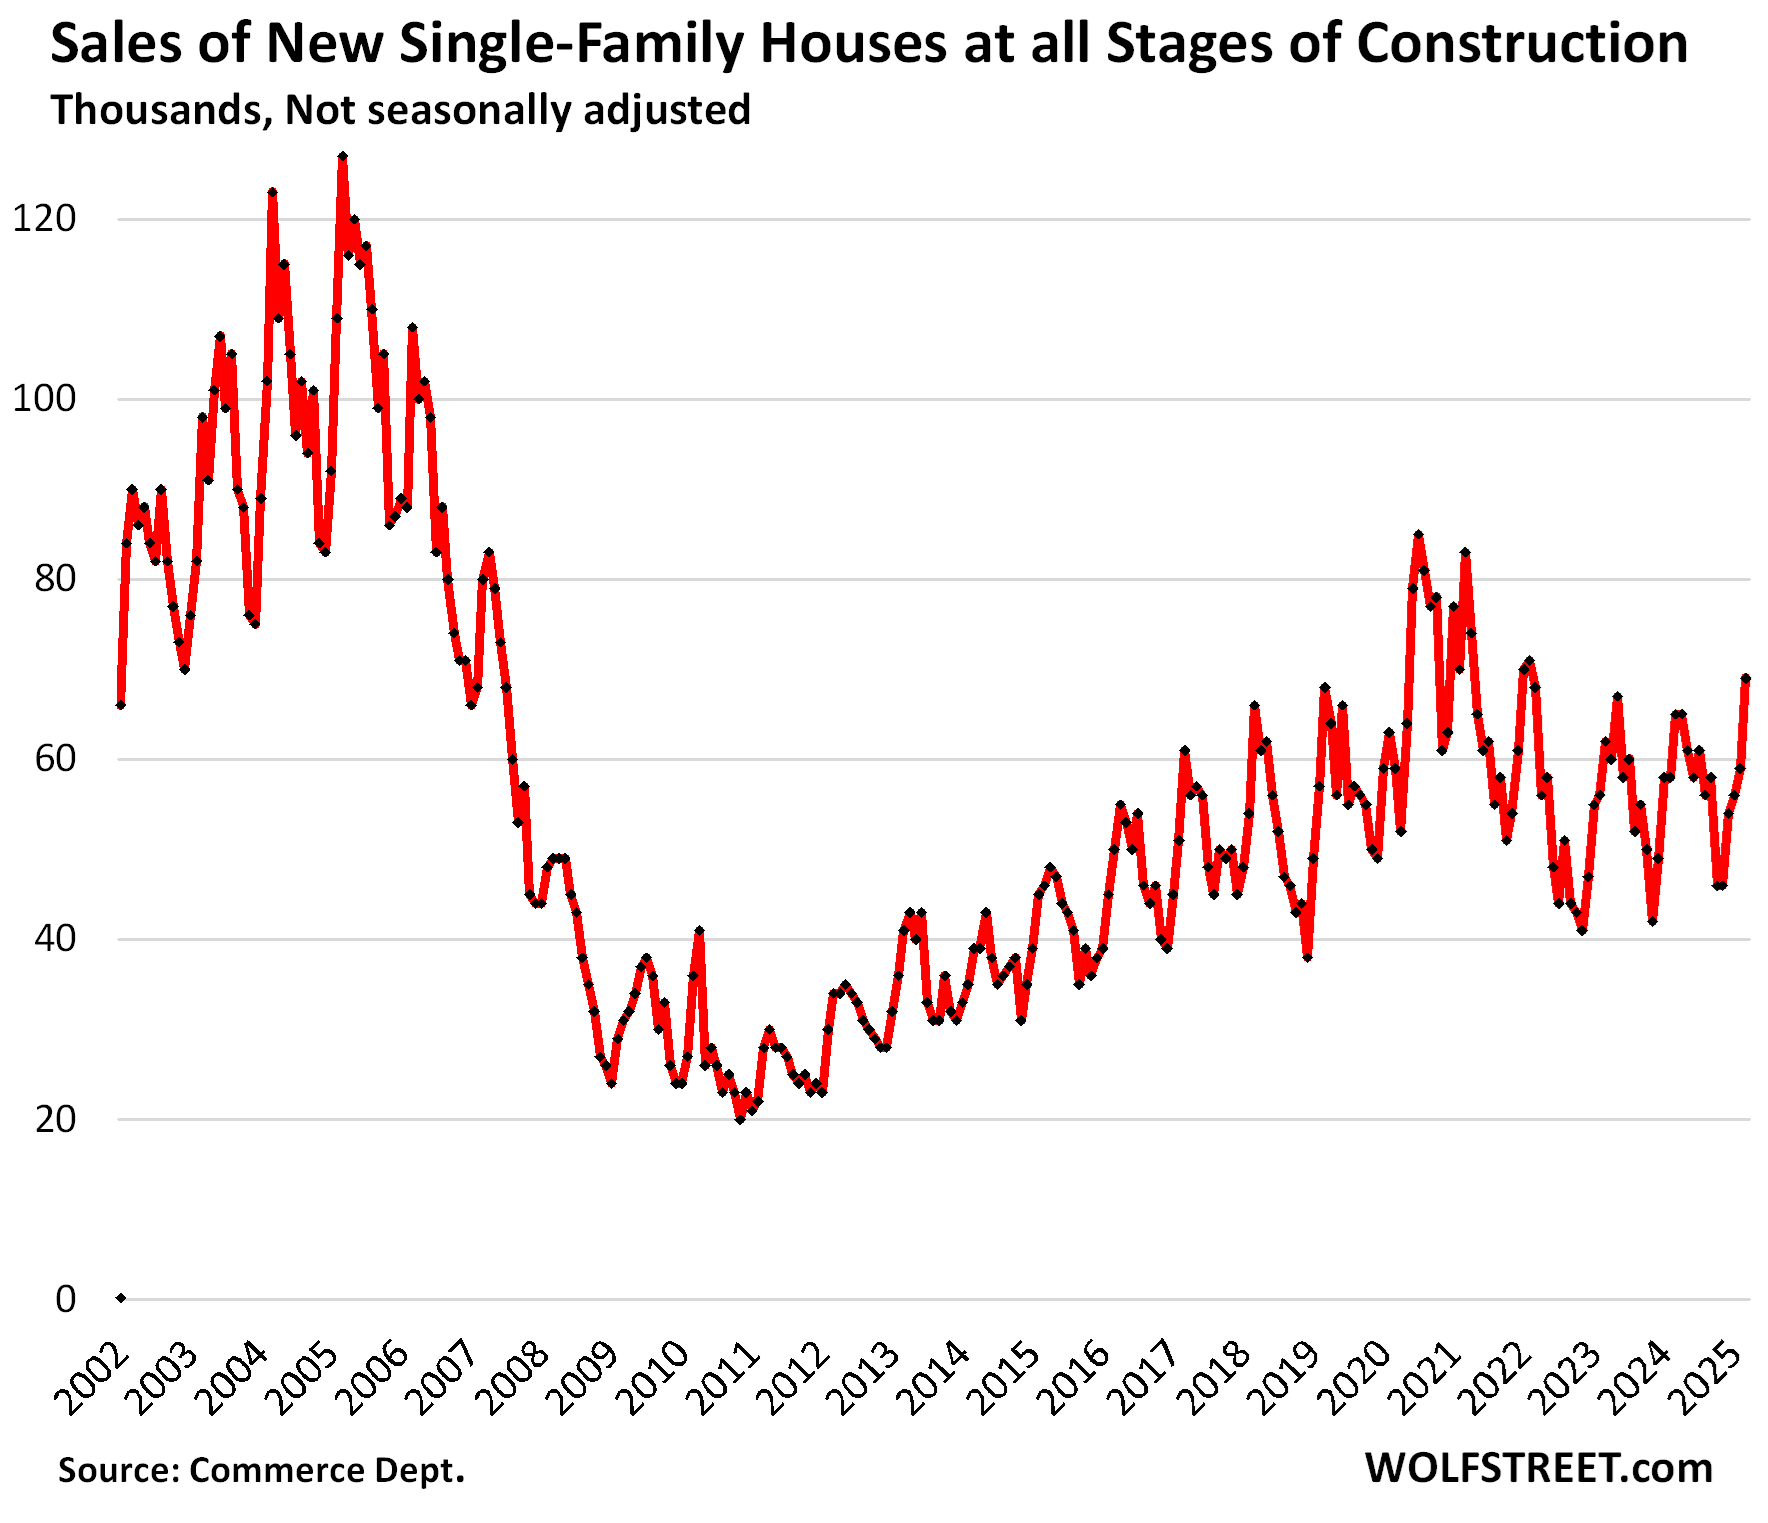
Sales overall rose to decent levels.
Sales of new houses at all stages of construction rose by 6.2% year-over-year, to 69,000 signed contracts, not seasonally adjusted, the best March since 2021. The sales increase in the South (see above) overpowered the sales decline in the West. Compared to March 2019, sales were up by 17%.
Supply dipped to 7.1 months at the strong March pace of sales, down from 7.6 months a year ago.
Overall, the builder strategy of cutting prices and throwing incentives at the market, such as mortgage rate buydowns, has been working, compared to existing homes sales that have remained at collapsed levels for over two years.
Enjoy reading WOLF STREET and want to support it? You can donate. I appreciate it immensely. Click on the mug to find out how:

![]()
The promised map of the four Census regions of the US:
It’s going to take a while to bounce back
Nice work wolf, is there a way to adjust the charts by households? There are a lot more households now than in 2006-2008 so maybe the housing glut is a bit overestimated, but it is definitely there.
I also wonder about the comparison to 2008. 2008 it was just build build build build. Now we are building but the demand has dropped because prices and mortgage rates are insane.
Something has to break, but I don’t think the break will be that bad. As you have pointed out, sellers will still make money or at least break even.
“Sellers will still make money” as long as they didn’t do a cash-out refinance to keep the pandemic spending spree going.
eric,
“…is there a way to adjust the charts by households?”
The number of households is irrelevant. Not many households will ever buy a new house. Most will buy an existing house, or a condo, and many rent. So forget households. It’s a nonsense comparison. I don’t know why this keeps coming up. I sound like a broken record. Is someone circulating some BS out there about it?
What matters is DEMAND = sales. And this is a big part of the article. See the sales figures, and see the “supply” figures which express inventory in relationship to sales, such as 7.1 months supply at March sales pace for the US overall, 6.4 months in the South, and 9.1 months in the West.
Ahhh thank you!
make money in real terms or in nominal terms?
I don’t think they’ll be a big foreclosure crisis is what I mean
So what exactly do you think is going to happen to the 1 million FHA loans in serious default?
Let’s not talk about any other type of loan, just FHA that is the biggest government fraud ongoing right now with many people now just walking away from their mortgage payment.
Do you think these homeowners, some of which have not made a payment in 4+ years under the last president, are just going to get a free ride for the next 20 years without ever paying a single payment? And they are just going to get repeat loan forbearance and modification until the day they die?
The can kicking has been going on since the GFC. The rug pull is coming. Its a matter of when, not if.
Same BS over and over again (you saw it on YouTube, right?). You people have to understand that when property prices shoot up 50% in three years – most of these mortgages are pre-pandemic mortgages – and if there is a default, the homeowner can sell the home, pay off the mortgage, pay off the arrearage, pay the fees, and walk away with plenty of cash for down payment on another home. If they do that, there is zero impact on the housing market: add one unit, take one unit off (+1 -1 = 0). During forbearance or mortgage modification, they tack on the missed mortgage payments to the end of the mortgage, and when the borrower sells the home at current price, the above happens. That’s why there is no push to foreclose on these owners. They’re still in the money with their homes despite the arrearages. Home prices will have to plunge a whole lot to cause problems with this.
What wolf said lol
If new home is in la la land with their high price and growing inventory…the used home market is in next level la la fantasy land, especially seeing how sellers don’t have special incentives like home builders can throw in. Case in point below, had a good chuckle at some of the used home prices in SoCal from Redfin email blast….they are all hanging onto those 2022 prices with kung fu deathgrip..
$1,465,000
4 Beds · 3 Baths · 2,111 Sq. Ft.
Long Beach, CA 90815
$1,675,000
3 Beds · 2.5 Baths · 1,745 Sq. Ft.
Long Beach, CA 90804
$824,888
2 Beds · 3 Baths · 1,026 Sq. Ft.
Long Beach, CA 90804
$1,198,000
4 Beds · 2 Baths · 1,945 Sq. Ft.
Placentia, CA 92870
The sad part (for the obstinate owners) is that when this thing blows over, those houses will be selling for less than half of those prices. Less than half! Kung Fu death grip. 😁 🥋
I’ll take the other side of that bet. You need a crisis of forced sales and major build up of months supply to get prices to drop even modestly. I don’t see how nominal home prices decline 50% while the US continues to run 2 trillion dollar a year deficits, which more or less eliminates the possibility of fully curbing inflation in the near term. The thing that blows my mind is how out of wack home prices are relative to renting the equivalent dwelling in the SF Bay Area. Yet still, buyers are lined up locally to incur 3x the carrying cost to buy something instead of rent it.
High margins for home builders for sure . Some room to drop prices but not a lot . 10 year Rates today opened down 15 basis points but ended the day down 2 basis points Rates sure appear like they are headed higher which will be headwind for housing stocks. The rise in new home inventory looks like the price increases from 2020 until 2022 one would think QE was back instead of QT
Home builders have been thriving for a long time on the North American continent with the explosion in the population. There was a time when there was only 3 million people in the American colonies, hard as this is to believe. Since then, the doubling and redoubling of population has meant a need for new accommodations. Plus older homes have been gradually phased out. For the foreseeable future, home building will be a fine area to be in, and many young men should think about going in the trades.
I like the timeline years going backward to last peak, as in, “since Lehman”.
Current Fred housing supply nationally
892,000
We have added 60,000 homes to the market so far in 2025 during the first 3 months of the year when national housing supply is supposed to be going DOWN this time of year, not up.
I predict that we are going to be close to 2016 housing inventory levels by early next year, upwards of 1.4 million homes for sale.
That wont include any of the homes that people bought illegally with FHA that were actually 2nd homes and vacation homes and not owner occupied. When the new home owners insurance premiums come into full swing with massive year over year price increases, massive default will continue to follow.
I predict that by early 2026, the Fred housing supply will be very close to 2016 levels. And if a recession hits this year, it will blow past 2016 levels.
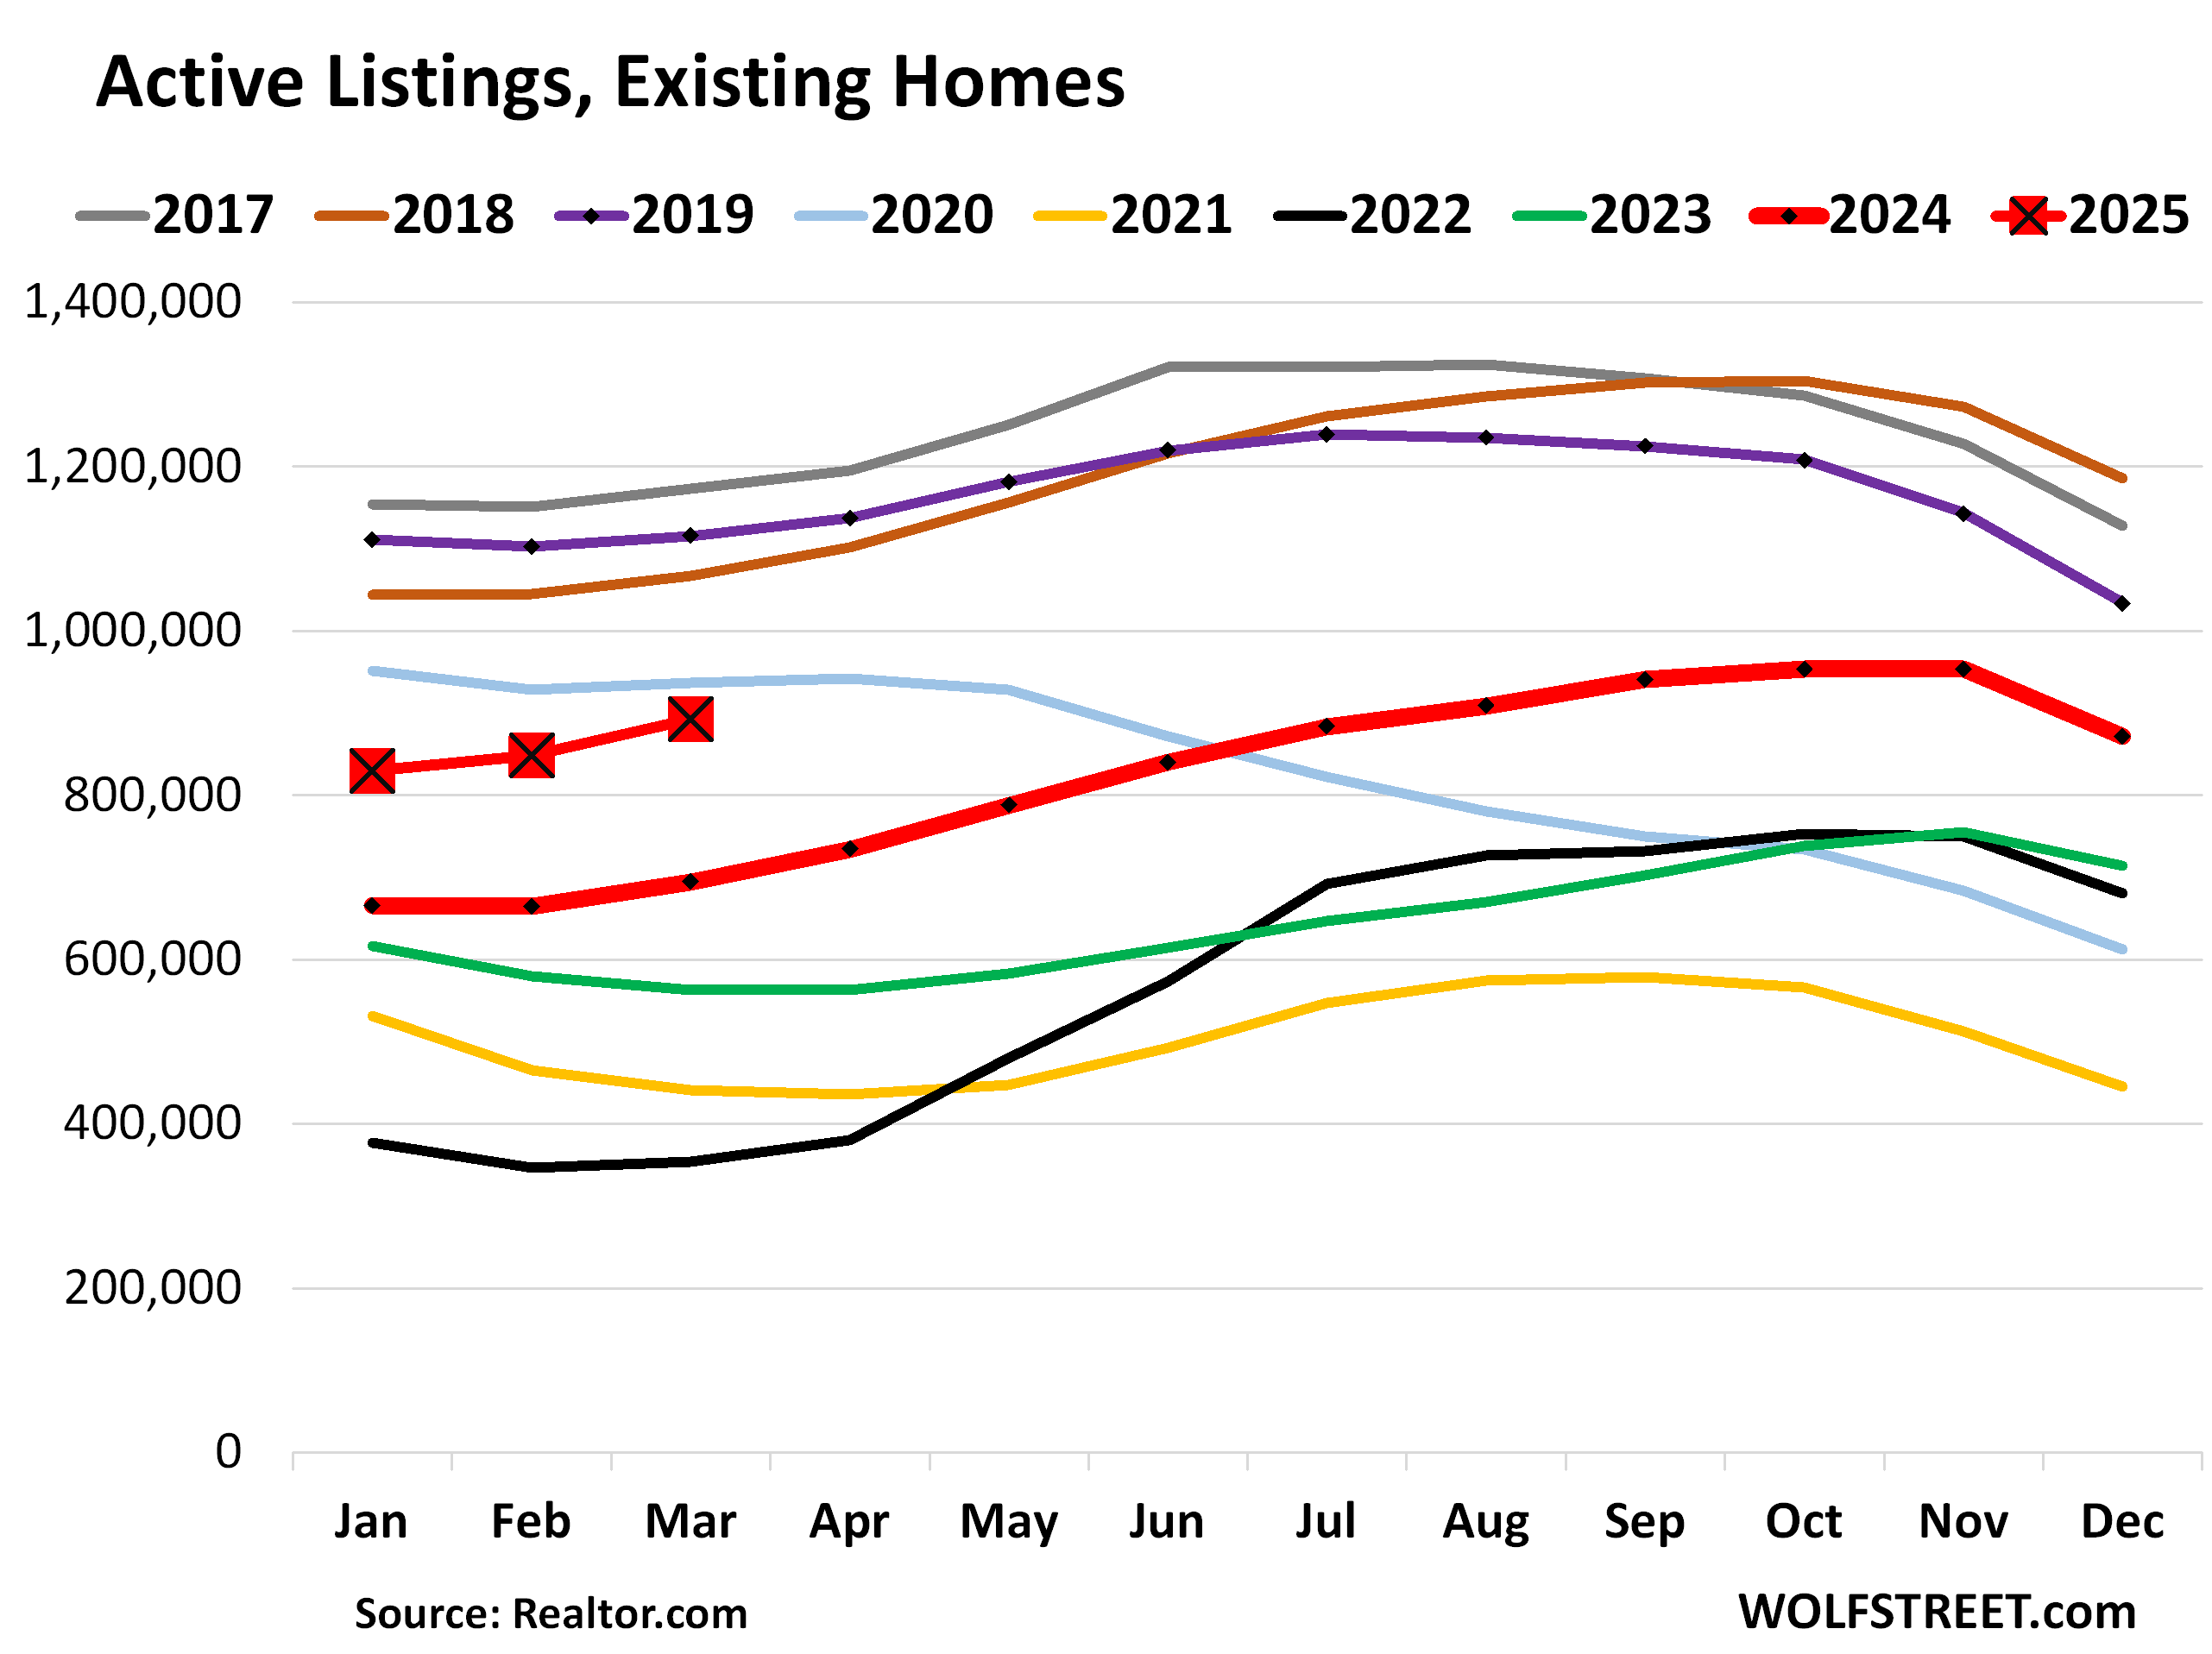
That figure you cited, 892,000, is “active listings” of existing homes, which are NOT NEW homes. The article here is about NEW homes.
The data is from Realtor.com, FRED just aggregates data, it doesn’t have its own data. The FRED charts indicate where the data is from.
1. “We have added 60,000 homes to the market so far in 2025 during the first 3 months of the year when national housing supply is supposed to be going DOWN”
So in terms of actives listings, they normally rise this time of the year, as you can see in the stacked chart (a couple of pandemic years were the exception).
But yes, active listings are rising faster than before the pandemic. The problem is that sales of existing homes have plunged, and there is not the kind of demand that there was in 2019 and before. The reason why demand has plunged is because prices are too high. If sellers get tired of hanging on to their property, they can just cut the price enough, and it will sell. But that’s not happening yet on a grand scale.
The gluts of active listings are in specific markets, such as in Texas and Florida, where inventories have reached the highest in the data from Realtor.com going back to 2016.
Seems it might be a bit of a financial shell game. What I mean by that is companies like DR Horton and Lennar own not only the construction company but also the property, undeveloped lots, and customer financing as a lender. So my question is are they playing a shell game of heavy losses in the lending entity while the other parts of the business (e.g. sales reported to Wall Street). If the lending entity actually fails, what is the real fall out other than the shell game comes to halt? Otherwise, why are they simply not slowing down the pipeline? Why continue to build homes at potential losses?