Fed’s Wait-and-See on rate cuts makes sense amid heavily revised whiplashy data and still too high inflation.
By Wolf Richter for WOLF STREET.
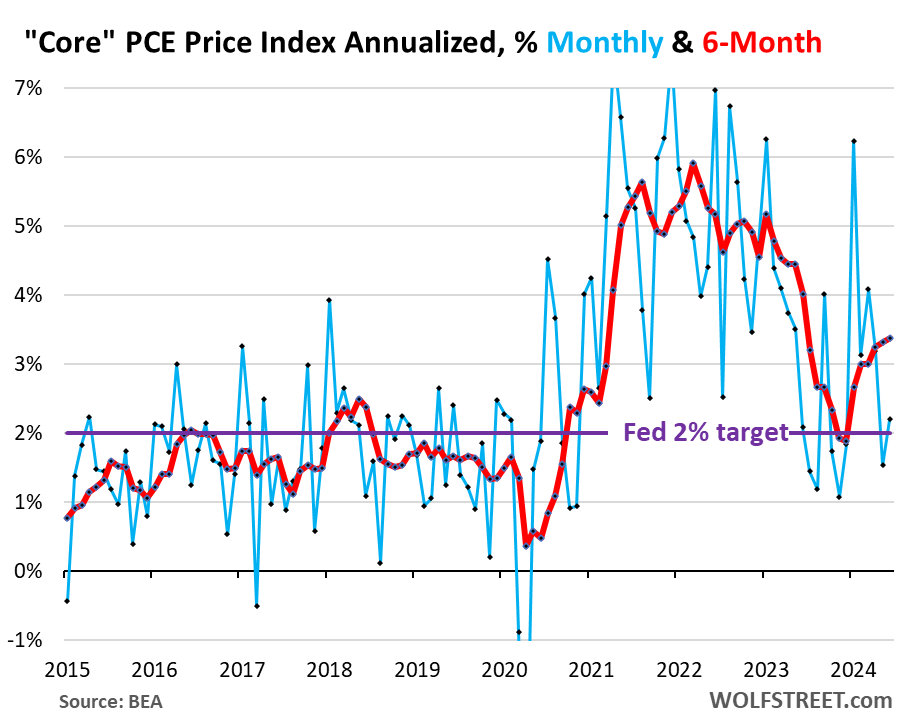
The revisions, the upward revisions, oh-la-la! The Bureau of Economic Analysis released today the PCE price index for June; and as part of it, the “core” PCE price index – the Fed’s primary yardstick for inflation – was revised substantially higher for May, driven by a large upward revision of the “core services” PCE price index. So the much-hailed month-to-month core PCE reading a month ago of +1.0% annualized (+0.08% not annualized) was revised up to +1.5% annualized (+0.13% not annualized).
Then in June, core PCE accelerated further from that upwardly revised pace, to 2.2% annualized (0.18% not annualized). Part of the hotter than expected month-to-month reading for June was the index for durable goods, which was 0% in June, after the “freak plunge,” as we called it, of 9.1% in May, the biggest month-to-month drop since 2001.
The six-month annualized core PCE price index, which irons out most of the squiggles and includes all the revisions, and which Powell cites a lot, accelerated to 3.4%, the worst since June 2023 (red). The Fed’s target is 2% (for your amusement, here is the unrevised chart through May from our report a month ago):
“Core PCE” v. “Core CPI.” Something interesting has happened – a fairly rare occurrence: The six-month Core PCE price index here, rising by 3.4% for June, is now higher than the six-month Core CPI for June, which had decelerated for the second month in a row, and in June rose by 3.3%. Normally, the core CPI is significantly higher than the core PCE price index. But not right now.
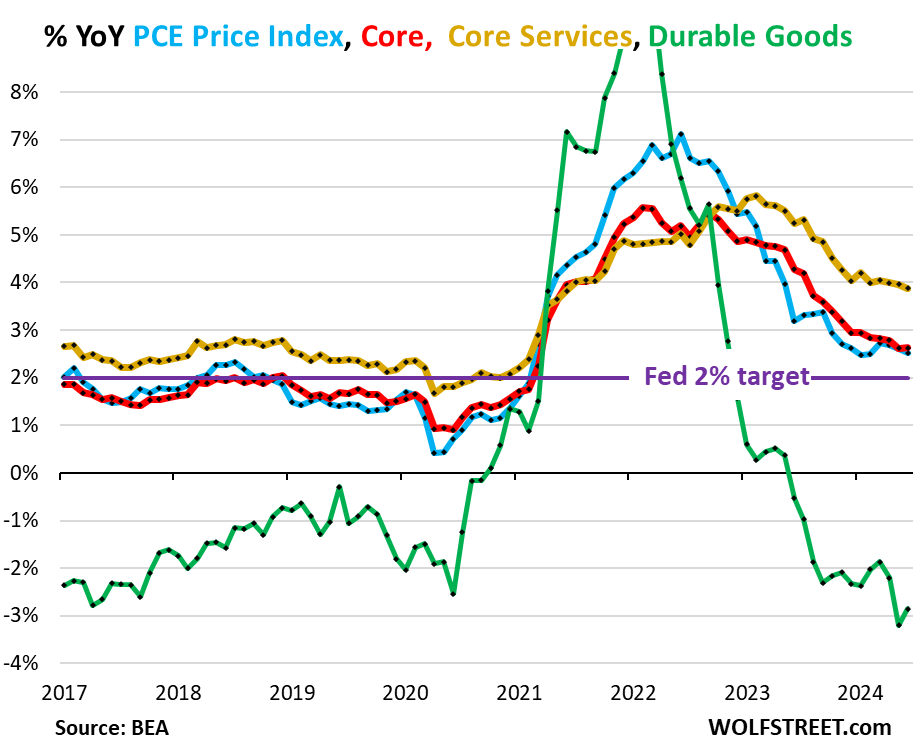
In summary, year-over-year:
Overall PCE price index, which includes food and energy, rose by 2.5% in June from a year ago, a deceleration from May (+2.6%), but the same as in January and February. It has essentially been stuck in this 2.5% to 2.6% range all year (blue in the chart below).
Gasoline and other energy products fell further in June from May, and were nearly flat year-over-year; and food prices were essentially flat for the past four months, and up 1.4% year-over-year.
“Core” PCE price index, which excludes food and energy, rose by 2.6% in June year-over-year, same as in May (red). The Fed’s target for this metric is 2% (purple).
“Core services” PCE price index rose by 3.9% in June, same as the unrevised increase in May (+3.9%), but down a tad from the upwardly revised May increase (+4.0%), which was the same as April, March, and February (all +4.0%). The index has been in that 4.0% proximity since December (yellow).
Durable goods PCE price index fell by 2.9% year-over-year, a smaller drop than in May (-3.1%, which had been the biggest year-over-year drop since 2004 (green):
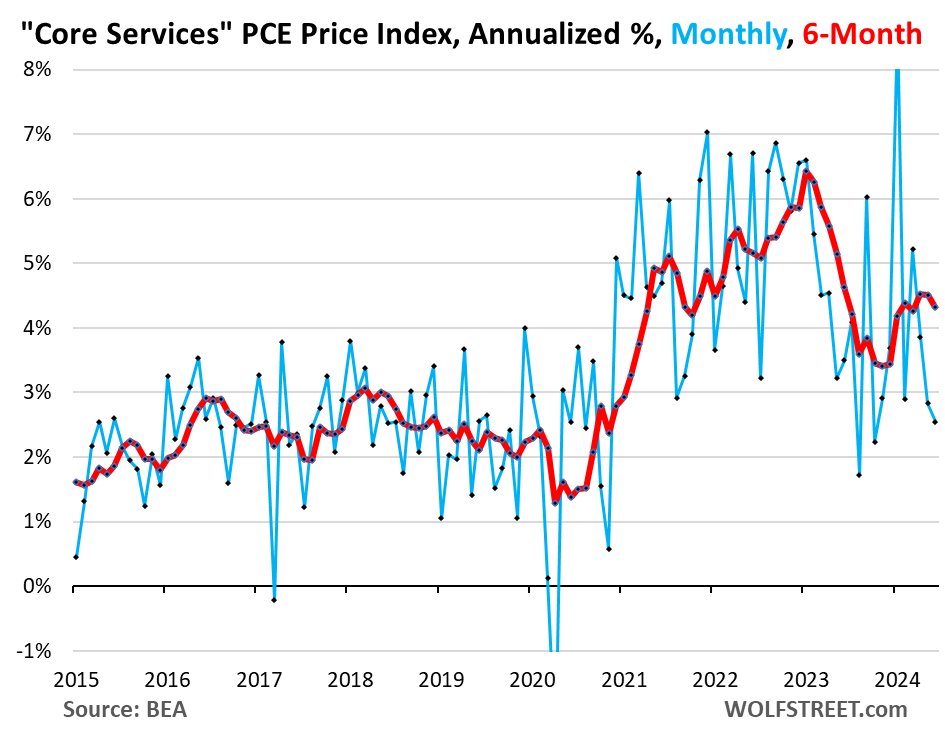
“Core Services” PCE price index is where the big revisions for May took place. In the data released a month ago, the index rose by 2.1% annualized in May from April. Today, the May increase was revised higher to +2.8%.
Then in June, the index increased by 2.5% annualized, according to today’s release. So that’s a deceleration from the revised May figure, but an acceleration from the original May figure.
This big upward revision in the month-to-month data caused the six-month core services index for May to be revised up to 4.5%, same as in April, up from the original 4.4%.
For June, the six-month core services PCE index rose by 4.3% annualized. It has been in the 4.3% to 4.5% range for the entire year so far – and up a full percentage point from the 3.4% range of the last three months of 2023 (red).
This inflation data rumbles along as the economy has solidly re-accelerated in Q2. Core services is where inflation has accelerated this year and it’s where the majority of consumer spending goes. It includes housing, healthcare, insurance, transportation services, communication services, entertainment, etc.
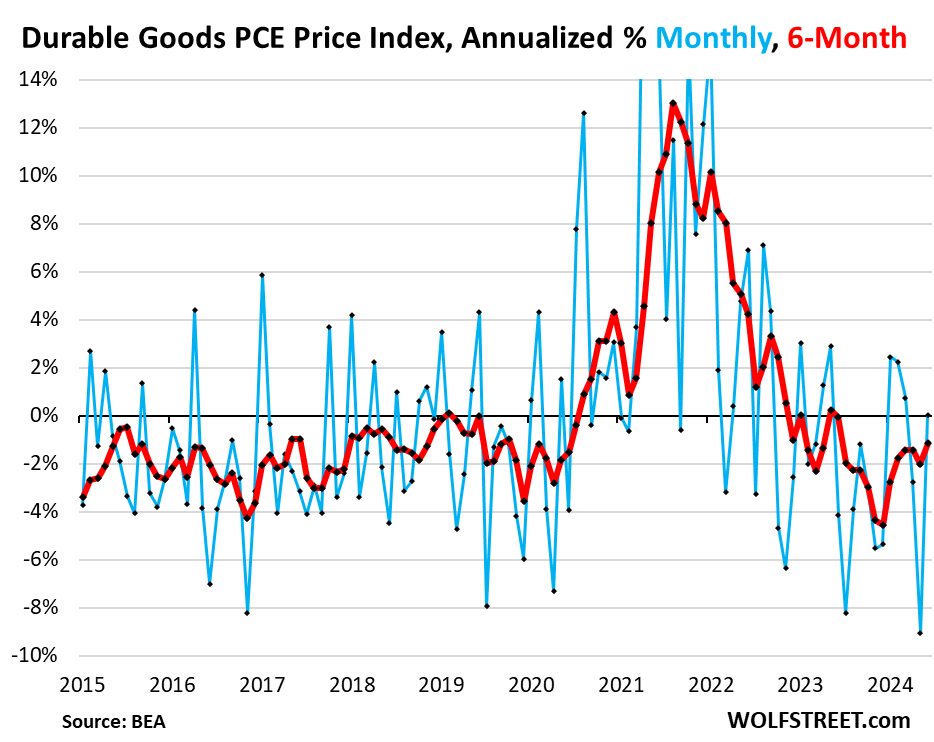
Durable goods PCE price index was unchanged in June from May, after the 9.1% annualized plunge in May from April, the biggest since 2001 (blue). Durable goods include motor vehicles, recreational goods and vehicles, appliances, electronics, furniture, etc.
The six-month index fell by 1.1% annualized, the smallest decline since June 2023 (red). The durable goods index tends to run in the slightly negative range during normal times amid manufacturing efficiencies and globalization.
Enjoy reading WOLF STREET and want to support it? You can donate. I appreciate it immensely. Click on the mug to find out how:

![]()
No rate cuts in 2024. Just hopeful talk of future cuts to keep markets from crashing, at least until after the election. Hopeful talk has been working since late 2023.
We will see at least 50 bps of cuts in 2024. More likely, however, is 100 bps as inflation will drop sharply below 2%. The markets are forward looking and correctly predicted there was no persistent 5%+ elevated inflation / stagflation in the cards. Just continue to watch the automotive market and its softening and the broadening of consumer weakness. Services inflation is the next shoe to drop as that upswing will also prove temporary.
The Fed is making a mistake holding so long. They were too slow to tighten, tightened too far and too long, and are too slow to cut.
“We will see at least 50 bps of cuts in 2024. More likely, however, is 100 bps..”
In 2024? Is that a typo? If not, 🤣❤️
Wolf, your comment won’t age well…
I am reading that the cut for September is pretty much cemented now.
And if the cement doesn’t set?
In December we were reading that “six cuts for 2024 are pretty much cemented now.”
Still waiting for the cement to set.
There is some strange cementing going on in here.
The Federal Reserve’s FOMC simply changed the subject by suggesting a large number of rate cuts at a time the public was discussing how high the rates needed to go to stop inflation. The conversation technique of changing the subject is common and predictable and highly effective for toxic individuals that want to control the narrative. Perhaps the Federal Reserve simply used these conversational techniques to regain control of the narrative for some underlying banking purpose.
I love your comments, “some strange cementing goin on heeha” they make me smile! Best around!
Wishful Cementing
The cement must harden into concrete. Then it is cemented.
Cemented or not, the big banks like Chase continue to cut the CD rates they offer to consumers. In early 2023 Chase was offering 5% for 12 months for $100k and up. Today they are offering 4.5% for 9 months. The shorter term means they anticipate cuts.
“The shorter term means they anticipate cuts.”
No, that’s not at all what it means. It’s a sign that they have enough cash and don’t need to pay a higher rate to get new cash or hold on to cash from their current depositors. Cash was leaving banks back then for money market funds and T-bills, and banks had to compete for deposits to hang on to their cash. Several banks collapsed because their customers yanked their cash out of them. If a bank has enough cash, it gets less aggressive in borrowing from depositors by offering lower rates.
That’s why some banks are offering only 1% and 2% CDs because they don’t need more cash. It doesn’t mean that they’re expecting the Fed to cut rates to 1% or 2% in September. Other banks are still offering over 5% because they need more cash.
What will be hilarious is that we see signs of re-accelerating inflation through August, the Fed cuts and then the trend keeps up through the end of the year.
I firmly believe we’re not at the beginning of a big uptick in unemployment. It’s moved up very slowly over the last 12 months as one would expect.
Until we start to see job losses in construction, the economy will remain in goldilocks growth phase that will keep core PCE inflation from moving down the last mile to 2%.
Just my two cents, but the attrition rate in construction is very high. I hear from contractors that hiring employees is pointless because most don’t last a year, and the only people that consistently show up are subcontractors. Most subs are specialty trade owner-operators that forgo the benefits of employment for higher pay.
The only way we’ll see job losses in construction is if demand cools off. Wolf, are there any metrics out there for how many new folks get into construction, and how many of them stay for 1 year, 5 years, 10 years, etc.?
There will be no rate cut at all in September and there may very well need to be a rate increase by the Federal Reserve in November as was made abundantly clear with the numbers today.
disagree with you. the market doesn’t react to the fed. the fed reacts to the market. since it doesn’t like surprising the market, once the market bakes something in and financial conditions are based on it, the fed feels it has to do what the market has priced in.
the market doesn’t reflect the reality, it creates the reality.
I disagree because this reasoning is contradicted by what’s happened for the past 8 months. As noted in a comment above, last December the “market” was pricing in six cuts in 2024. Why has the market failed to create its reality so far in 2024? Maybe the FED cuts in September, but I think it will be in reaction to inflation and labor market data, not any “reality” created by the market.
I also disagree. The futures market has a terrible track record of accurately predicting rate changes.
Remember when “don’t fight the Fed” was common knowledge?
Exactly, Franz. All anyone has to do is go look at a chart that shows both fed funds rates and 3 month t bill rates. The fed FOLLOWS, it doeant lead markets.
Short term market swings mentioned by Rojo and Short are just that, short term knee jerk reactions by traders to the latest news story. Look at trends not blips.
As for fighting the fed, its a really stupid thing to do because you’re also fighting the market, which is leading the fed.
CCCB and Franz,
“The Fed follows market” is dumb BS spread by people who don’t understand anything about the Fed, and I’m tired of this dumb BS getting spread here.
The Fed COMMUNICATES about rate cuts/hikes months IN ADVANCE, and there are rarely any surprises. In bits and pieces, the Fed outlines what it will do months ahead of time.
To communicate what it will do, the Fed uses:
— the “dot plot”
— Powell’s post-meeting press conference
— the FOMC statement
— the FOMC minutes
— speeches by Fed governors, etc.
The Fed has been talking about rate cuts for 8 months – using all of the aboce. That’s what markets react to. Markets FOLLOW what the Fed SAYS. But charts don’t tell you what the Fed says and when it says it. They only show you the EFFR after the hike/cut. That’s the fatal and very dumb fallacy in your theory.
But the Fed is vague in the early stages of policy changes, so markets usually get it wrong – like they got the six rate cuts in 2024 wrong. The Fed has now moved a rate cut back on the table, and markets followed what the Fed said, or what they think the Fed said. Yields have dropped because markets FOLLOWED what the Fed told them vaguely it might do.
IF the Fed cuts in September, it will say so fairly clearly in July meeting, and markets FOLLOW what the Fed says next week. And then the rate cut that the Fed essentially announced in July will be fully priced into short-term yields a month before the September meeting. The chart of the EFFR and yields will look like the Fed followed the markets, but the Fed announced its policy well in advance, and markets FOLLOWED what the Fed SAID.
In September 2021, the Fed started talking about rate hikes, and that talk intensified. In January 2022, it made clear that it would hike in March 2022. Everyone knew the plan, and markets FOLLOWED what the Fed said by fully pricing the rate hike into short-term yields a month before the actual hike. And then some idiots said that the Fed followed the markets, such BS, LOL!
I normally just delete this Fed-follows-the-markets BS because I’m tired of having to waste my time on it.
Indeed, Powell has explicitly stated that signaling future policy changes is part of how the Fed transmits monetary policy to the market.
Raises seem impossible unless inflation goes above 4%
It is very likely they cut in September… Nothing’s 💯 but what impact does that have anyways? We’ve seen what over 500 bips in one direction does to the economy. I highly doubt 25 in the other has any impact… All just a narrative
The mathematical impact is small, but a shift in narrative and tone from “steady” to “cutting” would have a huge effect on personal and institutional behavior.
*** HOT OFF THE PRESS ***
Annualized interest expense on US debt climbs to $1.09T for FY’24 Q2. Not much a jump from the previous quarter, but that’s not unexpected due to the national debt staying flat during the Q2. It’s only been the last six weeks or so that it’s starting rising again. As of COB Thursday, we are ONLY $2.5B away from $35T.
IMHO, the fed will simply have to start cutting rates this year, given the CBO has forecast recently that we’ll pile up another ~$700B before the end of Sept. The interest on the debt is really starting to get out of hand.
In addition, it was reported that last month, we brought in ~ $185B in PERSONAL income taxes (much larger than corporate taxes), but we spent $140B in interest on the debt during the same month. Ouch! 76% to be exact of what we took in from people like you and me was spent on that #1 cost that MUST be paid before anything like SS, Medicare, Defense, etc.
I keep reading that 2030 may be the year we being our debt crisis, when the bond vigilantes rise up and demand higher yield to give Uncle Sam their money. I wonder how far along BRICS will be in 6 years. We know the debt with $2T annual deficits will be approaching $45T.
So my view is that the Fed will be forced to cut interest rates before the end of year. Our checkbook can’t afford a 5.5% FFR. All they’ve got to do is pronounce 2.5% core PCE inflation as the NEW neutral rate.
Cheers!
GuessWhat,
Interest expense in a vacuum is nonsense. What you need to look at is interest expense (blue) in relation to tax receipts (red) because tax receipts spiked too. And tax receipts is what you need to pay the interest with.
https://wolfstreet.com/2024/06/01/spiking-interest-payments-on-the-ballooning-us-government-debt-v-tax-receipts-and-inflation-q1-update/
GW,
Last night I watched an interview with Jan Van Eck. He suggested the Fed is keeping rates high *in order to keep gov’t spending in check. *
The rationale is that most of the current debt burden is with the gov’t – corporate and individual debt burdens are relatively low right now (vs say 2007).
Holding at 5.5% affects the gov’t’s interest expense more than any other entity.
ShortTLT — increasing the interest rate is a funny way to reduce government spending, since an increased interest rate results in MORE interest income being issued as, wait for it, MORE government spending.
e.g. – the gov’t spending more on interest means it has less $$ to spend on other stuff.
Increasing the cost of borrowing usually reduces demand. That said, I can see the argument that high rates are stimulating *consumer* demand since Uncle Sam is now paying folks >5% on cash & cash equivalents. Lots of folks (including me) now have significant interest income courtesy of the Fed.
There’s two CPIs, two PPIs and one more PCE between now and Sept 17-18 when the September FOMC meets. Plus a two more JOLTS.
If inflation warms even just a BIT, or inflation stays at the current 2.6% level and the jobs market doesn’t crap the bed, then I have a hard time seeing a cut in September.
“I highly doubt 25 in the other has any impact…”
Then why bother cutting at all?
The Fed will cut rates in September 2024 and will probably cut another 100 basis points over the next 12 to 14 months or so. In Canada, they already cut 2 times 25 basis at a time, or 0.50% point already and they are saying another 75 basis points to cut by April-2024. I really have a bad gut feeling that they will lower the next 12 months or so because they know they will have to increase them much more again in 2026. It looks like desperation of central banks around the world. They know if they do not cut they will have 5.75% to 6%+ bank rates in most countries around the world.
The media poured gasoline on the fire today by stating the “inflation data boosts rate cut bets” and other similar comments. Makes one wonder why they are so eager to promote the “happy days are here again” narrative. But this is not a political discussion so I won’t go there.
Cuts are more difficult to envision with stock market flares like today’s (Friday 7/26). The “wealth effect” is in full force now with these valuations and will encourage more drunken sailor spending.
The media needs fresh clicks. It is not about promoting any agenda, it is about reporting whatever the reporter/author heard in the past 5 minutes.
No cause to look for bogeymen in the shadows.
Ah, OK. Pay no attention to that man behind the curtain….
I welcome this good news and look forward to the article on Eurozone inflation
I will not do Eurozone inflation every month. Not enough of us dear USians are interested in it. Same with Canada, and worse with the UK. I do them sporadically. That’s probably enough.
We are glad to get them even sporadically. Somehow most people in this line of work (reporting) feel the need to push narratives instead of laying things out how they are
100%
That and any article about Japan.
Nice analysis. Regarding the difference between goods and services inflation, my theory is this: Good prices increased exorbitantly during the pandemic very fast due to the ridiculously printed trillions of dollars instantly. The services industry had to absorb some of the cost increases because unlike the goods industry, they are in one-to-one contact with the customers and they didn’t want to frustrate the customers with 30%-40% increases. They are now reflecting those accumulated costs/increases to their customers/clients slowly. It may continue like this for a long time because the labor costs increased a lot and continues to increase. Whatever everyone says, labor market (excluding certain IT) is tight. I know schools closing not because of lack of students, but teachers.
Another problem for the services inflation is the housing cost. Thanks to FED’s extravagant mortgage BS program for more than a decade, it is permanently out of whack now. It may take a decade or more to fix. Look at some Mediterranean countries and Russia. Owning a house became a luxury.
The wage increases are continuing… but according to the numbers today only about “half” of “expectations.”
This, plus the roll thru of insurance increases (and the rest of the stubbornly high prices) almost guarantees that this is the start of the “next wave” of inflation.
Oh yeah, M2 has been increasing all year too!
re: ” it is permanently out of whack now.”
Agreed. As Bill Dudley said: “Money banking textbooks written before 2008 are “now obsolete”, as the Fed now has the ability to pay interest on excess reserves”
That created unaffordable housing. It artificially lowered the real rate of interest.
Any cut now will be interpreted as political by one of the presidential camps. The FED must be protected and I have seen nothing that suggests Powell is not aware of this. I would bet he is happy to have the data continue to be lumpy like this until after November.
Rates will be steady until at least November. Then maybe the 25 bps reduction, just to appease the incoming Pres. Trump; before he decides to can J. Pow anyhow.
Trump won’t win in November. I have him losing and getting 31 percent of the votes.
It will be interesting to see whether or not your crystal ball is broken …
When you started talking about how after inflation takes hold, it’s hard to reverse I was a skeptic. It didn’t make sense conceptually at the time but now I get it.
There won’t be any rate cuts this year.
Won’t = shouldn’t , unless the wheels come off the economy. But to get that we would need a 3-4 sigma event over the next few months. Considering we got a couple 6 sigma political events in the past 2 weeks, anything’s possible.
Their should never be a rate cut, not this year or ever. The fat lady’s mouth should be wired shut.
Housing prices where they are, imports doubling the last 6 years, national debt where it’s at, price of services to the moon, gov spending uncontrolled, until discipline is maintained, a
“Rate cut” is the last thing that should be mentioned for years…not even a itsy-bitsy baby one.
Did I say discipline…funny.
If you go back 50 years and remove the QE timeframe of 2010 to 2019, I think inflation averaged in the high 2% and very close to 3%. Why can’t they just shoot for 3%. It seems like the economy can handle 3%ish inflation. Remove year 2009 and the average was 3.25%
Inflation in 2000 through 2009 was.
2000 = 3.4
2001 = 2.8
2002 = 1.6
2003 = 2.3
2004 = 2.7
2005 = 3.4
2006 = 3.2
2007 = 2.8
2008 = 3.8
2009 = -0.4 (recession)
you announce the target is 3%, the long end of the curve blows out. 3% means the dollar loses half its value in 23 years. at least at 2% it takes 35, more than a generation.
Then after 3 +% years, you will say why cant they make it 4+% and 5+%?
where we do end then? No inflation control.. let it tun like Turkey and Venezuela?
This feels like CNBC promoted narrative. All those people saying FED should change the goalpost when it is not hitting it.
I am just saying 2% is an unreasonable target. 3% is really the norm. I still think 3% is unreasonable too but at least they would have a shot. LOL
The government is on a pace to increase public debt by 10% this decade. Unless that debt helps productivity gains, then inflation will have a hard time realistically staying at or under 4% IMHO. The last time the government increased debt at 10% or more in a decade….1970s.
Unless they deaccelerate debt, I doubt inflation will drop any more unless there is a liquidity recession. (Borrowing money becomes expensive and people quit borrowing)
The Fed’s official legal mandate is “shall maintain long run growth of the monetary and credit aggregates commensurate with the economy’s long run potential to increase production, so as to promote effectively the goals of maximum employment, stable prices, and moderate long-term interest rates.”
The Fed has selectively misinterpreted all 3 prongs of the legal mandate:
(1) “Maximum employment” (legal mandate) is not the same as minimum unemployment (policy metric). The definitions being used for employment and unemployment are not logical opposites. There are many people not working, who could be working but are not counted as unemployed. There are also many people working who could be working more or better jobs.
(2) “Stable Prices” (legal mandate) is not the same as “symmetric 2% inflation” (policy metric). Changing the policy goal from 2% to 3% would be even worse. Achieved inflation over the past 50 years may have been 3%, but that is an epic policy fail vs. the legal mandate. And one can argue persuasively that the economy “handled” the high inflation only because the policy was explicitly pushing the inflation back down. People behave very differently when they don’t think their money will hold value. A stated 3% inflation goal would drive behavior changes likely to result in much higher real-world inflation, and possibly hyperinflation.
(3) “Moderate Long Term Interest Rates” (legal mandate) is almost universally omitted; the Fed talks instead about its “dual mandate”. The Fed’s obfuscation is so pervasive that it’s actually difficult to find the true legal mandate in online searches. Some of the Fed sites claim that moderate long-term rates are achieved when their unemployment and inflation goals are met, but the past 2 decades have disproven that claim.
Don’t they (Fed) in addition, have a fundamental bank regulatory role? eg, mortgage/loan quality? Wasn’t the Greenspan Fed primarily responsible for the GFC because they didn’t clamp down on NINJA loans, interest only loans etc? As well as bank fraud?
They do have a bank regulatory power/mandate. Loan quality is part of their job, their mandate.
Yes.
The Greenspan view (in line with many influential thinkers gathering momentum since the later ’70s) was that “regulation” and risk mitigation in finance was occurring by private means, through the monitoring and actions of self-interested and fiduciary market participants. Hence, the hands-off, light-touch regulatory approach (or neglect, depending on one’s view). In congressional hearings, with rare clarity, he admitted that view was shown incorrect, in the GFC crash. He tried to elaborate in a very turgid book after that, which sounded to me like more Greenspan-speak.
Regulatory neglect, IMO, will be a hallmark of our next probable administration, bolstered by recent Supreme Court decisions. It is more cynical in the (probable) executive branch, IMO, than the 1980’s-2000’s version. But the other side of Scylla and Charybdis, I guess, might be regulatory overreach.
They are also lender and borrower of last resort, which is how they accomplish their interest rate floor & ceiling.
Greenspan was the most Libertarian of all Fed governors. He felt the market should be allowed to run on its own. He regretted that belief later in his life.
Laissez faire capitalism invites corruption.
Reread Adam Smith’s Wealth of Nations. He warns, repeatedly, about the tendency to exploit the commoners & laborers. That’s not an argument for socialism, it’s for balance, through regulation (which has been turned into a dirty word).
How – in older, royalty-heavy times, it was known as: ‘…enlightened self-interest…’ (…of course, THIS time (whatever time it may be) is ALWAYS ‘different’…). Best.
May we all find a better day.
Need to brush up on my #s. N-gDp was lower than 5% in 4/1/23 and in 1/1/24. 10yr yields fell sharply on Friday.
The economy is doing fine at 5.5%, strong gdp and low unemployment. You cut substantially here inflation is picking back up. Even if you want to argue 3% is not that bad, that’s a reason to not raise rates – it’s not a reason to cut them.
The distributed lag effect of money flows, the volume and velocity of money, are mathematical constants. R-gDp rebounded because the rate-of-change in short-term money flows has been up since 2023.
The FED doesn’t have much of a window to drop policy rates. The lag for inflation will work against it next year.
Could you elaborate on this? I get the first paragraph but not the second.
All fueled by massive deficit spending.
If you reduce this, the economy would be in dire trouble.
…all of which is to say that they don’t even have a very good argument for *not raising* rates, let alone cutting them.
Which of course, knowing the Fed, doesn’t mean they won’t cut them.
Hi Ru! My name is Stockton Rush. I want to offer you an exciting and unique opportunity to go for a ride on my expeditionary submersible that I call Titan. I’m an innovator and explorer who isn’t afraid to try new things and push boundaries while all those old-school pussy-ass engineers cry about technical standards and conformist fun-killing safety. They’ll never achieve anything and take things to new levels with those attitudes. They say my submarine is only good for, at best, like 8,000 feet deep. Well let me tell you those fools are wrong because I’ve already been down to the Titanic a few times at 12,500 feet deep. Those guys are losers. Obviously if I can do 8,000 feet deep, what’s a little more difference like 12,500 feet going to really make. If it worked so far, why not just push it further. Those other engineers were just too afraid to man up and try for more. Wusses. Do you really want to be held back by those pessimistic naysayers who never achieve anything, or me, Captain Pink Slime! Let me know if you want to go, I’ve got standardized contracts for you to sign and we can be on our way. Let’s see the bottom of the sea, together, friendo!
Markets think it’s great news. Locked in for rate cut in September. Are they misinterpreting the data?
Markets have been misinterpreting the data for several months. They never learn.
Misinterpreting or attempting to steer the Fed?
Nah, markets were just ready to bounce after the selloff. Futures were up bigly well BEFORE the PCE release.
Week and month ending profit taking by the shorts.
You mean misinterpreting data they had not seen yet, because it was published today?
might just be their lack of time machines
I think whether the fed cuts depends on two things:
1) if they care about the housing market – they’ve stopped the insane appreciation. My guess is the goal would be to hold prices flat until wages slowly catch up with the new cost of living.
2) data and avoiding looking political. I think because of the timing of September meeting – they’ll need a strong reason to cut or they’ll be accused of trying to help the Democrats. On the other hand if there’s strong data to cut and they ignore it, it will look like they’re trying to hurt the Democrats. I think most of the fed is probably hoping for mixed numbers so they can continue to say we’ll see and avoid looking political. If the numbers come out hot, they’ll probably need 6 months of them to raise so that issue doesn’t seem on the table prior to the election.
The Federal Reserve has nothing whatsoever to do with the housing market in the US. All mortgage rates are based on the yield of 10 year US Treasuries plus around 3%.
The Fed only has direct control over short-term rates, but it also influences longer-term rates.
The Federal reserve has a large balance sheet, and is an active participant in both the Treasury Bond and Mortgage-Backed Securities (MBS) markets.
Mortgage interest rates were suppressed for a very long time by the Fed directly purchasing MBS starting with the 2008 financial crisis.
Back then, the Fed was so keen on influencing the housing market it was bought trillions of MBS even though it was illegal for them to do so. The MBS were not federally guaranteed then. The Fed’s MBS portfolio was only legalized later.
As for influencing 10-year Treasury rates, google for “Operation Twist”.
Nope. What you are asserting falsely simply wasn’t so.
Last housing bubble peaked right as the Fed raised rates, just like this one, when you look at a price per square foot basis.
Not a coincidence.
Just coincidence as the US Treasury yields were rising, and those yields – not the Federal Reserve – are what affect mortgage rates just as I clearly stated.
Right but higher fed rates have resulted in higher 10 yr treasury yields, so that in fact impacted the housing market. That’s why when they fed cut rates to 0 we had 3% mortgages and when they now raised them we had 7% mortgages. It’s come down a bit now because the anticipation of cuts – but the has a very large impact on the housing markets.
No, they mostly certainly have not at all. 10 year rates are all set by the markets based on US Treasury demand and should be and will be much, much higher ahead.
I think we can all comfortably ignore scbd, but for his sake: as you have stated the MARKET sets the 10yr rate, true, but the federal reserve itself has been buying up trillions of dollars worth of treasuries that now sit on their balance sheet, along with trillions of dollars or mortgage backed securities, both of which indirectly, and directly, affected the housing market. If you are denying the Fed’s massive balance sheet, I don’t know what else to say, I wish you well.
You’re both wrong.
The Fed is still doing QT, so they’re a) not buying more duration, and b) they’re arguably pushing yields on duration up compared with keeping the balance sheet steady by replacing matured bonds.
How low would the 10 year yield be if the Fed’s bal sht was as high as it was a year ago? Think about it.
Thanks WR for this report.
When I read your article like this today and then when I visit MSM, I feel I am living in 2 different worlds.
The MSM is touting this new inflation report as positive, paving road for FED to cut rates and stock market reacted in similar way.
@wolf I’m curious what have revisions been like the last few months?? A few nights ago I listened to a friend rant about all the headline numbers being released to make the Democrats look good since that’s all most people pay attention to:
– strong gpd
– strong job gains
– lowering inflation
But that if you look at revisions:
– gdp gets revised down
– job gains get revised down
– inflation gets revised up
He’s not a republican, he’s a crypto enthusiast and was going down the rabbit hole of the numbers all the headline numbers being fake and later revised to more accurate values on purpose. He is a person who diligently researches things, is very financially literate and well educated so this was a surprise.
Any truth to that being the directionality of revisions in 2024?
The prior PCE revisions this year have been too small to worry about. There were plenty of down-revisions among them. When revisions are big, I report on them. A couple of years ago, we had some huge ones in the inflation data.
Revisions are up and down. You just have to look at enough revisions, and not cherry-pick them.
Revisions are included in the data, as you can see in today’s number. The 3.4% six-month annualized that we got today due to the revision is the highest in a year. It also raised the year-over-year figure. How is that going to help Democrats????
People who say that these prior-figures-and-revisions are done to help Democrats are just spinning ignorant political yarns. I just delete this shit. It belongs on X, not here.
X is the sole place where Biden announced his retirement
Anyone can post anything on X, so people do, it doesn’t matter what it is, you brew up something toxic and post it on X, and that stuff will be right next to a Presidential announcement. Fine with me. That’s what X is for. But not this place here.
Hopefully we get higher for longer to help the lower and middle class . The Fed needs to be patient . June had the SPR gasoline sale that dropped wholesale gasoline prices though not in the PCE or Core the lower price does trickle down the pipeline with lower prices . The stockpile of gasoline sale was from Sandy a once in a century or more perfect storm. June and July inflation suppressed from this one off event
BSi/Wolf – not clear, given the limited ‘shelf-life’ of gasoline, if that ‘gasoline’-allocated segment of the SPR is actual, refined fuel, or petroleum to be refined into fuel(s) if needed?
may we all find a better day.
Gas and crude prices are lower because of record crude oil production in the US. Same with natural gas prices. The govt sales were a miniscule drop in the bucket compared to the market.
It makes for good headlines though.
@MM1 – With regard to employment and GDP/GDI data, the data gathering and processing takes time. So in the preliminary reports the missing data are often filled in by modeling estimates. For instance, the initial employment data includes a “company birth/death model” to estimate job gains (and losses) for new businesses (and businesses that close).
Those model estimates are known to be inaccurate near economic turning points. When the economy is tipping into recession, people stop starting businesses, and marginal companies shut down. But the birth/death model doesn’t know about that in real-time, and as a result the initial employment report comes out as an over-estimate.
Historically, a preponderance of negative revisions for employment and GDP is a cautionary sign, a hint of an emerging recession. When the economy is strengthening, one sees the opposite.
I’m not sure how it plays out for inflation. But in my experience, those looking at the data with a partisan mindset, or with an eye to their investment “book”, tend to have biased interpretations.
Side comment: It’s very disheartening to see the government continuing to rely upon a slow data process with a birth-death model that’s known to be systematically wrong at economic turning points. At the times when the data are most important to the nation, our system misleads everyone. This is an evil that should be fixed.
“At the times when the data are most important to the nation, our system misleads everyone.”
The biggest problem right now in the employment data is that the BLS uses the Census Bureau population data, but the Census Bureau has not yet included the 6 million immigrants that have come into the US in 2022 and 2023, many of whom are now working. That 6 million immigrants is a figure that the Congressional Budget Office has come up with, using ICE data, and combining it with Census data.
But Census is still clinging to its algos, and they haven’t yet been adjusted for the explosion in immigration in 2022 and 2023.
The CBO did this study precisely so that policy makers, including the Fed, have a better handle on the actual employment numbers. And they’re all talking about it, including the Fed. But Census refuses to fix its numbers, and the BLS is stuck with the Census data for its household survey numbers.
These missing 6 million immigrants that are not in the BLS data mean that the labor force is maybe 4 million higher than the household survey shows, that there are maybe 3-4 million more working people (jobs) than the household survey shows, etc. The household data has been vastly understating employment for the past two years – which is obvious when you compare it to the establishment data (nonfarm jobs) – and has become useless because the Census refuses to fix its population data in line with the CBO data.
This is the most vexing data problem right now. Census will eventually revise its figures, but that takes time.
Thanks for summarizing. Quick question, does the QCEW employment reports that come out after a long lag incorporate these immigration numbers?
The 6 million immigrants will not show up in ANY BLS data until the Census revises its population estimates.
If you include the 6 mil immigrants you’d also include 6 mil more employed workers. Most immigrants work minimum one job and many as much as two or three, at least here in Florida.
Yes, that’s what I’m saying – they’re here and they’re working but they’re not reflected in the household survey data.
But the establishment survey (nonfarm jobs) picks up the immigrants that have regular payroll jobs, which is why nonfarm payroll jobs have continued to grow at a brisk pace while the total jobs provided by the household survey have gone nowhere. The influx of immigrants explains the rapidly widening gap between the two.
Does it possibly take more than time?
Could “political considerations” also delay it?
Pardon me for being skeptical of the idea that government bureaucracies operate independently.
That stuff is just ignorant BS, and no, I don’t “pardon” it. It’s the GOVERNMENT — the Congressional Budget Office — that brought out the disparity so that policy maker actually know what is going on. Read the comment!!!
“ “Core Services” PCE price index is where the big revisions for May took place.”
How, pray tell? We all know that the rent increases are done… even reversing (depending upon the brainwashing you submit to). Of course healthcare is getting cheaper too! /s
Only transportation has a chance to normalize with energy prices… as long as you don’t have to pay the driver!
We have our HOA insurance renewal still in front of us for the year. I am concerned. We KNOW it will increase. 100%? Or 400%? Who knows?!?
Anecdotally: I DO agree with the firmness of the high end RE market. We have a(nOTHER) condo on my property under contract. This time setting a record price/sf. In our county! Just shy of $3000/sf (in today’s USD).
What a bargain!
I read that vehicle prices have accounted for nearly 80% of the decline in core goods over the last year. Do you think that is accurate? It would seem improbable that one category could affect the total so drastically. If it is true, it would explain why I have not seen this reported price reduction in the goods I buy (ex-autos).
Could be right. New and used vehicles are the dominant part of core goods. They account for about 20% of consumer spending on ALL goods, including fuel and food (which are excluded from core goods). Vehicles may weigh like 30% or 40% of core goods. But other core goods fell too: electronics, furniture, appliances, recreational vehicles, etc. The decline in core goods prices is spread far and wide — after the huge spike.
Note that durable goods don’t include shoes, socks, and supplies. Core goods do. So it’s a somewhat broader measure than what I use here.
That is interesting if true. Cars spiked in price to sometimes insane levels during the pandemic when supply and production lines shut down. New Ford pickups with $15k dealer adjustments on top of $65k stickers. Used Honda CRVs with 100k miles selling for 80% of original MSRP (I saw this on a VW dealership lot in late ’20).
But car prices can’t fall forever and I’m seeing normal year-end clearance prices again. If there’s no more offsetting core deflation in autos then core inflation may be quite a bit higher going forward?
Freely admitting that I’ve lost the narrative —- is the Fed cutting because economic growth is stalling, or because economic growth remains strongly resilient?
“…that I’ve lost the narrative…”
Agreed.
“is the Fed cutting because…”
The Fed isn’t “cutting.” The correct phrase: The Fed “might cut sometime in the future.”
But the Bank of Canada is “cutting.” It has cut twice already.
Silly me.
I thought “higher for longer” referred to FED Interest Rates.
Not Inflation Rates.
My Bad.
Both will be.
5.25-5.5 rates and 3-3.5 inflation is the new normal.
“Gasoline and other energy products fell further in June from May”
It might be anecdotal. But from our just recent 1900 mile road trip, fuel prices are on the rise. We passed through 5 states. On our return trip prices for fuel were higher in every state than our outward bound trip. MI was the worst. We filled up on a Sunday @3.49 per gallon before leaving. 8 days later 3.99.
Plus the charts look like oil has bottomed. So all these retail increases were occurring when oil was flat or falling.
All of this will factor in to the reinflation that is likely coming this fall. If there is a September cut that will just accelerate the rise.
IMO the FED missed their window. They should have continued to raise until there was a noticeable slowdown, giving them room to the begin cutting.
They are going to end up cutting and inflation will take off again.
Also anecdotal: I have been paying between $3.70 and $3.80/gal for premium in southern NH for the last couple months at least. This is with weekly fill-ups.
Services is where the inflation remains hot. But when energy prices do eventually bottom, that will push the overall inflation figure up even more.
Regullar gas was $6.20/gal at the Truckee, CA Chevron when we passed it last night (we filled up for $4.70 when passing through Sacramento brfore heading up and over Donner Summit since most Bay Area stations are close to $5/gallon).
Wolf,
Many thanks.
Hilarious to read multiple comments saying rate cuts coming, perhaps as soon as September. Really? 4-month T-bills saying no cuts through November. ONRR usage still stuck above $375 B every day. Wouldn’t expect cuts to be an option before hitting zero. Apart from these indicators, where is the compelling reason to cut interest rates when the economy has re-accelerated and inflation is stuck well north of the Fed target?
Also does anyone advocating rate cuts realize what this will do to their portfolio? Evidently not.
Inflation set to get juiced here the balance of the year. Elections are awfully expensive endeavors. Pedal to the metal on services spending through November 5.
Yup still getting 5.37% on my recently purchased Nov & Dec maturities
This upward revision of PCE and the likelihood of rate cut hesitancy, to continue be patient, with higher for longer, suggests more sticky inflation in months ahead — but, the only reason I see for rate cuts, is surprise revisions to labor statistics.
Many of this revisions won’t come about until next year, so that helps make a case that Fed will continue practicing the gospel of HFL.
The only reason I bring up revisions, is because of the work by Anna Wong at Bloomberg — she seems authentic….
“Several Fed officials seem to believe the labor market is still tight, but we estimate, based on more comprehensive measures, that monthly nonfarm payroll prints likely overstated job growth by 730k last year — with hiring maybe even falling below zero in October. ”
Apparently, birth-death QCEW data isn’t totally revised until late next year — awkward and confusing.
More BS. The jobs data from the household survey will show a massive UPWARD revision of employment and labor force when the 6 million immigrants that have come in 2022/2023 are included — this 6-million-immigrants data is from the Congressional Budget Office that used ICE data to come to grips with what’s going on. Everyone knows this massive up-revision is coming. You can kind of guess what the up-revision will be by comparing the employment data from the household survey to the nonfarm jobs data. The up-revision of the household survey jobs data will be in the millions.
One final thought, doesn’t matter if deleted
The way I see splitting hairs is the impact on BOTH unemployment rate revised upward — but increase in labor force.
I think the upward increase in unemployment is the bigger factor?
“ The overall unemployment rate is mostly unaffected by the immigration surge because two factors offset one another. In 2024, during the peak of the surge in CBO’s projections, the unemployment rate of new arrivals is relatively high (because it takes them time to find work), which increases the overall unemployment rate. That effect is offset by an increase in the demand for goods and services following the surge in immigration, which reduces the unemployment rate. On average, the unemployment rate is about one basis point lower from 2024 to 2034 because of the surge. (A basis point is one one-hundredth of a percentage point.) Although the unemployment rate is largely unaffected, the number of people who are unemployed in the economy increases as the labor force grows.”
That’s a hobgoblin
For those of us non-financial gurus, does this capture PCE? BEA’s closely followed personal consumption expenditures price index, or PCE price index, is a narrower measure. It looks at the changing prices of goods and services purchased by consumers in the United States. It’s similar to the Bureau of Labor Statistics’ consumer price index for urban consumers. The two indexes, which have their own purposes and uses, are constructed differently, resulting in different inflation rates.
The PCE price index is known for capturing inflation (or deflation) across a wide range of consumer expenses and for reflecting changes in consumer behavior. For example, if the price of beef rises, shoppers may buy less beef and more chicken. Also, BEA revises previously published PCE data to reflect updated information or new methodology, providing consistency across decades of data that’s valuable for researchers. The PCE price index is used primarily for macroeconomic analysis and forecasting.
A variation is the personal consumption expenditures price index, excluding food and energy, also known as the core PCE price index. The core index makes it easier to see the underlying inflation trend by excluding two categories – food and energy – where prices tend to swing up and down more dramatically and more often than other prices. The core PCE price index is closely watched by the Federal Reserve as it conducts monetary policy.
AI-generated fluent bullshit. AI is trash. AI = artificial idiocy, AI doesn’t know shit, and your AI-generated text here is proof.
MW: Some of 2024’s most popular trades are coming undone after reaching ‘stupid’ levels
$2T in mkt cap? Aaaaaand it’s gone.
My data has been consistent and is 100% reliable*.
Naturally the specific figures are confidential, but the trend has been consistent. I can’t post a chart so here is a summary in text form.
*This is just a stab at humor but it is unfortunately, true.
Jun Spend UP/Cash accounts DOWN
May Spend UP/Cash accounts DOWN
Apr Spend UP/Cash accounts DOWN
Mar Spend UP/Cash accounts DOWN
Feb Spend UP/Cash accounts DOWN
Jan Spend UP/Cash accounts DOWN
Dec Spend UP/Cash accounts DOWN
What’s “cash accounts?”
Money market funds ($6.4 trillion)? Large CDs ($2.4 trillion)? Small CDs ($1.1 trillion). Total bank deposits ($17.6 trillion)? That’s where the cash is. They’re up over the time period you mention, not down.
Howdy Lone Wolf. YEP, some of US are living in Squirrel Heaven at 5.39%. Shame Shame Shame for ZIRPing in the USA…..
Wolf,
In your opinion, how many rate cuts would it take to set off an inflationary spiral?
Howdy Tulip. I would love to see the lone Wolf create a chart. Showing the 70s 80s inflation rates compared with the FED funds rate.
I have shown this chart many times before, for historical purposes, last one in May 2023. If you see it once, it’s enough for all times because the chart will never change. And the current stuff I cover with detailed charts that go back only a few years so you can actually see what’s going on now:
Howdy. Thanks. I have copied and pasted……
If you look closely at that chart, you will notice that whenever the Fed Funds Rate peaks and then declines, it was immediately followed by recession…..
Nonsense. The chart doesn’t say anything about recessions, and you apparently don’t know when they occurred. For example:
There was no recession between 1983 and 1990. But there were MANY rate cuts and rate hikes.
There was no recession between 1991 and 2001. But there were many rate hikes and rate cuts.
In 2019, the Fed cut rates and there was no recession. In March 2020, there was a pandemic, but that wasn’t part of the scenario of the 2019 rate cuts.
The Fed cuts rates for a variety of reasons, such as inflation having dropped far below the EFFR. When the EFFR was 11% and inflation was 5% and heading to 4%, it’s time to cut rates a little, no?
Interest rate cuts would signify a DEFLATIONARY SPIRAL which is the exact opposite of what you are referring to.
It’s probably going to take one right cut.
Which would be great I’d love to see a head fake inflation go through the roof and then the Fed has to raise even higher for longer.
More data supporting Mosler’s contention that, over time, inflation bends toward the Fed’s interest rate — in this case upwards as the stimulus keeps coming via the interest income channel.
What is the annual US Federal deficit, something in the order of 6%? That is NOT restrictive …
Ouch! Lower fed funds and cpi after a large runup has almost always equalled recession.
…Or DEPRESSION.
In the past, triggering a recession was the goal of tightening because a recession (declining demand) tamps down on inflation. Triggering a recession was the classic tool used to fight inflation. Volcker purposefully triggered the nasty double-tip recession that finally broke the inflation fever.
But now, the goal is a soft landing — meaning getting rid of inflation without a recession. So wish us good luck.
Everyone here who is stating one way or another what the FOMC will do in September need to shut up.
There are still two CPIs, two PPIs, two JOLTS and a PCE between now and then, plus some 6 weeks of geopolitics and Presidential politics that could throw more chaos into the whole equation (e.g. if Israel invades Lebanon).
In other words, the situation is clear as mud and will only become clearer as the weeks and additional data is revealed.
Not sure if this is appropriate to post, and I understand this would be for entertainment purposes rather than investment advice… How do folks prefer to gamble on fed rate changes? I understand there’s a range of strategies such as shorting bond ETFs, CME Fed Funds future options, and probably countless other strategies. I usually don’t mess with options in favor of more hands-off strategies like holding ETFs long-term and value investing in individual companies. Is there a simple, somewhat hands-off way you like to gamble on rate futures, that limits risk?
The NY Fed just released their Multivariate Core Trend of PCE, which indicates a steady and strong downward trend:
https://www.newyorkfed.org/research/policy/mct#–:mct-inflation:trend-inflation
This is year-over-year. All inflation indices show a deceleration year-over-year — including core PCE, see 2nd chart above — because the second half of 2023 produced very low month-to-month inflation numbers which are feeding the year-over-year deceleration through June.
But the first half of 2024 produced much higher month-to-month inflation numbers, causing the 6-month core PCE to accelerate to the highest rate in a year (3.4%) — see 1st chart above.
And as the second half of 2023 fades out of the year-over-year indices over the next six months, the first half of 2024 and the second half of 2024 will begin to dominate.
The Fed has been talking about this acceleration in the first half of 2024. They’re looking at the acceleration of month-to-month inflation figures in 2024, and that’s why they decided to wait-and-see so far this year instead of cutting.
Thanks for the thorough response. Fair enough. But then if we are playing this game, it would seem the six-month moving aggregate is soiled by one outlier way out of the range of the last 15 monthly readings and that outlier will be dropped from the six-month window in two months.So assuming no new outliers like that the six-month readings should also curl down possibly below 3% yearly in two months.