Everything got more expensive over the years, the population grew, so debts rose, but income rose too.
By Wolf Richter for WOLF STREET.
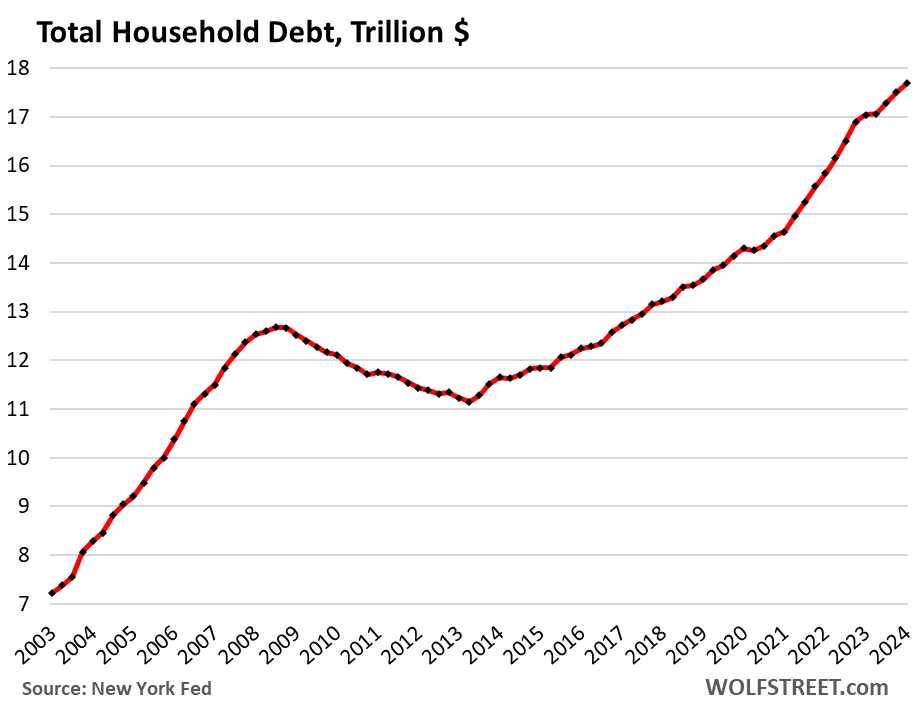
Total household debt outstanding ticked up by $184 billion, or by 1.1%, in Q1 from Q4 to $17.7 trillion, on declines in credit card balances, other revolving balances, and student loan balances, according to the Household Debt and Credit Report from the New York Fed today:
- Mortgage debt: +1.6%; to $12.4 trillion
- HELOC balances: +4.4%; to $376 billion
- Auto loans: +0.6%; to $1.62 trillion
- Credit card balances: -1.2%; to $1.11 trillion
- Other balances: -2.0%; to $543 billion
- Student loans: -0.4%; to $1.59 trillion (due to loan forgiveness, not because people suddenly paid down their loans; we don’t even consider them “loans” anymore).
The aggregate burden of household debt.
One way to measure the burden of debt is to compare the debt to the amount of income that is available to service this debt.
Everything is more expensive than it was years ago – particularly homes and vehicles. In addition, the population has increased over the years. So financed amounts have risen.
But “disposable income” has risen too – defined as income from all sources but not capital gains (wages, interest, dividends, rentals, farm income, small business income, transfer payments from the government, etc.), minus taxes and social insurance payments. This is essentially the cash consumers have available to spend on housing, food, cars, debt payments, etc. And the rest that they don’t spend, they save.
Disposable income (data from the Bureau of Economic Analysis):
- Quarter over quarter: +1.1%
- Year-over-year: +4.3%
- Since 2019: +26.7%.
So in aggregate, the entire $17.7 trillion in household debt amounts to 85% of disposable income, roughly unchanged over the past four quarters, and a historically low burden, beaten only during the stimulus era when free money washed over consumers and became part of their disposable income.

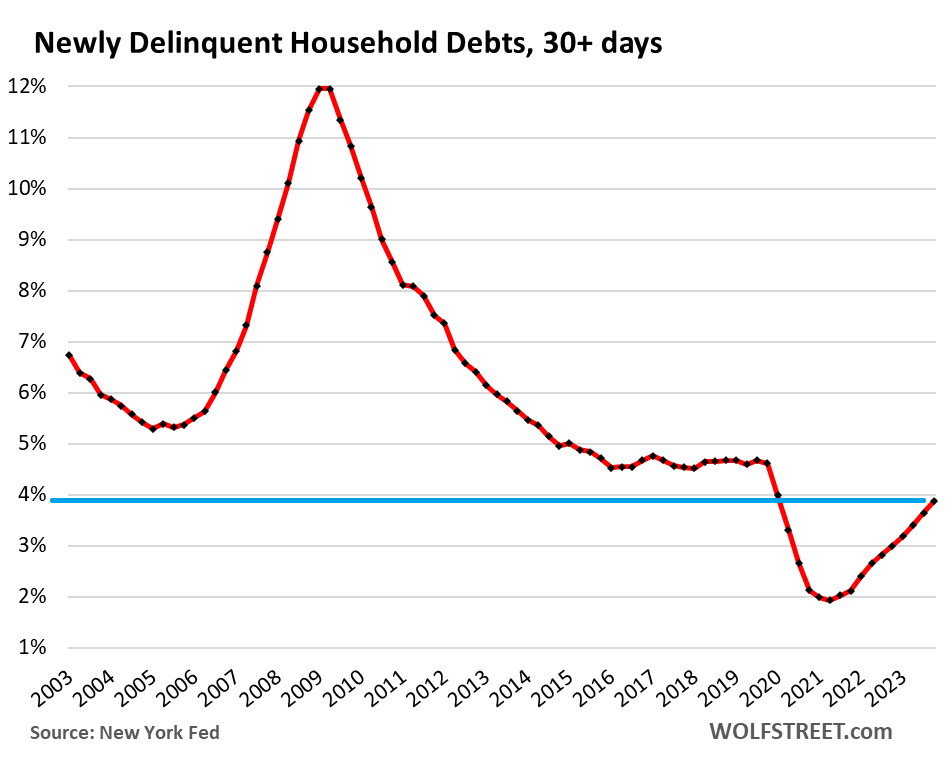
Delinquencies haven’t even normalized yet.
Transitioning into delinquency: Household debts that were newly delinquent by 30 days or more at the end of Q1 ticked up to 3.9% of total debt balances — still lower than any time before the pandemic.
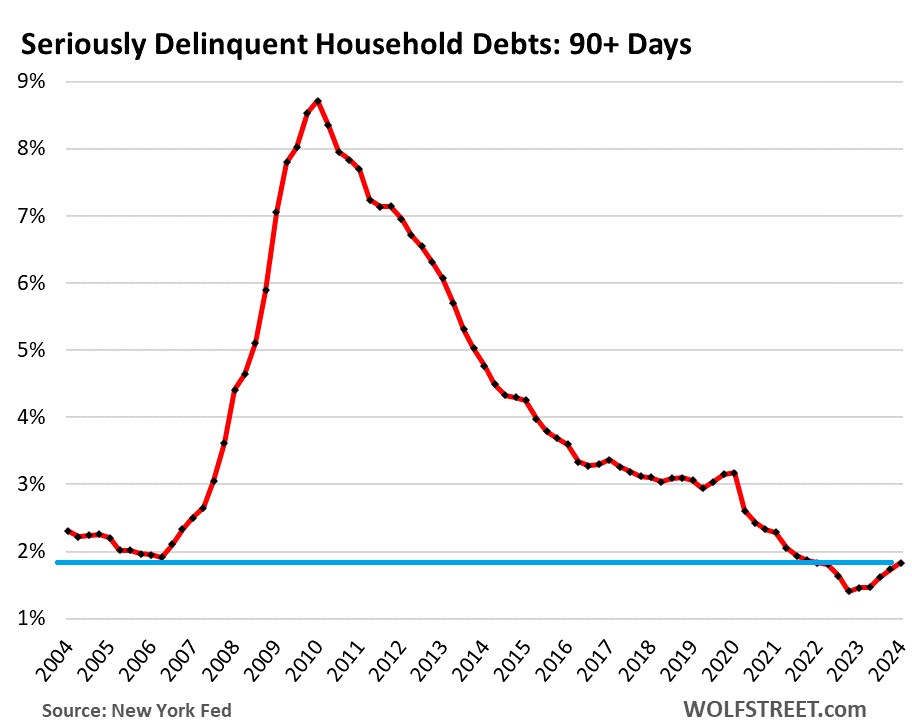
Serious delinquency: Household debts that were 90 days or more delinquent by the end of Q1 edged up to 1.8% of total balances, still lower than any time before the free-money pandemic.
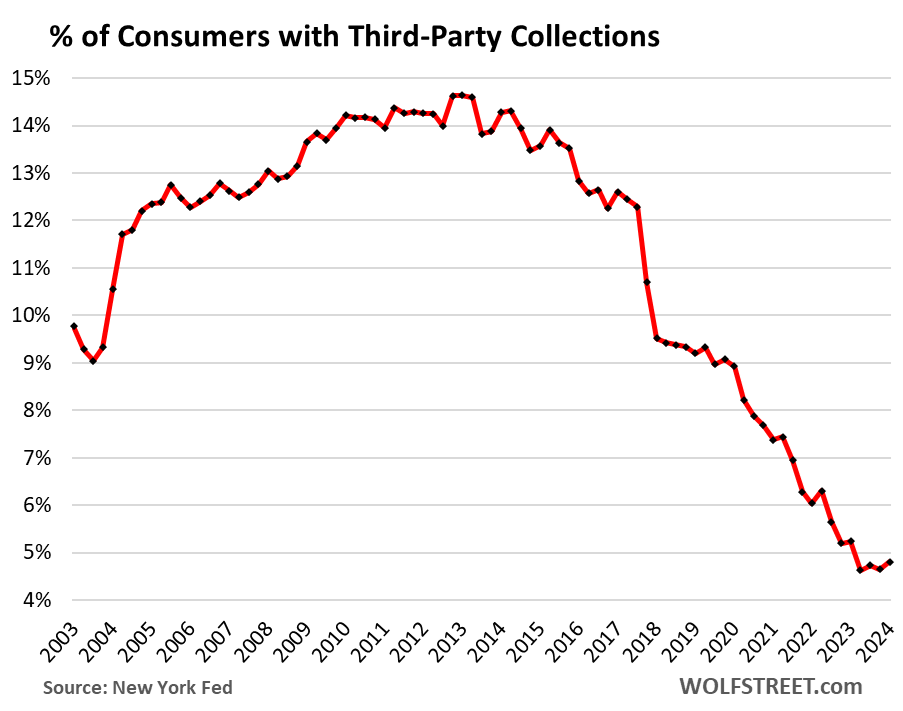
Consumers with third-party collections near record lows.
So these are the poor souls that are being hounded by the collection agencies to which banks and other lenders sold their defaulted and written-off consumer loans for cents on the dollar.
The percentage of consumers with third-part collections inched up to 4.8%. Just about every quarter since the beginning of the pandemic, the percentage had hit new record lows, and that process finally bottomed out a year ago, and what we’re looking at here is still lightyears from anything close to normal:
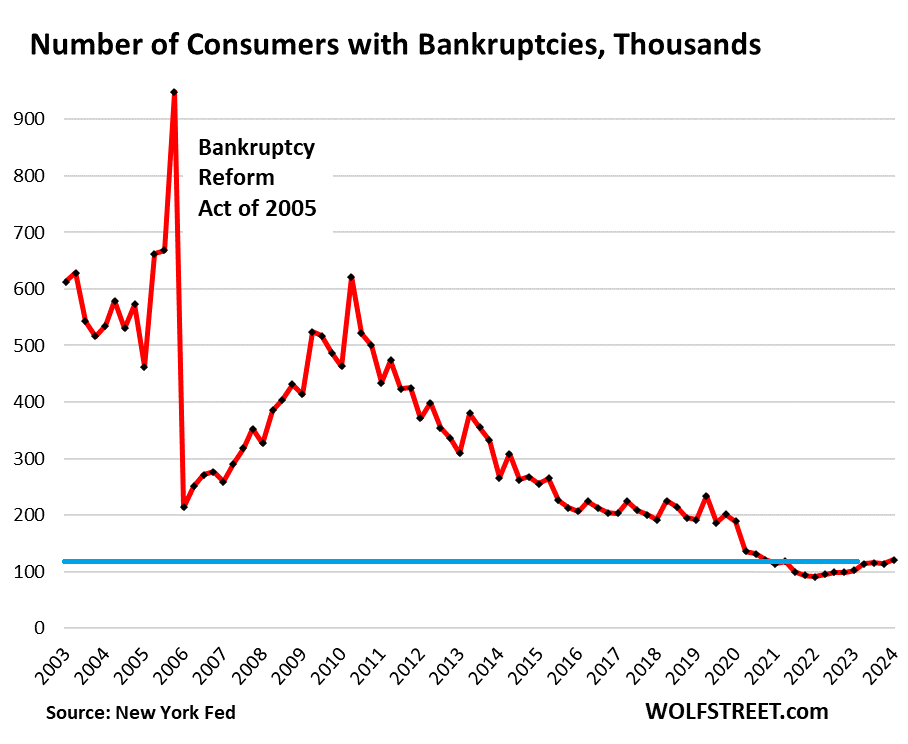
Bankruptcies continue to scrape along the historic bottom, with just 121,000 consumers with bankruptcy filings in Q1, compared to the already low levels of the Good Times before the pandemic of around 200,000:
The free-money era is over.
That is what the overall household debt picture shows. Our Drunken Sailors, as we have come to call them lovingly and facetiously, have been sober enough overall to keep their balance sheets overall in good shape, with the debt burden moving along historically low levels.
But somebody is always in trouble, subprime is always a factor, but subprime doesn’t mean “low income,” it means “bad credit,” and goes across the income spectrum, and there’s always some of it.
We’re going to dive into the details shortly with separate articles for housing debt, credit card debt, and auto debt. So stay tuned, we’ll shoehorn those articles in between our CPI report, Canada’s most splendid housing bubbles, and other stuff coming up over the next few days. Details on housing debt hot off the press.
Enjoy reading WOLF STREET and want to support it? You can donate. I appreciate it immensely. Click on the mug to find out how:

![]()
All debt categories are at historically low levels. However, they are all turning in the wrong direction. It will be some time before there is any real impact to the economy.
Thanks for helping to see the big picture.
“Wrong direction” is relative.
It’s about time.
“It will be some time before there is any real impact to the economy.”
Wolf’s charts show this impact may come a lot faster, though. Look at the serious delinquent debt chart and of how fast it shot up in 2006-2007 from the 2% base-line level. That was a really steep climb from 2% up to 7 or 8%, I haven’t gotten into the original data but looks like no more than around the 2 years from the “don’t worry” level of 2% to 7%. Which of course was tip of the iceberg that brought down the Titanic.
What’s maybe more dangerous now than 2007, is back then the US deficit and national debt was still low and inflation, low. So we had more fiscal and monetary options when things started to get scary in late 2007. But now inflation is constantly threatening when Americans are having trouble affording homes or rent, we already have a homelessness crisis and there’s huge deficits so if things get ugly again, it’s going to get a lot harder to do emergency measures like 2008, without stoking massive inflation and a dollar collapse, and basically a total unravelling of US society and stability. It doesn’t matter that inflation has come down, prices since pre-pandemic are still way up and it’s been uneven at best for Americans to afford them. And letting inflation “rip” won’t work to help debt if costs for both the public sector and households make things even more unaffordable.
And then too it’s been getting much harder to get homeowner’s insurance due to worsening weather and the high cost of housing, that’s an “x’ factor that hasn’t been talked about enough on the housing bubble. There were a lot of reasons behind the housing crash that started very slowly in late 2006 in bubbly markets (Vegas, Florida) and true, we don’t have that kind of subprime threat now. But with home prices so out of control in so much of the country it also gets harder for insurance to cover the costs of natural disasters and severe weather. Including in once again bubble Florida, history repeating itself, and that puts a lot of downward pressure on overinflated housing prices especially if only cash buyers (and even then many self insured) can get mortgages because the insurers are pulling out. Another reason why ZIRP, QE (with MBS) and running the printing press to such an extreme from Covid was such a dumb idea, it’s put us in an even more precarious situation when the inevitably correction hits.
I doubt if we such a delinquent rate increase as we did in late 2000s but it will spike during a recession.
It was easy money back then. I know a person who made $55k a year and had 6 kids who in 2006 bought a $550k house with 3% down. 10x his salary. He then took out a home equity to make renovations. He actually sold right before the crash an made a little chunk of money.
I asked him how did he get such a loan. He said it was a no documentation loan. His wife had just started as a relator and he told the bank they had income of over 100k since his wife was going to knock it out of the park in real estate. LOL Anyway, as long as his credit was good, it was easy.
He had waited about 5 months to try to sell the house in late 2008 , he would have most likely gone the bankruptcy route. Instead, he made a little money.
Wolf,
So to sum it up, the vast majority of consumers are in good or great shape, no recession anywhere to be seen, unemployment at multi decade lows, inflation is running hot…AND ACCELERATING…
And the Fed is talking about rate cuts, which is causing Wall Street to just go completely bananas…
Which tends to cause more wealth effect… and inflation…
Did I miss anything?
Household debt chart looks about the same as government chart. Up and up steadily to the right
You have been fooled. All population-related and income-related charts look that way too.
What matters is the relationship of debt to income measures, such as: debt to disposable income, Chart #2, that goes DOWN from the upper left to the lower right.
So here it is again, in case you missed it above:
But the government-debt-to-GDP chart is nearly the opposite of the household debt-to-disposable-income chart. That’s where the debt problem is: with the government, not households (and businesses are also overleveraged):
So what we are seeing is a wealth transfer from the government to the private sector (aka vote buying).
Have you looked at any other countries that have similar charts?
Greece comes to mind…
Japan.
I’m thinking the Gub’mint is running a “scared straight” type of debt program?
Apparently households are getting the point (debt = slavery).
Then again, we’re also supposed to clamor after power and wealth: Like the businesses and government have?
Struggler,
Yep, the Ancient Greek question, “What is the good life?”, was answered long ago….the only diff presently is we have to clamor much harder…and the “winners” are kinda pulling up the ladders…..some people are even into missile silo homes, providing they “clamored” hard enough, or so the “hard earned money” American Dream theory goes.
A pretty stupid answer to that old question, but we’ll ALL pay for it eventually……a pro will tell you that Security is measured in TIME…..not wealth.
“All the real talent is siphoned off into the Arts and Sciences, and that leaves the dregs to put it all together”
Bucky Fuller
Sounds about right.
Wolf?
The McKelvey Rule is never wrong. The Fen is not cutting anything. Consumers are in the worst shape in history.
It’s had 3 false positives. Or called 11 of the last 8 recessions. Respectable, but not “never wrong”.
$1.6 trillion in Student Loan forgiveness just from Q1-Q4? My God. I wonder what the aggregate monthly payments were on that amount, money that is now freed up to spend spend spend.
No, no, no. the dip of -0.4% was due to loan forgiveness. The total remaining balance = $1.59 trillion
From all I’ve read the forgiven debt was on loans that payments were not being made (because of the expectation of forgiveness). So no additional freed up money.
Gotcha. Why do I suspect that there will also be no cancellation of debt tax.
“Gradually. Then suddenly.”
The numbers from years past, prior to big problems, all show low levels of debt issues. Then, as if by black magic, everyone has trouble at once. Interesting how that works.
People’s finances have been buoyed by massive deficit spending sending sparkling dollars to any and all. The graph above showing the US Govt debt zooming up and to the right like the most beautiful stock chart, is the sand in the gears that “has” to give way, right? And it will happen right after the election. :)
There are problems in consumer credit. But they’re limited to the small corner of subprime overextended consumers. We’ll get to them shortly.
“Total household debt as a % of disposable income”
….thanks for pointing this out Wolf.
What a lot of the click bait perma doomer crowd gets wrong with credit card defaults, auto defaults, household debt levels, mortgage defaults, etc…..is they do not put them into longer term persepctives, and/or don’t compare them to changes like disposable income, population growth, etc…
But the newly delinquent and serious delinquent Americans charts aren’t absolute numbers or just total debt, they’re percentages. So they already are adjusted for things like disposable income and population growth, and that allows more apples to apples comparing to earlier periods with lower population. So it’s kind of straw man to say that concern about this is perma-doomer. It’s taking a realistic look at the numbers and trends.
Now this doesn’t mean an immediate crisis, Russell’s comment at top is probably right that at least there will be some delay before things get ugly, but the charts also show it may not be a very long delay, could be as little as around 2 years if the trends from 2006 repeat. And there are reasons to suggest things are even more precarious. No, we don’t have subprime loans and those crazy derivatives like in 2006 causing the same threat. But the whole reason Americans recently had lower debt and so much disposable income, it was due to the biggest public stimulus in history when Covid hit, somewhere around $10 trillion in fiscal stimulus, and ZIRP and QE with crazy MBS buying. Not due to some magical wealth making machine or super increase in productivity. And of course, a lot of that stimulus was huge over-stimulus from things like PPP program that got riddled by fraud, and the pause on student loans.
So now that massive huge stimulus has been mostly spent down, PPP is gone and the fraud recipients getting prosecuted, student loans re-started and we don’t have the breathing room to give that level of stimulus again. And, there’s also more hidden debt compared to before in buy now pay later and since Klarna and the other BNPL’s don’t report to credit agency, we don’t have any idea how big that debt burden is, except some indications it’s a lot and the unpaid part has even nastier interest rates than credit cards. We don’t know, but there’s a lot of data to suggest we should at least keep close eye on this.
This just in from the Chief Economist at Interactive Brokers:
“Financial conditions were quite loose in 2021 when meme stocks became the hot thing. At the time, the federal funds rate was 0%, the Fed was pumping $120 billion into the economy on a monthly basis, the majority of the population was on couches due to lockdowns, and stimmy checks/PPP loans were circulating alongside enhanced unemployment benefits. The environment was prime for speculative excesses and liquidity made its way to some of the riskiest segments of the equity market. But today’s central bank rate is 5.5% and the Fed is shrinking its balance sheet while direct fiscal support to households has abated on a relative basis; how can investors shift their seat on the Titanic and now dance on the upper deck of meme stocks with such a financially restrictive landscape?
The answer is that the stimulus from 2020 and 2021 was so abundant that the tightening in 2022, 2023 and 2024 hasn’t been enough to counter it. For context, the Fed added $4.8 trillion to its balance sheet during the pandemic but has only allowed $1.6 trillion to come off since its 2022 peak. Another consideration is the speed at which the central bank comes to the rescue when volatility emerges, with March 2023 featuring a $400 billion addition to the Fed’s assets during a time in which quantitative tightening was interrupted as a result of regional bank trouble. Its bloated balance sheet, perceptions of the Fed helping as soon as there’s trouble and patience on the inflation front are large drivers of today’s easy financial conditions which lay the foundation for Meme Mania 2.0. Indeed, financial conditions today are much looser than in 2022, when rates were at zero. The late folk singer Harry Chapin once sang “the iceberg’s on the starboard bow, won’t you dance with me” and today we could be sailing to an icy hazard with the Fed once again making the mistake of waiting too long for inflation to reach its target. Former Fed Chair Paul Volcker remarked that the real danger of monetary policy comes from “encouraging or inadvertently tolerating rising inflation and its close cousin of extreme speculation and risk taking, in effect standing by while bubbles and excesses threaten financial markets.”
He sounds like a kindred spirit to Wolfstreet… even though he is an economist at a major brokerage firm…
It looks like these numbers are going to look great and no meaningful correction in housing for at least a few years until the unemployment numbers start going up
It’s hard to say, but Wolf’s had some articles on how housing and rent costs have fallen in some of the very very bubbly markets, and inventory has been going up fast. And there’s another “x” factor here that wasn’t present in 2006, no we don’t have huge subprime loans like then, but much more severe weather with so much higher housing costs mean homes are a lot harder and more expensive to insure now. The homeowner’s insurance crisis may not be a “black-swan” classically but it wasn’t something really considered much in real estate a couple years ago.
Farmers Insurance has already pulled out of Florida and other insurers following suit, many parts of California are seeing insurers pull out and this is becoming common even in other areas of the country where weather poses a much greater threat of massive home damage, force insurers to cover so much more at these prices. There’s even big growing movement of wealthy Americans out of the US go expat, Bloomberg and the others have been full of articles on this lately. And the charts may be showing low delinquency around 2% as of latest measure, but the trend-line is showing a pretty fast increase in delinquency and serious debt, and it shot up scary fast in 2006 when it last started increasing to sustained level. We can’t stimulate our way out of a crisis like in 2008 or 2020 before with inflation such a constant threat now, commercial real estate in serious trouble and, then there’s also the unknown BNPL debt levels. Not easy to predict, but a lot of things point to potential corrections especially for the housing bubble in the most bubbly markets.
There will be some nice rent increases in my area later this year and next. Two cities next to me each raised property taxes by 40% this year. Insurance in the area is up 15% to 20%. Based on market numbers for my area, those increases eat up 1 month of rent which comes to 2 months of rental profit. So I am guessing between now and end of 2025, many rentals in my area will see a 10% to 12% increase in rent. Will they be able increase the rent that much in one shot. Maybe not. They may try to spread the increase over a couple of years.
If I know landlords:
They will definitely make the lump sum increase. (Sounds like 12-15%+).
I remember several years back being faced with a potential 10% hike on a lease renewal after 2 years.
No major cost increases, just a feeling (and reality) that they could charge a higher price.
The scary bit: Credit card debt is NOT interest rate sensitive. Who do you know who puts merchandise on cards not intending to pay at end of month, does an NPV analysis when they do that? No-one!
Car loans are likely not interest rate sensitive either. Mortgages very much sensitive.
Car sales are somewhat rate-sensitive. But only about 40% of used cars are financed. So it doesn’t impact the other 60%. 80% of new cars a financed, but lots of it is leases to people with money, and they don’t really care. In addition, the captive lenders are offering special financing rates, including Tesla now. So it’s hard to resist 0.99% or 1.99% financing. The picture that emerges is pretty complicated.
Credit cards are the #1 payment device in the US. Most people just use them to pay for stuff and then pay off the balance by due date. So they don’t pay any interest, and they don’t care if the interest rate on their card is 35% because they never incur that expense. There are some people who buy a big-ticket item on their credit card and pay it off within a few months. They don’t really care either because the interest expense is only for a few months. And they rotate through the population. The people that do care are those that have permanent balances on their credit cards that they cannot pay off. But those rates have always been very high, especially if their credit is not pristine. So if it goes from 29% to 33%, it’s just another bump on a very rough road.
It would be nice to see these charts go back another five years or so to see if there is a trend (dot-com, financial crisis), especially for 30+ and 90+ delinquencies.
The sudden ramp up in 30+ day delinquencies from a visual on a chart standpoint is looking eerily similar to the onset of the GFC.
The charts go back as far as the data goes. Take it or leave it.
Yes, I understand. It wasn’t a dig at you, Wolf. Just noting that it would be interesting to see.
If you want to study ancient history, there are places for it, not here.
Household debt humming along fine, government debt rocketing upwards. Proof that inflationary pressures aren’t going away any time soon unless government expenditure goes down. That or interest rates go high enough to cause a recession. Then the debt figures will start to look very ugly for everyone.
I’m interested in how well below average interest rates to banks, corporations, and the consumer the last 30 years, with a constant increasing Federal spending didn’t fit into your prove positive?
We are a cargo cult that is looking for that great printer in the sky to rain down on us and reign over us.
I’d be interested in what a breakdown of that debt/disposable income looks like broken down into age brackets.
Dividends and interest are up big and skew toward the older and wealthier. Wonder if that’s enough to hide some problems for the younger and middle age folks?
Younger people always borrow more (buy vehicles, equip the new house, redo the kitchen, etc.), and are more likely to fall behind, which is part of the learning process. And as they accumulate wealth, they reduce their debts and usually pay off their debts when they get older. No one wants to retire with a shitload of debt. It has always been that way. You just don’t know it.
Don’t retire with debt, just make sure you die with a massive load of debt. It’s the fun way to do it.
That’s my plan at least.
This sound funny, and we get a good laugh out of it, but it is terrible advice. Unless you have an etched-in-stone one-gun-one-bullet plan, or a severe health condition, you don’t know your freeze-by date. You might live to 105, spending the last 30 years in abject poverty.
It’s going to be many years before these trends and price levels get back to where they were before… normal.
Until then, stocks, real estate, and all other assets should continue their bull markets – at least until the next purple hippo (black swan /s) event turns everything upside down
I’m surprised that mortgage debt ticked up. With the collapse of cash-out refis and lower sales volumes, I’d imagine that the principle payments on current mortgages would be more than net new mortgage debt being taken on. But apparently not.
I look forward to your breakdown of this segment of the debt picture!
Remember a good chunk of the monthly payment pays the interest.
I have a boss who has an ARM on a $7M house that’s starting to cause him some consternation. He’s worth >$20M, so won’t ruin him, but I can’t bring myself to ask “why the hell didn’t you refinance into a 3% interest rate???”
I do after all want to stay employed.
Have you asked him when he thinks interest rates are going to come down (and by how much)?
I would be fascinated to hear his answer.
I know what he will tell you: “because 2.9% was a better deal” 🤣
lol, what scares me is whether the current buyers will turn out to be right to buy at these prices, because in a year or two the current prices could look quite reasonable
Great to see everyone flourishing and living the American dream of consumption, keeping the economy going strong. The system runs on debt and credit, keep your nose clean and you can get anything you ever wanted. U can also file bankruptcy and comeback from it several times. Congress members still living lavishly from the individual PPP loans. Greed is good, prices are always imaginary, young folks now is the time to take advantage of leased vehicles deals, leased housing/rentals, and traveling abroad for peace of mind. The traditional rat race has changed, having less revolving debt is freedom from the matrix. The basic fundamentals of the good ole shit, shave, and shower have not changed.
Does the total debt include or exclude the student loan debt all the way back? I looked at a chart and it hasn’t risen in the last few years and almost none of it is considered delinquent.
This is from NBC News “Educational loans have risen from 12% of debt in 2003 to 36% in 2022. Note that mortgage and other home-related debt is not included in this chart.”
Has this major part of overall debt been nationalized? If debt that is about equal to the total auto debt is wiped off the books doesn’t that affect how people are now able to better pay the rest of their debts?
I don’t consider student loans “loans” anymore. They no longer have the characteristics of loans. Everyone expects them to be forgiven. Lots of them have already been forgiven. Nothing is counted as delinquent. People who aren’t making payments don’t face negative consequences. This whole thing has become a sad joke about how not to do something.
Under these conditions, the delinquency rate is 1%, down from over 10% before the pandemic. I don’t think any government-backed student loans are counted as delinquent, only private loans.
In terms of delinquencies without student loans, we’ll get to it category by category. Here is housing debt, hot off the press:
https://wolfstreet.com/2024/05/14/household-debt-delinquencies-collections-and-bankruptcies-the-free-money-era-is-over-for-our-not-so-drunken-sailors/#comment-587155
Good points Wolf. I am sort of just daydreaming or thinking out loud. But what will be the next category of debt the government owns that people will believe they do not have to pay back?
Hmmm…….it may be far fetched but…….. housing? That would be anyone with a GSE backed loan? It happened during the pandemic….could it happen in a recession?
I live in Canada. I made double the money on my investments last year than I made in all but one year of my working life (the last). Most of that was on the back of government spending getting dumped into the markets (Canada and US) one way or the other. That debt spending will have be paid off mostly by people who have way less access to these profitable investments than I do. There is something seriously wrong about that.
I wonder if there is somewhat of a correlation between the Heloc balances increasing and cc debt decreasing.
A friend of ours is a lender with Sun Trust and she said business has been good as people are using the equity in their homes (see Wolf’s recent article) to pay off high interest rate credit cards.
Not sure if there is enough of that to move the needle but I was happy to hear her job is not in jeopardy.
The dip in CC debt was likely seasonal. Before the pandemic, it always dipped in Q1. The pandemic changed that (stimulus in Q1s etc.), but now it seems, data is getting its old seasonality back. I’m going to discuss this more in my article on CC debt.
I’m really curious how disposable income is going up. I sure as heck didn’t see a raise last year that kept up with inflation. I don’t know anyone else that did either. Maybe those with savings paying high interest rates?
Then you need to get a new job with a better employers, maybe in a different location with a thriving bunch of employers. The loyalty tax applies to employers too. Sometimes they will not give you a raise until you get ready to leave. And sometimes you have to leave to get a better paying job. If you didn’t get a series of big-fat raises, you got screwed and you should have left two years ago.
The other problem you might have encountered is that your productivity was lacking, and/or that you’re near retirement, and your employer is happy to see you go. If you don’t get a raise over a few years during inflationary times in a hot job market, there is a message (written in bold italics) in that.
Salary is not the most important.
Working conditions are important!
Personally, I prefer not to have an increase, but to work from home, which I do.
I also don’t have bosses to pester me on a daily basis.
I can start and finish work when decide. I don’t have a constant workload.
I also saved the company car and gas costs by not having to commute to the office.
I also have 30 days paid annual leave.
I see my boss once every three months and hear him on the phone no more than once a month.
I work for a bank as a software developer. Raises were decent until the last cycle. They bought out another bank and we all got screwed. Considering that no one I know really anywhere is getting much of a raise though, I can only assume that most people are quitting and finding new jobs. Companies keep saying they are preparing for a downturn.
A ‘real chart’ would be one that displays the aggregate sum of household debt PLUS government debt, charted over a century, and superimposed on which the recessions and wars. The debt monster has merely moved from his house in Consumerville to his summer home in Governmentland. While enjoying holiday, the debt monster isn’t earning anything. The FED is broke. Mr debt monster needs to go back to work. When he does, all the charts change and fast.