Leery investors?
During the ugliest October in the stock market that anyone could remember, a nasty November, and a brutal pre-Christmas December, margin debt plunged by $94 billion, the deepest three-month plunge since Q4 2008, after Lehman Brothers filed for bankruptcy. That’s how it usually happens, whether out of fear or forced selling via margin calls: When the stock market plunges, margin debt plunges with it, either resulting from the stock market plunge or adding force to the stock market plunge. But since December 24, stocks, junk bonds, leveraged loans, long-dated government and corporate bonds, and many other assets have skyrocketed. So, has margin debt surged with it?
Nope. In March, margin debt ticked down $7.2 billion from February, to $574 billion, according to FINRA, the non-governmental organization that regulates member brokerage firms and exchange markets. This follows two upticks in January and February. Margin debt is down $71 billion, or 11%, from March 2018, and down 14% from the peak of $669 billion in May 2018. But the moves of the three months combined are small compared to the prior plunges:
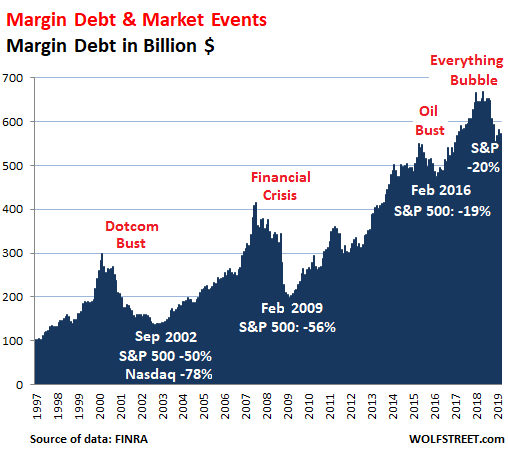
With a long-term chart like this, the dollar amounts are less relevant since the purchasing power of the dollar has dropped over the period. What is important are the movements, and how they relate to stock market events (indicated in white).
Over the longer term, there is a tight relationship between stock market surges and sell-offs and margin debt. Stock-market moves and margin debt feed off each other on the way up and on the way down, and there can be a lag between the two, with one coming before the other. Margin debt is not a predictor of the direction of the stock market, though high margin debt levels indicate that when stocks do fall, they tend to fall sharply.
There are many forms of stock market leverage, but “margin debt” – the amount individuals and institutions borrow from their brokers against their portfolios – is the only form that is actually reported on a monthly basis.
Other forms of stock market leverage include “securities-based loans” (SBL) that brokers extend to their clients (some brokers report the balances in their annual reports but they don’t have to), loans at the institutional level such as with hedge funds, loans by companies to their executives to buy the company’s shares, etc. So overall stock market leverage is far larger than margin debt, but no one really knows how large.
But reported margin debt gives us a feel for which direction overall stock-market leverage is going. The chart below shows just how steep the year-over-year plunges have been, the steepest since the Financial Crisis:
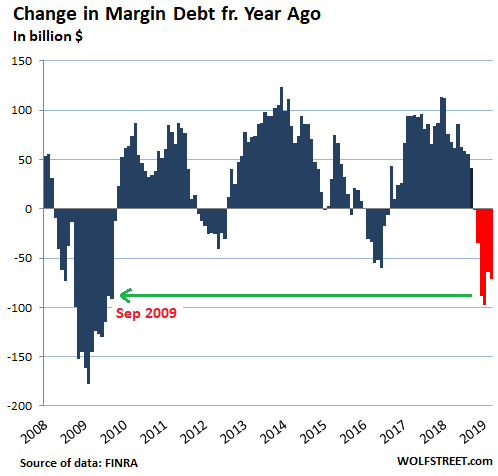
Stock market leverage is an accelerator when stocks go up as investors borrow money to buy stocks. And it’s an accelerator on the way down when margin calls and the fear of margin calls turn investors into forced or motivated sellers.
Despite the wind-down of margin debt in Q4, stock market leverage remains high – at about the same level as on the way up in March 2017. And for now, even as the S&P 500 is closing in on its September 2018 high, investors – perhaps still leery – have not jumped with both feet back into leveraging up their stock portfolios to the max.
Enjoy reading WOLF STREET and want to support it? You can donate. I appreciate it immensely. Click on the mug to find out how:

![]()
Here is another good way of charting the margin debt – as resulting credit balance vs. sp500, that is from mid March…
https://www.advisorperspectives.com/images/content_image/data/d1/d11aa5a235d17cc42c11106dcd27a02e.png
…it speaks for itself I think.
Bankers,
That is an ugly chart. It speaks of a debt bomb explosion of massive proportions. And it shows just how much of the stock market recovery since 2010 has been fueled by debt from the Fed bubble
Cool graph! Thanks for sharing.
It is, and thanks for thanking. It is more a coincident indicator, in that margin debt moves in tandem with market price….but it also supports the price to an unknown degree and adds a lot to volatility in a negative direction – when the stock market goes down leverage dissapears which is self reinforcinh , so that is what helps markets to crash. When the market is going up it just seems “reasonable” to fill in the prices with that leverage which gently supports the trend also , but when it goes down the tendency is more each for themselves and a rush to exit. It does seem to peak a bit before the crashes, but you can only see the proper peak a while later so I don’t think it serves as a clear indicator. It would be interesting to know how much it adds to market cap, but I think all the prices and sentiment are so interwoven in finance that you cannot extricate just one and say that is what it represents. Either way, that debt is so historically high on the SP500 it should at least remind people of the word “contagion”.
Not sure you’d see the margin debt on a chart of market cap instead of the index.
I am aware of that , but markets don’t work quite like that either, with margin debt you are looking at the faster margins tailored to a fast traded market, but the whole financial system, including sp500, can be looked on as one big margin of derivatives, and I would say you as well as myself or anyone else don’t know fully how they interact. How much leverage outside of SP does that 300bn also hold for example, or in terms of market sentiment – we have to guess I think.
Here is a maths experiment for you. A company has a thousand shares at one dollar, someone leverages a thousand dollars and buys one share at that price. What is the market cap of that company afterwards ? What percentage of market cap is that thousand dollars of margin debt ? Small no ?
I honestly do not know the effect of leverage and debt on prices, I think “a lot”. Add to that that the above is only a fraction of leverage in the markets, there are many other kinds. I don’t know if on the way up the above leverage is catching dips and setting the upwards trend, bringing confidence to the wider market, adding liquidity in a form that generates its own form of arbitrage. All I know is that that part of the market can liquidate very fast and that it will have a far greater effect than it appears to have in nominal terms. The size of that debt in nominal terms is also very large now, and that does say something in itself of how debt is generated using a simple index, how easy lending is, how that might reinforce itself until the figures become ” quite important “. I am just using my senses here, I am not a technical analyst and so I do not feel constrained by that form of viewing events. There are plenty of analytical views around and I won’t be the one to stop anyone following them.
I thought DSHORT was the data tracker for the group:
https://www.advisorperspectives.com/dshort/updates/2019/03/24/margin-debt-and-the-market-up-2-25-mom
Yikes!
That chart is clearly beyond ugly.. Humans are pretty crazy. The number of Whimpies wanting to pay for something they can’t afford to be repaid with money they borrowed from someone else.. Just amazing.
Wolf – I love your blog and have started reading it regularly. Sorry if you’ve covered this previously, but what sort of asset allocation do you take in this sort of market ?
I very recently (2 weeks ago) have gone about 75% into a basket of bond funds and only really keep hold of European and emerging market equities. I watch all of the important economic measures and hope over the next 1.5-2 years there is a moment of peak pessimism whereby I can buy back in. I don’t understand this market anymore and by pretty much most metrics it is highly overvalued . What do you think ?
Financial advisors charge an arm and a leg to give you answers on this type of question, and you want me to do it for free? Sheesh :-]
It’s the Fed’s job the make the stock market to always go up. Haven’t you heard?
Don’t take Wolf’s flippant answer personally. Welcome to the blog but Wolf doesn’t give portfolio advice. But there are many on this blog that do occasionally provide nuggets of information. For example, brokered CD interest rates have risen recently and some fixed income investors (along with Wolf) suggested laddering CD’s. But the uncertainty of stock market and being completely disjointed from fundamentals makes stock investing very difficult at this time. Again welcome!
On second reading, it was “flippant.” It seems I could have said it in a more welcoming manner.
No Wolf, the macro guidance you and others give help all of us see which way to go.
That’s not the first time that type of question is asked, nor will it be the last. They either grow up or get out, if that’s all they came for.
Often I think about the incredible amount of digging you gurus do. The rest of us have it easy, and are able to see the big picture because of what you do.
Nah, you just warned David about financial advisors…just have to hope NAPFA don’t come calling now is all…given the fee sheet.
OR…When only 9% of the US population owns stocks and even those stocks are traded/aggregated in the hands of a few institutions (401k, etc) …so then it is not really a stock market, it is more like a “funny market” and it is completely OK buying into it because there is no one left to sell…:)
DH, Worth the time to do considerable due diligence on the bond funds. Some suffered runs in the last cycle. Lots of past content and comments on this topic.
So many “indicators” pointing to a severe stock market correction and recession to follow.
But these true blue indicators have been wrong for the last five years….
Cuz the Fed keeps this bubble going by continuing to inflate it. Already people forget the last time the Fed tried to undo QE in 2015 and we got a minor stock market blip which caused the Fed to reverse course.
Much the same is happening again, with the Fed in “patient” mode, except now inflationary pressures are looming.
The Fed is caught between a rock and a hard place. Keep rates low and the debt bomb bubble gets ever bigger, and inflation sooner or later rises, or raise rates and pop the bubble and watch things crash.
I predict the Fed will not raise rates any more, the bubble will keep growing, and something else will eventually trigger a huge debt bomb explosion. Something always does. The world geopolitical situation is more unstable than it’s ever been since a foreign policy amateur newbie American president almost set off a nuclear war with the Soviet Union in 1962
The only question left is whether the debt bomb goes off before or after the 2020 elections. This will have major ramifications as to what gets done afterwards.
Patient mode killed the 2Y coupon yield at today’s auction.
Gandalf is on the mark.
The longer the “ amateur politicians” control the rudder, the more ( BAD energy is allowed to be stored in the system).the release of which will not be pleasant.
The Geopolitical games being played by Trump will have ( Dire) consequences for the US and accelerate the demise of the greenback.
military power alone cannot guarantee Japan, and the EU solid source of Energy,
CHINA and INDIA will go their own way to guarantee their population enough supply of Energy.
The whole premise that you can run the world according to your whim, and force energy suppliers and consumers to share a specific rules set by ( an Economically challenged country) is but a dream.
Your only hope left to FORCE your agenda is to occupy SA. , and start another war in the Persian gulf!
…a scenario that I might add seems approaching rapidly.
With that you can ;
– reset your Economy.
– blame ( some other rouge for your problems)
– guarantee cheap Energy for the next 20 year ( Vital for the transformation to a new type of energy?!)
This also give Jesus ( Musk) ! enough time to solve his Battery and software problems! :)
so what can Wolf advise a reader like David in such a calamitous situation?!
Go hide in the mountains till it’s all over. Cheers! :)
The internals are strong, esp the A/D line, people are buying this market. The nature of the price action suggests not speculation but monetary underbidding. This is not a bull market, it lacks any of the characteristics. Money flows into this market, regardless. The sellers sometimes pushback, but the mentality of the seller is to get the best price, if you inclined to sell in this market you wait. The source of this money is heavy handed stimulus in China, in part in order to get a trade deal, and in part to step in and capture global market share for exports while the EU and Japan have a slowdown. China doesn’t care about excess inventory or even price. Re Money flows, Doug Noland wrote a nice piece on The Perils of Stop and Go, once China gets a trade deal, or not, they will pullback stimulus (probably) and the money flow will slow, and sellers will hit the bid. The Swiss figure in this they outsource manufacturing to China, print money to depreciate their own currency, and buy NYSE stocks for the SNB.
the SNB is certainly a crazy hedge fund but only holds about 80B$ in shares while the S&P is today valued at 27,700B$ so I can’t see that being a major issue. Even if they sold it all it would make no difference – except for the panic it would unleash.
What doesn’t kill makes you stronger?
It’s good to shed off leveraged speculators and margin callees once in a while.
A key question is, who is issuing the loans to buy stocks? Traditional banks? Financial investment houses like Goldman Sachs?
Cuz if the stock market falls, their loans default, and if enough defaults happen we get another GFC again
That’s why Glass Steagall was passed after the 1929 crash
In the US stock margin debt is mostly issued by non-bank lenders: companies like the Florida Mortgage Corporation are very active, especially given how retail-driven the US stock market is. In countries like Australia and Hong Kong, however, large banks are the main players.
Margin debt is basically self-feeding: the higher stock valuations, the larger the loans needed to buy stocks, but at the same time extreme stock valuations offer good collaterals… you get the idea.
However if we consider stock-backed loans (SBL) and stock-backed lines of credit (SBLOC), large US banks are prime players, with Wells Fargo and Morgan Stanley being extremely active. I am unaware if these banks keep SBL on their books or package them in securities and make them somebody’s else problem.
Note that SBL and SBLOC are not necessarily used to buy stocks: for public companies with crazy stock valuations and not so crazy financials (cough… Tesla… cough…) they are a great way to finance operations.
Of course there’s always a risk: while stock markets as a whole keep on rising and rising (that’s why if you have no time to “play stocks” but really really want a piece of the action it’s a good idea to consider investing in a “dumb fund” linked to the index of your choice; do this at your own risk of course) individual stocks do get bludgeoned.
Norwegian Air Shuttle (NAS.OS) has gone from NOK172 to NOK39 in exactly one year. People who bough last year at the peak betting on a IAG buyout have systematically lost money, even more so if they used as collaterals their crazily valued NAS.OS stocks instead of their whole portfolios.
One also has to be wary of false rallies. Former financial media darling GoPro (GPRO) has been using all the ex-GAAP tricks in the book to boost shares by over 50% to about $6. But the latest SEC filings warn GoPro expects sales to be 15% lower in 2019 than they were in 2014, confirming a long term trend: this company is actually dead in the water, and saddled with debts to boot.
The market for action cameras is completely saturated and I am sure I am not the only one who cannot take any more links to YouTube videos of people riding around horrible roads very slowly while blabbering continously. Dash cameras are useful for insurance purposes (where legal) but for the rest they are just a fashion statement.
People who rode the rally had better cash out, pay off their margin loans and enjoy the profits while they still exist. I learned the hard way what it means keep on saying “These stocks have been doing so well, they’ll keep on doing great for a while so let’s just watch the value grow up”.
The central banksters will probably try to put humpty dumpty together again. They and everybody else are incredibly good at denial. It was impossible to see it coming etc…
I think Harry Dent has the best handle on this, when real change will happen in the world, but not without an even more severe and long lasting crisis for the whole world first, later in this century.
Isn’t margin debt partially secured (or collateralized) by what they purchased ? So in case of a crash, it will be dominoes falling.
Whether it is BIG enough to cause a Finanacial Crisis is doubtful.
Love your stuff on here but is the first chart not a bit meaningless? Of course the debt growth will look huge if in pure $ terms, so would stock market cap. Is a better measure of leverage debt to equity or EBITDA?
What “meaning” are you looking for? The meaning of life? Just kidding…
The meaning the article said the chart shows are the trends, not the absolute numbers, of how margin debt plunges during stock market events.
In the Alice In Wonderland market, low margin debt means it has room to expand.
Central banks do not buy “on margin”.