But the US shirt is getting dirtier. Germany’s manufacturing data “makes for uncomfortable reading.”
Much of the glowing press coverage today was focused on the uptick in manufacturing data coming out of China, as reported by the Caixin Manufacturing PMI (Purchasing Managers Index) and the Official Manufacturing PMI, both of which returned to (feeble) growth mode, after having been in contraction mode since November.
We will get to them in a moment. But what got less coverage were the other PMI’s that were also released today, including those of Germany, the US, and Japan. And what is happening in Germany and Japan put China’s upticks into a different light – with the US remaining the cleanest dirty shirt that is now getting dirtier, so to speak.
Germany: March “makes for uncomfortable reading”
For all these PMI measures, a value below 50 means “contraction,” and a value above 50 means “expansion.” The IHS Markit/BME Manufacturing PMI for Germany plunged to 44.1 in March, down from 47.6 in February, the lowest level since July 2012 near the bottom of the euro debt crisis.
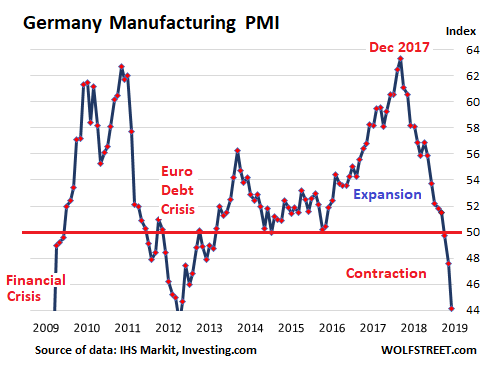
The report highlighted “a sharp and accelerated decrease in new orders,” with total order books and export orders falling at the fastest rate since April 2009. The reasons spanned the spectrum of “uncertainty surrounding Brexit and trade tensions, a weak automotive sector, and generally softer global demand.”
Manufacturing backlog of work fell as “the fastest rate since mid-2009,” as manufacturers ate up their backlog to keep their factories running.
Employment fell across the sector for the first time in three years: “The decline was only marginal, but it nevertheless contrasted with solid rates of job creation in prior months.”
This manufacturing data for March “makes for uncomfortable reading,” the report mused. “Both total new orders and export sales are now falling at rates not seen since the global financial crisis.”
PMI measures are based on surveys of industry executives whose names and companies are not disclosed. These “panelists” are asked to rate various aspects of their business – new orders, new export orders, employment, backlog, inventories, supply chain delays, input costs, etc. — by whether each of these aspects is increasing or decreasing. Their responses form the sub-indices, which are then combined into the overall headline index (the basis for these charts). PMIs are a boots-on-the-ground view by executives about how their company is being impacted by economic developments.
Note: I put all PMIs below in the same index scale as Germany’s, from 44 to 64, to allow for easier comparisons of the magnitude of the changes taking place in each country.
Japan: manufacturing sector “in poor shape”
“Japan’s manufacturing economy ended the first quarter in poor shape, with weaker demand pulling production volumes deeper into contraction,” a the economic backdrop for manufacturers “remains fiercely challenging,” according to the Nikkei Japan PMI. At 49.2 in March – slightly up from February, which had been the lowest in 32 months, the index remains in contraction mode, “thus signaling a further slowdown.” It “rounded off the worst quarterly performance in Japan’s manufacturing sector since Q2 2016” (I put this chart on the same index scale as Germany’s, from 44 to 64):
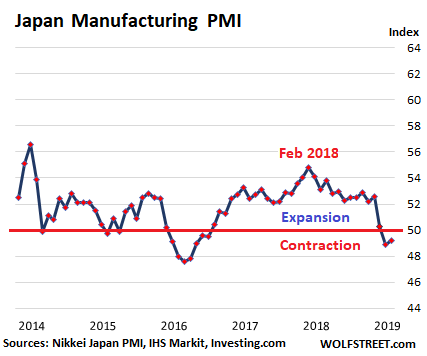
New domestic orders and new export orders fell further. The decline in export orders was blamed on “weaker foreign sales to Chinese and Taiwanese clients.” Given the decline in orders, production volumes were “cut across the Japanese manufacturing sector for the third straight month” – and though these cuts were “only moderate,” they were “the sharpest since May 2016.”
The outlook “remained underwhelming in March,” bogged down by “global trade fears, the impact of the incoming sales tax hike, and weaker growth in China.”
China: hopes are focused on the government.
The Caixin China Manufacturing PMI ticked up into expansion mode (50.8) in March for the first time since November, with companies signaling “slightly quicker rises in output and overall new work,” and employment increased for the first time since October 2013. Production rose for the second month in a row, “supported by a stronger, albeit still relatively muted, rise in total new work.” But purchasing activities continued to contract (I also put this chart on the same index scale as Germany’s):
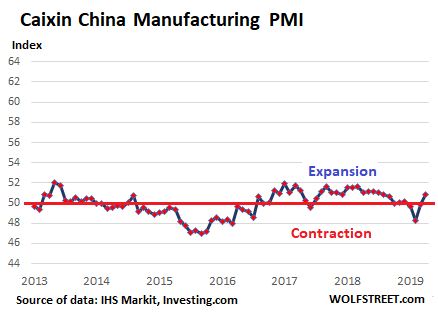
And the report commented about what really mattered (emphasis added): “Overall, with a more relaxed financing environment, government efforts to bail out the private sector and positive progress in Sino-U.S. trade talks, the situation across the manufacturing sector recovered in March.”
The official China Manufacturing PMI, released by China’s National Bureau of Statistics, also squeaked into expansion mode (50.5), after having been in contraction mode since November. “The pick-up in manufacturing expansion came as factories resumed production after the Spring Festival holiday,” the sate-owned CGTN reported (I also put this chart on the same index scale as Germany’s):
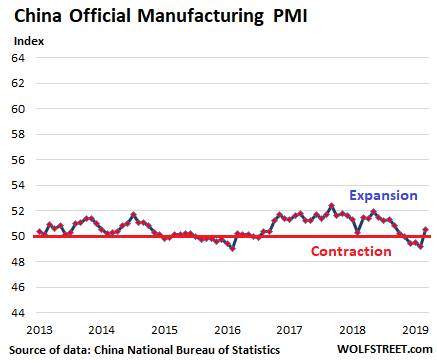
Some sub-indices turned positive, including production (52.7 from 49.5), new orders (51.6), and purchase volume (51.2 from 48.3). And optimism became even stonger as the “expected production and business activities index” rose to 56.8.
But other indices remained fairly deeply in contraction mode, including new export orders (47.1), in hand orders (46.4), the import index (48.7), and the employment index (47.6).
Then there was the division by size: the index PMI of large companies, at 51.1, was still in expansion mode. But the index of small companies and medium-sized companies remained in contraction mode, at 49.3 and 49.9 respectively.
The US: Cleanest Dirty Shirt
The IHS Markit US Manufacturing PMI dipped to 52.4 in March, the lowest reading since June 2017, and “notably softer than the trend seen for 2018” (chart on the same index scale as Germany’s):
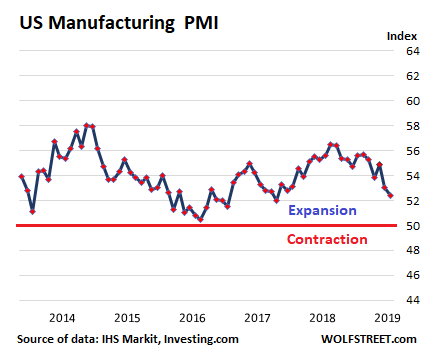
Output expanded at a “marginal pace that was the weakest since June 2016,” based on “softer underlying client demand.”
New order growth “has fallen close to the lows seen in the 2016 slowdown.” Export orders rose only marginally, “with firms noting that global trade tensions and the ongoing impact of tariffs had dampened foreign client demand.” The index for backlogs of work dipped slightly into contraction mode. But the employment index “rose at a solid rate.”
“A further deterioration in the manufacturing PMI suggests the factory sector is acting as an increasing drag on the US economy,” the report commented. And “things may well get worse before they get better, as the forward-looking indicators are a cause for concern.”
So in this snapshot of the four biggest manufacturing powerhouses in the world, German manufacturers are as gloomy as during the euro debt crisis and very nervous; Japanese manufacturers are worried by the ongoing slowdown; Chinese manufacturers are counting on the government to provide “a more relaxed financing environment” and “bail out the private sector”; and US manufacturers are in weakening growth mode – the slowest growth since 2016 – and for now, the cleanest dirty shirt that’s getting dirtier.
But the US service sector, which is far larger than the manufacturing sector, is for now keeping overall economic growth afloat because there cannot be a recession without a pullback in services. Read… Finance & Insurance Hit it Out of the Ballpark, No Slowdown in the Huge Services Sector
Enjoy reading WOLF STREET and want to support it? You can donate. I appreciate it immensely. Click on the mug to find out how:

![]()
What’s happening now is almost like a reverse of what happened in 2008.
Back then the Dolllar was weak and the US economy started to weaken before Europe and Emerging Markets. I have no clue why.
Me neither.
Just don’t understand what can possibly be going wrong.
All most confusing.
Europe had already got itself into a state by 2008 (took half a decade of Euro to do that and periphery countries i.e. UK were all tied into the feast) as revealed by the last ten years on the toilet. So US was just the first to fold at higher level (financial). Why the US first? Look at oil prices and their influence on the US economy ( consumption of, price paid for end products due to consumer position). EU was in a similar position as well though, which is why the house of cards came down so fast, the EU had finished a nice big credit cycle of low rates ( for traditionally higher rate south), similar to how the US subprimed and Heloc’d etc. This all knocked through to suppliers ( China, Saudi, etc.).
Now what is happening is that “we got shale boys” and “let’s rearrange this sh*tshow” , the US sorted out its housing across the whole economy ( fixed interest low rates, new market remaining tight though simply because people will bet on a surer thing) , it pumped in dollars (sorry students you will learn) and overall levelled off better than EU. Germany is productive EU, EU is in the dumps, so China is in the dumps, so Germany is in the dumps, so EU is in the dumps, so….
So the question is does EU fold now, or will it be China which is missing EU market, or will they tie up at the expense of US in terms of influence, or will this all go some other weird and wonderful way ? There are plenty of lesser sideshows around to give a jolt to events ( Turkey, Brexit, elections, south China sea etc. etc.) . Big stakes and people wondering if they really want to be tied to them.
At least that is how it looks to me.
China is a command economy, they see weakness in Europe and Japan they step in, so what if they get stuck with excess inventory?
“The best horse in the glue factory” ?
The Chinese IP& PMI moved up, but when China came back
from their national holiday, Oct 1st to Oct 7th 2018, the dragon
swallowed the Shanghai stock market (SSEC), opening two gaps and on
Oct 11 2018, the Shanghai stock market lurch down, under the
Jan 25 2016 low @ 2,638.30 ==> officially entering a Bear Market. Remember the notorious day Oct 1st 2018 on the DOW, the NASDAQ, the DJT…..
The global markets are in a grave danger because of China.
If China (PBOC) can resort to devaluing it’s currency (CNY) as it did repeatedly in the summer of 2015, then any market sell off should be short lived.
These days, when i think of global dry powder on a massive scale, i think of China. Both it’s HH debt and it’s Govt Debt/GDP are lower than the USA … and the USA is the cleanest dirty shirt, as is mentioned lately.
China still has a ways to go before it becomes as zombified as Japan.
No gov’t wants to report their economy going to hell.
That’s why i believe germany and japan’s numbers. Because they have no incentive to lie.
I *barely* believe the US numbers because i don’t think our statisticians are as honest as we would hope.
I don’t believe any number China puts out. Why would i? Why would anyone?
By that logic only bad news counts, I take it that you are an optimist ?
However there are good enough reasons to lie to the downside. For example Germany does not set its own monetary policy, it has to convince the ECB to do that, or with UK pulling back from EU there are reasons to synchronise release of a slowdown. I could think of others.
I’m not saying anyone is lying, but just that any of this information should be approached with a degree of cynicism.
I agree with Cheyenne, China data is fabricated, no doubt given past behavior and the data itself, which shows little volatility versus the data from other industrial countries. Germany, Japan and US better indicators. Might want to follow S Korea and Taiwan also.
Note that the only government data in this selection of PMIs is the “China Official PMI.” All other PMIs are private-sector-only data, including the Caixin China PMI and the US PMI, and governments have nothing to do with them.
But dont the private numbers simply rely on those provided by the communist government anyway?
No. They rely on what the executives that are part of the panel are saying about their own companies. The names of the executives and companies are not disclosed, and so there is no PR angle to the data.
If they were fabricated they would be inflated to the moon. Who goes out of their way to fake numbers so horribly average and weak. The answer is no one. Take off the tinfoil hat.
A world of filled with excess. What low rates has brought.
Diversion : the Chinese PMI was trending down from the
2014 high to the 2016 low, while the Shanghai stock market
was rising up vertically, til June 15 2015, followed up by a vertical collapse.
From 2016 low, the Chinese PMI was rising to a higher high, in 2017,
while the SSEC made a lower high in July 2018.
“China Syndrome” might spread and infect the whole global economy
and the global markets.
As far as the US PMI … likely caused by the central bank monetary tightening. Now that the tightening has stopped and has been reversed, US PMI, which is a lagging indicator, should also reverse.
I make this prediction based on the recent US housing performance. The central bank policy reversal has lit a fire under US housing. On both the east and west coast, after after a real estate lull, bidding wars have returned on many properties. I have personally witnessed them in Boston, Los Angeles, and Seattle. Expect a jump in US PMI.
Is amazing how much of this “economix growth” was just hot air, look at China who is tightening things a lot because cheap US dollars are gone.
Sure Brexit did speed things up but it was still gonna happen as soon as the Fed rate hikes started.
Unlike the song you don’t need MTV to get money for nothing nowadays.
Other than guns, ammo, bombs and missiles exactly what does the USA ‘manufacture 100% for retail considering retail is the largest area of the ‘service industry’
Darned if I find anything I Purchase Made in USA. It’s China, Vietnam, Bangladesh and Japan with a sprinkle of the Philippines and Malasia, Taiwan, Mexico.
It seems that oil is considered manufacturing. I would call that mining and refining.
Also aircraft (Boeing) is manufacturing but isn’t exactly retail and they source around the globe mostly China. Same goes for our Japanese and Europeon friends. Most of their manufacturing has also been outsourced to various countries but their laws allow them to stamp the finished product as made in their homeland.
It seems the indispensable demockracy cannot make even the simplest toaster.
Anyone care to take a shot at this question.
Then if the question cannot be answered because most everything is made in a few low wage States,,, then,,,
What is the PMI good for other than self flagellation.
For example, the auto industry is a HUGE manufacturer in the US (though many cars and components are also imported). Auto sales are about 20% of total retail sales.
I have an issue overall with using money as the measure of industrial production. When I was a kid in the early 1970s, everything was measured in units (tons of bauxite, number of cars, bushels of wheat, etc.). When they say that the US is “producing” more than it did years ago, I say: where are the TV’s, refrigerators, shoes, microwaves, etc.). It is also important to note that per capita, production is unquestionably down. I am not just aiming this critique at the US, but at all industrial nations. Unless all the results are properly adjusted for inflation since 1973, then the claims about industrial “production” are just not valid.
Because so much of a finished product is produced in various places (countries), it’s hard to pinpoint where U S manufacturing starts and where it finishes.
You can still get production data, by number vehicles built, by plant, etc. But there are units that cost $20,000 and there are units that cost $100,000. So it’s not apples to apples either.
Pretty much knew many of the autos are ‘assembled’ in the US. The F150 Ford is now assembled in Mexico. Most of the various parts are manufactured off shore. How long can Americans keep up buying new autos with an average price north of 30,000 and the loan terms 5-6 years, some 7 years making $12 per hour? I suspect this buying spree won’t last much longer. Where I live there are cars in lots everywhere! Miles and miles of cars. Something tells me the sales are not what they are saying.
I was really referring to cell phones, Radios, TV’s, toasters, stoves, refrigerators, tools.
How can you have a trade war when you have very little to trade?
I suggest the economic woes of the West is caused by the production they exported to the low wage slave nations.
The financializing of the economies, Living off of usury etc cannot make for a real economy.
Just my 2c.
Ken,
I don’t disagree with the gist of what you said, but you wrote: “The F150 Ford is now assembled in Mexico.”
F-150s are built at these plants:
— Dearborn Truck Plant (Michigan)
— Kansas City Assembly Plant (Missouri)
— Kentucky Truck Plant (Super Duty version)
GM and FCA produce some of their trucks in Mexico, but only some.
US Software is sold worldwide.
PMI is a good “coincident indicator” according to
https://research.gavekal.com/article/us-manufacturing-leading-indicator
In other words it just tells of the actual state of the wider economy. I think services lag, and as in that article homebuilding is a forward indicator.
But it’s all flagellation as no-one knows much better what to do in reply except to go out and buy stuff till they can’t anymore :-/ .
The US manufactures and exports weapons of financial destruction. We export around the world financial products. Agree, so depressing we are now Japan in the 1960’s early 70’s a manufacturing joke.
I have Toyotas in the driveway. Would I buy an American car? no In the 80’s a must have was a chevy truck……sad
Make sure those Toyotas weren’t accidentally manufactured in the USA.
touche ;)
touche ;)
Anymore, I judge new cars by whether or not they include dipsticks for checking and refilling fluid levels. Pretty sad!
More “stated policy” weapons sales are going off the charts. 40 had this policy as well. Yes we are an oil exporting nation, though how we keep the price high (supply down) while boosting HY corporate debt remains to be seen. We seem to be headed for the mother of all deflationary crashes. China’s bump in PMI is just the push that a global economy buried in overcapacity needs. At the end of every war they destroy excess capacity, and financial expansion is a form of militarism.
https://tradingeconomics.com/united-states/weapons-sales
I’m a little confused as to why you’re using the ‘IHS markit PMI” ?
Most economists/traders use the USA ISM PMI, which showed expansion to 55.3% from 54.7 in Feb 2019. Hence the ‘green shoots’, market to the moon sentiment of the last few days.
I’m aware these PM surveys are ‘soft data surveys influenced by ‘mood’ of the purchasing manager’. My guess is that the China PMI data is suspect to the point of being worthless.
https://www.instituteforsupplymanagement.org/ISMReport/MfgROB.cfm?SSO=1
The Markit and ISM PMIs both track very similarly. They both operate on the same principle. Neither is better or worse. The reason why I use the Markit PMI in this series is so that I can compare it to the other Markit PMIs in this series. The ISM data is out there by itself.
The China PMI data is probably one of the least distorted industrial measures coming out of China.
This doesn’t necessarily mean bad news perhaps economic growth just has smaller expansion and contraction from here on out.
Empirical Evidence
Lets look at solid facts from the St.Louis Fed.
All Employees: Manufacturing;
February 2019 12,834
March 1946 12,545
Low point after the GFC February 2010 11,453
Over the long term (73 years) the number of manufacturing jobs has not shown any improvement. It has flat lined, even though the population has increased dramatically over that same time span!
The financial spin doctors and propaganda artists are busier than usual lately, touting the “huge” improvement in manufacturing numbers.
Really? I would not call adding 1,381 jobs in the last 9 years huge!
Some may think these numbers have been “cherry picked”. They are not.
You must go back 73 years to find roughly the same number of manufacturing jobs as we have today, even as manufacturers were divesting labor at the end of war production.
OutLookingIn,
Ever heard of automation, one of the reasons why much of the high-paying manufacturing jobs have disappeared? A modern factory today is full of industrial robots and other equipment that replace much of what human labor used to do. In a large auto assembly plant today, there may only be only 3,000 workers where there used to be 50,000.
However, in terms of manufacturing production, adjusted for inflation, “real” manufacturing output hit a new record in Q4 2018 and is up about 70% from 1987, also per St. Louis Fed:
https://fred.stlouisfed.org/series/OUTMS
Essentially what is depicted then: High paying jobs lost, labor savings and therefore higher profit margins to the corporations.
The only “up side” I see, is the 1% getting richer and what remains of the middle class being decimated.
Wake me when personal taxes begin trending down. Funny how MMT, QE, etc. offer nothing in terms of middle class tax relief.
OutLookinIN:
Shouldn’t your figures be multiplied by 1,000????
Example:
“February 2019 12,834……..12,834,000?
“March 1946 12,545……..12,545,000?
‘ because there cannot be a recession without a pullback in services.’
What happened to Service during the 2008 financial crisis, compared to manufacturing?
“Real Value Added by Private Services-Producing Industries” dropped by 3.3% (adjusted for inflation) from $10.49 trillion in Q2 2008 to $10.14 trillion in Q2 2009.
https://fred.stlouisfed.org/series/RVASPI
But that was a huge mess. A regular run-of-the-mill recession can occur when services growth slows down to a near-stall, and manufacturing growth turns negative. So once services growth slows to 1%, and manufacturing declines significantly, then there may be the first signs of a recession.
What I find most striking in these graphs is the enormous amplitude of the German PMI: by contrast the others are confined within fairly narrow bands. What do that say to you, Wolf?
Wondering about that too. For many German companies, and the state apparatus overall, exports are the lifeblood of business. And these folks get VERY nervous very quickly when something threatens exports. I think this explains the exuberance during good times, because their companies are booming, and it explains some of the fears and issues arising when exports drop.
The new orders data today was awful. Export orders are getting hit hard, and these companies depend on them. This is the risk when the economy is so dependent on running a huge trade surplus.