Rents plunge in Chicago & Honolulu, spiral down in New York, Washington DC, & others, but surge in many markets.
Across the US in August, the median asking rent for 1-bedroom apartments rose 2.2% from a year ago, to $1,209. For two-bedroom apartments, it rose 3.2% to $1,447. But national numbers average away the often-double-digit drama, up and down, that renters and landlords experience in individual markets, with rents soaring over 10% and even over 16% year-over-year in some markets, while rents plunged in other markets.
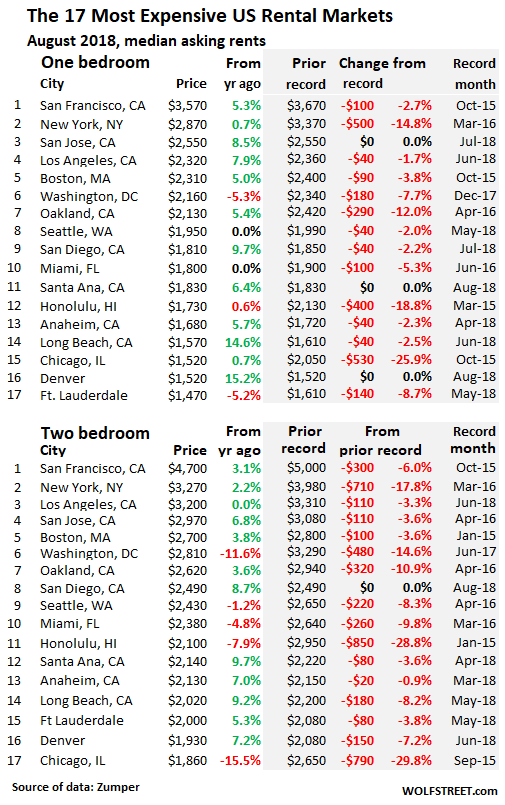
For example, in Southern California, rents are jumpy: In San Diego, the median asking rent for 1-BR apartments in August rose 9.8% year-over-year to $1,810; and for 2-BR apartments, it rose 8.7% to $2,490. In Long Beach, 1-BR asking rents jumped 14.6% and 2-BR asking rents 8.7%.
In 12 less expensive markets, rents jumped by 16% or more.
But some cities go in the other direction. In Chicago, for example, rents peaked in October 2015 and have since spiraled down 26% for 1-BR apartments and 30% for 2-BR apartments.
Every market has its own dynamics. Like many cities, Chicago has had an apartment construction boom. In the Chicago-Naperville-Elgin metro area, with 9.5 million people, 10,700 apartments are scheduled to be delivered in 2018. But Chicago’s population peaked in 2014 and has since dropped by 27,000 people. So a lot of new supply meets declining demand.
These are median asking rents. “Median” means half of the apartments rent for more, and half for less. “Asking rent” is the amount the landlord advertises in the listing. The apartments are in multifamily buildings, including new construction. But single-family houses for rent are not included. “Rooms,” efficiency apartments, and apartments with three bedrooms or more are not included. The data is not consumer-survey-based. It was collected by Zumper from over 1 million active listings of apartments-for-rent across the US during that month.
The data in Zumper’s National Rent Report reflects the current market as landlords are pricing it. But the data does not include “concessions,” such as “1 month free” or “2 months free.” In markets where concessions prevail, the effective rent for the first year of the lease would be lower than the asking rent.
No one tracks actual lease signings, and landlords do not report them. Only consumer surveys, such as those conducted by the Census Bureau, provide some survey-based insights into that, long after the fact.
The table below shows the 17 of the 100 most expensive major rental markets in the US. The shaded area reflects peak rents and the movements since then. The black “0%” in the shaded area means that these markets set new records in August. If rents are down slightly from the peak a few months ago, it doesn’t yet mean that the market has turned – a turning point would require a more significant decline in rents spread over a number of months beyond seasonality.
Some standouts:
San Francisco is by far the most expensive major rental market in the US. There are more expensive markets, including some towns in Silicon Valley, but these are too small to make the list. San Francisco rents peaked in October 2015. By late 2017 and early 2018, 2-BR rents were down about 12% from the October 2015 peak of $5,000. But starting in the spring this year, rents started rising again. At this point, they still remain below their 2015 peak.
Washington DC rents have suddenly come under pressure: 1-BR rents in August are down 8% from their peak in December 2017. And 2-BR rents have plunged nearly 15% from June 2017.
New York City, the second most expensive rental market, looks to be trying to find a bottom. Year-over-year, asking rents are up slightly but have fallen by the double-digits from their peaks in March 2016.
Honolulu rents rank up there with Chicago. The median asking rent for 1-BR apartments has plunged 19% from the peak in March 2015. And the median 2-BR rent has plunged 29% from the peak in January 2015.
In the Seattle metro, a historic construction boom is likely to deliver 8,600 new apartments this year, with 25,000 additional apartments under construction. In addition, a large number of apartments were completed in prior years. This flood of supply coming on the market is high-end, and affordability has become a crisis, though not quite as bad as in San Francisco.
Despite this onslaught of supply, Seattle’s median 1-BR asking rent hit a record in June, and August was off just a tad. But 2-BR rents are 8% below the peak in April 2016. Price resistance appears to have kicked in, and people are compromising on space to get a slightly less expensive but smaller unit. There is anecdotal evidence that the market has turned, but the only place where this is showing up in the asking-rent numbers is in 2-BR apartments.
Some of the remaining markets in the US have experienced double-digit year-over-year rent increases – including 12 cities where these increases reached 16%, such as in Cleveland, OH, or Wichita, KS.
In fact, in the lower half of the list of the 100 most expensive rental markets (below), year-over-year rent increases of 15% and over are fairly common. So when some people say that their rent increases were much higher than the increases in the Consumer Price Index for rent, that’s why. For these people exorbitant rent increases are real. But in other cities, rent declines have set in, which water down the national average.
The table below shows Zumper’s list of the 100 most expensive major rental markets in the US, in order of median asking rent for 1-BR apartments in August, and percentage changes from a year ago (use the browser search function to find a city):
| 1 BR | Y/Y % | 2 BR | Y/Y % | ||
| Pos. | City | Rent | change | Rent | change |
| 1 | San Francisco, CA | $3,570 | 5.3% | $4,700 | 3.1% |
| 2 | New York, NY | $2,870 | 0.7% | $3,270 | 2.2% |
| 3 | San Jose, CA | $2,550 | 8.5% | $2,970 | 6.8% |
| 4 | Los Angeles, CA | $2,320 | 7.9% | $3,200 | 0.0% |
| 5 | Boston, MA | $2,310 | 5.0% | $2,700 | 3.8% |
| 6 | Washington, DC | $2,160 | -5.3% | $2,810 | -11.6% |
| 7 | Oakland, CA | $2,130 | 5.4% | $2,620 | 3.6% |
| 8 | Seattle, WA | $1,950 | 0.0% | $2,430 | -1.2% |
| 9 | Santa Ana, CA | $1,830 | 6.4% | $2,140 | 9.7% |
| 10 | San Diego, CA | $1,810 | 9.7% | $2,490 | 8.7% |
| 11 | Miami, FL | $1,800 | 0.0% | $2,380 | -4.8% |
| 12 | Honolulu, HI | $1,730 | -0.6% | $2,100 | -7.9% |
| 13 | Anaheim, CA | $1,680 | 5.7% | $2,130 | 7.0% |
| 14 | Long Beach, CA | $1,570 | 14.6% | $2,020 | 9.2% |
| 15 | Philadelphia, PA | $1,540 | 9.2% | $1,730 | 8.1% |
| 16 | Chicago, IL | $1,520 | 0.7% | $1,860 | -15.5% |
| 16 | Denver, CO | $1,520 | 15.2% | $1,930 | 7.2% |
| 18 | Atlanta, GA | $1,470 | 10.5% | $1,870 | 10.7% |
| 18 | Fort Lauderdale, FL | $1,470 | -5.2% | $2,000 | 5.3% |
| 20 | Providence, RI | $1,440 | 0.7% | $1,520 | 3.4% |
| 21 | Minneapolis, MN | $1,410 | 11.9% | $1,910 | 7.9% |
| 22 | Portland, OR | $1,400 | 3.7% | $1,640 | 2.5% |
| 23 | Baltimore, MD | $1,390 | 7.8% | $1,740 | 16.0% |
| 24 | New Orleans, LA | $1,370 | 9.6% | $1,550 | -1.9% |
| 25 | Nashville, TN | $1,360 | 14.3% | $1,400 | 0.0% |
| 26 | Madison, WI | $1,290 | 7.5% | $1,410 | 13.7% |
| 27 | Dallas, TX | $1,260 | -7.4% | $1,710 | -9.0% |
| 27 | Houston, TX | $1,260 | 13.5% | $1,600 | 16.8% |
| 27 | Sacramento, CA | $1,260 | 11.5% | $1,460 | 13.2% |
| 30 | Orlando, FL | $1,240 | 12.7% | $1,460 | 16.8% |
| 30 | Scottsdale, AZ | $1,240 | 3.3% | $1,900 | -9.5% |
| 32 | Austin, TX | $1,200 | 9.1% | $1,490 | 6.4% |
| 33 | Tampa, FL | $1,170 | 11.4% | $1,390 | 13.0% |
| 34 | Charlotte, NC | $1,150 | 2.7% | $1,290 | 4.9% |
| 34 | Plano, TX | $1,150 | 0.0% | $1,560 | 0.6% |
| 36 | Aurora, CO | $1,140 | 14.0% | $1,440 | 3.6% |
| 37 | Durham, NC | $1,130 | 10.8% | $1,270 | 15.5% |
| 38 | Newark, NJ | $1,120 | 12.0% | $1,390 | 15.8% |
| 38 | Pittsburgh, PA | $1,120 | -11.1% | $1,350 | 1.5% |
| 40 | Irving, TX | $1,110 | -6.7% | $1,460 | -0.7% |
| 41 | Gilbert, AZ | $1,080 | 2.9% | $1,340 | 3.9% |
| 42 | Henderson, NV | $1,070 | 11.5% | $1,260 | 16.7% |
| 42 | Virginia Beach, VA | $1,070 | 4.9% | $1,220 | 1.7% |
| 44 | Fort Worth, TX | $1,060 | 9.3% | $1,330 | 15.7% |
| 44 | Richmond, VA | $1,060 | 5.0% | $1,240 | 3.3% |
| 46 | Buffalo, NY | $1,050 | 10.5% | $1,420 | 13.6% |
| 46 | Chandler, AZ | $1,050 | 7.1% | $1,290 | 7.5% |
| 48 | Chesapeake, VA | $1,040 | 15.6% | $1,200 | 0.0% |
| 48 | Salt Lake City, UT | $1,040 | 15.6% | $1,350 | 15.4% |
| 50 | St Petersburg, FL | $1,010 | 9.8% | $1,520 | 15.2% |
| 51 | Raleigh, NC | $1,000 | 1.0% | $1,190 | 8.2% |
| 52 | Jacksonville, FL | $970 | 7.8% | $1,100 | 4.8% |
| 52 | Phoenix, AZ | $970 | 14.1% | $1,180 | 9.3% |
| 54 | Kansas City, MO | $950 | 11.8% | $1,120 | 14.3% |
| 55 | Boise, ID | $940 | 16.0% | $1,000 | 8.7% |
| 56 | Las Vegas, NV | $930 | 14.8% | $1,130 | 15.3% |
| 57 | Milwaukee, WI | $920 | 15.0% | $1,100 | 17.0% |
| 58 | Anchorage, AK | $910 | 4.6% | $1,140 | -0.9% |
| 58 | Fresno, CA | $910 | 11.0% | $1,080 | 9.1% |
| 58 | San Antonio, TX | $910 | 8.3% | $1,170 | 13.6% |
| 61 | Colorado Springs, CO | $900 | 8.4% | $1,120 | 4.7% |
| 62 | Louisville, KY | $880 | 6.0% | $1,000 | 12.4% |
| 62 | Mesa, AZ | $880 | 8.6% | $1,010 | 6.3% |
| 64 | Corpus Christi, TX | $860 | 2.4% | $1,080 | 3.8% |
| 64 | Des Moines, IA | $860 | 8.9% | $920 | 7.0% |
| 66 | Baton Rouge, LA | $840 | 6.3% | $940 | 5.6% |
| 66 | Omaha, NE | $840 | 6.3% | $1,110 | 13.3% |
| 68 | Laredo, TX | $830 | 15.3% | $990 | 16.5% |
| 68 | Reno, NV | $830 | 12.2% | $1,220 | 16.2% |
| 68 | Rochester, NY | $830 | 15.3% | $1,000 | 14.9% |
| 68 | Syracuse, NY | $830 | 0.0% | $1,060 | 11.6% |
| 72 | Knoxville, TN | $820 | 15.5% | $930 | 16.3% |
| 72 | Norfolk, VA | $820 | 15.5% | $950 | 5.6% |
| 74 | Arlington, TX | $810 | 15.7% | $1,090 | 16.0% |
| 75 | Cincinnati, OH | $800 | 15.9% | $1,080 | 14.9% |
| 75 | Columbus, OH | $800 | 14.3% | $1,050 | 15.4% |
| 75 | Winston Salem, NC | $800 | 15.9% | $840 | 15.1% |
| 78 | St Louis, MO | $790 | 16.2% | $1,130 | 16.5% |
| 79 | Cleveland, OH | $780 | 16.4% | $880 | 15.8% |
| 80 | Chattanooga, TN | $770 | 8.5% | $810 | 8.0% |
| 80 | Glendale, AZ | $770 | 14.9% | $1,000 | 12.4% |
| 82 | Bakersfield, CA | $760 | 11.8% | $890 | 1.1% |
| 83 | Lexington, KY | $750 | -5.1% | $910 | -2.2% |
| 83 | Memphis, TN | $750 | 13.6% | $800 | 14.3% |
| 85 | Spokane, WA | $740 | 13.8% | $900 | 9.8% |
| 86 | Greensboro, NC | $730 | 10.6% | $820 | -2.4% |
| 86 | Tallahassee, FL | $730 | 15.9% | $860 | 7.5% |
| 88 | Oklahoma City, OK | $720 | 14.3% | $860 | 10.3% |
| 89 | Augusta, GA | $710 | 9.2% | $830 | 5.1% |
| 89 | Lincoln, NE | $710 | 10.9% | $960 | 15.7% |
| 91 | Albuquerque, NM | $670 | 6.3% | $830 | 3.8% |
| 91 | Indianapolis, IN | $670 | 13.6% | $800 | 15.9% |
| 93 | Shreveport, LA | $640 | 12.3% | $720 | 10.8% |
| 94 | Detroit, MI | $630 | 14.5% | $720 | 14.3% |
| 94 | El Paso, TX | $630 | 1.6% | $770 | 4.1% |
| 94 | Tucson, AZ | $630 | -3.1% | $850 | 0.0% |
| 94 | Tulsa, OK | $630 | 6.8% | $780 | 5.4% |
| 98 | Lubbock, TX | $620 | 12.7% | $770 | 2.7% |
| 99 | Wichita, KS | $600 | 13.2% | $770 | 16.7% |
| 100 | Akron, OH | $540 | 0.0% | $740 | 12.1% |
Enjoy reading WOLF STREET and want to support it? You can donate. I appreciate it immensely. Click on the mug to find out how:

![]()
Correct me if I’m wrong, but the Zumper rent data is generally for high-end and larger (50+ units?) apartment complexes, right? I checked some listings on their site for Seattle and SF and I saw only shiny new boxy buildings, and no small mom+pop apartments.
So while the drops in rents are important, people perhaps should not take the absolute rent numbers ad the gospel as to what it costs to rent an apartment in various cities, and especially not if you are not interest solely in the new/luxury segment.
I’ll correct you, no problem. No, the data is not limited to higher-end units. The data is based on apartments listed for rent in any and all multifamily apartment buildings, no matter what the price category or size of building. It is not based on what Zumper lists on its site but on over 1 million units listed on all major sites.
You also need to understand that the rents are MEDIAN rents. Which means that half of the apartments are advertised with rents under that amount. So if the median asking rent is $1,000 in that market, half of the apartments in that market are advertised for LESS than 1,000.
So does that include vacation rentals and AIRBnB?
No. Those are apartments that have been advertised as “for rent.”
I should have searched for “Zumper methodology” before posting my question.
https://www.zumper.com/blog/2017/08/our-methodology-empowering-the-renter-with-data/
In short, it looks like the database consists of Zumper + MLS listings for rentals. Exactly how big a part of the rental listing market those two sources cover, I cannot even guess, but it is clear that Craigslist is not included, for one. I also think that Zumper’s own listings tend to be higher end, and that MLS rentals tend to be from small landlords that own one or a few houses or condos (often RE agents). Perhaps a bit simplistically, Zumper=big-landlord and MLS=small-landlord. That excludes many small-sized 4-8-12 unit mom-n-pop landlords that advertise elsewhere.
Clearly Zumper provides important data that is indicative of market trends, but I still think that in terms of absolute median rent the numbers may be skewed a bit high. Some people in the Zumper comment section are making that assertion, specifically about Philadelphia, but I imagine it will also apply elsewhere.
So, this is not intended to be any kind of big disagreement from me, just an observation about not all market segments being reprsented in the data.
Justme,
MLS = Multiple Listing Services. MLS aggregates listings from other listing services (that’s the “multiple” in its name). Same as with MLS for home sales. MLS data is the broadest there is.
Akron Ohio seems about right.
Hopefully, renters will be able to get a break as the trend unfolds. This housing speculation bubble has really hurt average people and has furthered income inequality. When housing affordability hits these levels something is very very wrong.
A few things:
1. “If rents are down slightly from the peak a few months ago, it doesn’t yet mean that the market has turned – a turning point would require a more significant decline in rents spread over a number of months beyond seasonality.” – except August is peak season!
2. If you adjust for inflation, numbers that look kinda bad now look substantially worse.
3. With all of this high-end supply coming on the market, median asking prices should rise even if shelter prices at given values were generally stable!
Not good.
Without the influence of the Chinese buying up everything in sight rents can only fall in the future. Where I live you’d see rents doubling in one year in Toronto, Canada thanks to what the Chinese did to real estate prices especially since 2015.
The rents are determined by demand, no? So how does it matter if Chinese or Russians or martians buy an existing rental place? Somebody has to own the supply.
I can see your point, though, if the buyer is not renting his place out.
I believe what he is getting at is that speculators buy up inflated housing and condos and drive up the amount of people renting – Due to the requirements for a mortgage in Canada many people have to turn to renting. Increasing the amount of people in the rental market will cause prices to go up – supply and demand would go in that direction in theory, until construction passes the demand.
When I see someone point at foreign investors I just substitute the region with the term speculator. Not all rich assholes investing in Canada are Chinese, but they all seem to like to speculate on housing. Pardon my French.
Simple logic if the price of housing goes up rental prices follow. The Chinese drove our housing prices sky high and rental prices followed with a slight lag in time.
Canada was always an escape plan for rich Chinese. It’s their way of immigrating if needed, they can afford to buy up houses and condos, and if it fall in value. Well, that’s the price of citizenship. It’s an entirely different calculus from a working stiff. Renting the place out (in Canada) was purely optional, and even that ridiculous tax won’t affect things. In the US, the place can sit empty, all they do is pay property tax. Although any one of those guys would be in the process of renting out their place.
Read this very interesting investigative piece from SCMP.
https://www.scmp.com/week-asia/society/article/2158716/special-report-how-canadian-immigration-fraud-saw-860-rich-chinese
These kinds of Chinese immigration rackets are legion in the US. I accidentally stumbled across one in the course of doing my business six or seven years ago. Someone else in my industry who had also discovered what was going on tried to bring the immigration scam to the attention of US authorities, but nobody seemed to care. This was during the Obama administration, so of course they couldn’t be bothered–in fact given the huge sums of money involved, they had probably been cut in on the scam as well.
My guess is, this guy “Sunny” probably didn’t pay off enough of the right people, so he got busted. There are probably five hundred more just like him who haven’t got caught and never will be, until a government is elected that actually gives a damn about the Canadian people.
Wolf. The apartment I live in in the 21237 zip is a 2 br 1 bath. rent has gone up past 3 yrs. 50, 50 and 40. new lease was 40 and we said enough. with Baltimore city and county raising water rates in July 7 pct each? We decided to buy a Condo in Harford co. The deal we got? a steal. Water included, 2 br 2 bath. much safer area. With water included in condo fee we are paying LESS than we are for leasing a apartment. New appliances through out that are no more than 2 years old. No more “market rate?” b s from mgmt. we now know what are payment will be every year
I saw some commentary on new construction in Baltimore on the waterfront. Studio apts will go for $2k. That’s just crazy, they would have to pay me $2K just to go look at the place.
Baltimore? Interesting I agree with you only It would have to be a lot more than two grand to get me to go to Baltimore My father went to dental school there in the late 40s and it was still a sane place Those days are long gone obviously There’s a great big world out there I can’t understand why Americans don’t travel more and get away from the crazy US lifestyle I just wish I had done it ALOT sooner
I think Baltimore has some cool arts scene stuff and all that. It’s a place where cool stuff hasn’t been priced out yet. Not sure if it will ever be gentrified though.
Thanks for the update Wolf!
A few years ago I spent many hours playing with SimCity, a fantastic city planning simulation. Even in a super-simplified setup, I learned that building apartments without being able to secure a sufficiently affluent tenancy is extremely risky. People having jobs doesn’t necessarily translate into ability to afford the rent.
In the real world the dynamics are far more complex. Competing builders, political connections, the municipalities’ insatiable hunger for taxes, credit fluctuations, permits, the long lag between construction and the employment ebbs and flows… It’s easy to conclude that only the most connected individuals (for lack of a better description) can make it as builders. There are mavericks in all industries but I doubt that any of them make money building apartments.
I wonder how much of the rental apartment market is private equity.
In Scottsdale my daughter rented an apt for $1450 with a roommate and the next month it was $1900 to rent it, I kid you not. Because of the students returning in July looking for places, then $1600 the month after.
Every year the rent is higher and it changes monthly as I said. It feels so nasty and I’m sure there are computer programs and Excel modeling programs to determine what the market will bear for that month.
Along with her tuition which is up ONLY (as they put it) 4% in a private graduate school which as it states on their website goes up only 4-7% per year.
I do not know how it works in other markets monthly.
More and more rental real estate is owned by funds, corporations, and private equity these days. And less by mom and pop landlords. They do have software programs that do dynamic pricing to what the current market is bearing. So it can be much different different in price June then it would be in Jan.
What is going on in Los Angeles? Both home prices and rents keep going up! Wonder why LA is diverging from other parts of CA? I know, highly local etc. but what is happening locally to continue to drive both home prices and rents?
Anecdotally, homes are definitely sitting on the market longer. Neighbor’s house has been sitting on the market since Jan, dropped the asking twice, albeit paltry amounts. Less and less viewing activity, I think they’ve had 3 open houses at least!
A friend who renovates properties in LA says there is not enough product, the product there is super high, and regulations are insane to build there so it is hard to build.
This is anecdotal.
Hopefully it turns, but don’t hold your breath. Just keep in mind that one thing worse than crazy high rents is buying into a place you can barely afford.
As a renter you at least have options like looking for a cheaper place with roommates on Craigslist, and you aren’t responsible for major repairs.
Purchasing a place locks you in, so you really feel the squeeze when your condo with all the taxes, HOA & utilities takes close to 2/3 of your take home pay. That leaves you feeling trapped and very vulnerable.
I understand that the surveys point this out but these numbers are median ASKING rents. Due to the lack of transparency in rentals the level of gaming going on by the landlords, LL, would be jail time if the landlords worked on Wall Street.
For example-east bay lamorinda. There are numerous, 60+, homes 5k and above which have been sitting vacant for months. Good homes for 3k-4k are rented. This drives the median asking price up without actually reflecting the true transactonal price in the market.
Also, the numbers include all the fake listtings by thr LL designed to pull the average asking price up.
We just traded our 5k home for 3650 and the landlord begged us to move.
The rental market is (predicated on stagnant wages), dropping, and now that school has started….
Not to mention how many of these corporate run rental places take low income people sent by the city. I discovered a 5k pm place that was being filled with people from low income lists. The cities play the games too. The said high rise stayed empty for a while before suddenly sporting a bunch of cars, as if the place was fully rented. Then, I heard how the city was helping out. Anecdotal story.
Wolf writes: ‘…while rents plunged in other markets…’ — In this latest Zumper list of asking rents in the 100 most expensive major rental markets in the US and YoY-comparison dataset, one has to work hard to find the singular ‘market plunged’, much less the plural. I count a whopping 46 with double-digit YoY median-asking-rent jumps versus a mere 1 with a double-digit YoY drop in the 1BR column, and 40 DD jumps versus a mere 2 DD drops in the 2BR column. Just nuts.
The number that counts is the drop from “peak” – not year-over-year. See my table of the top 17, which shows the drop from peak: In the 2-BR segment, 5 out of 17 have dropped in the double digits from peak, including 2 (Chicago and Honolulu) that have PLUNGED nearly 30% from peak.
As a renter in Chicago I wish the rents were going down as the zumper data suggests. My rent, as reflected by this data, is going up: http://www.chicagobusiness.com/commercial-real-estate/downtown-apartment-rents-hit-new-high-boom-continues. I do not understand how zumper has contradictory findings.
This is not contradictory data. The article you linked is for “The monthly net rent at top-tier, or Class A, apartment buildings in downtown Chicago.”
Several things:
— it uses “average,” not median (average is skewed by a few very expensive outliers)
— “top-tier or Class A” are the creme of the crop. The high-end market tends to be different.
— “downtown” Chicago… this is a small-ish area in the vast Chicago market.
In other words, this is a very small sub-market of Chicago rents: luxury downtown towers.
Maybe it’s time to check out rents in other parts of Chicago?
Thank you, I enjoy your website. But the zumper methodology appears flawed — unlike case-shiller, which tracks SAME PROPERY sales, zumper doesn’t track same property rents. Chicago is gentrifying….new properties are becoming available in neighborhoods that were not in the rental market for low rents that are likely skewing these numbers to make the Chicago rental rental market appear as though it is colapseing. I don’t know any renter in Chicago — class A building or otherwise — who is experiencing this collapse or even a softening in the rental market. If anyone is please post your experience.
Since you mentioned it, the CaseShiller index for Chicago is now flat with 2004 (that’s 14 years) and down 14% from the peak in Sep 2006. So Chicago is not exactly a hot housing market.
I’m a landlord in Chicago and I’ve had to reduce rent 23% in the last 18 months.
What neighborhood?
Thanks