A $1-trillion job.
What the Bureau of Economic Analysis released today as part of its GDP report was a huge pile of revisions and adjustments going back years. It included an adjustment to the tune of nearly $1 trillion in “real” GDP. And it lowered further its already low measure of inflation.
Based on this revised data, second-quarter “real” GDP (adjusted for inflation) increased at a seasonally adjusted annual rate of 4.1% from the prior quarter. Annual rate means that if GDP continues to increase for four quarters in a row at the current rate, the 12-month GDP growth would be 4.1%. This was the highest growth rate since Q3 2014:
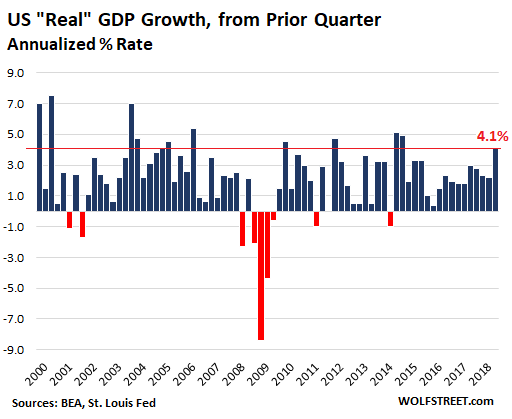
The above measure of “real” GDP – the change from prior quarter, but at an annualized rate – is the most volatile measure, producing the biggest-looking results, both up and down, as you can see in the above chart with a plunge of -8.4% in Q4 2008. Few or no other major countries use this measure for that reason.
A less volatile measure and producing less big-looking results is the 12-month change in “real” GDP, which the BEA’s data set also provides. This is the inflation adjusted, seasonally adjusted annual rate of GDP growth – in other words, how GDP did over the past 12 months. For the 12 months ending in Q2, it rose 2.8%.
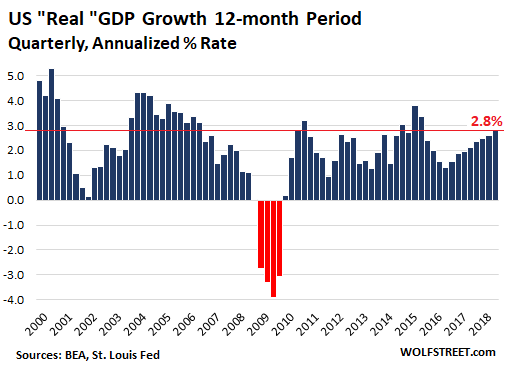
Note that for the worst 12-month period, ending in Q2 2009, “real” GDP fell -3.9% (revised from a drop of 4.1% before today’s revisions), compared to the worst quarter’s plunge (first chart), in Q4 2008, of -8.4%.
The BEA also performed adjustments to the entire pile of GDP data and classifications (summary is here). This happens about every five years. It says:
Comprehensive updates of the National Income and Product Accounts (NIPAs), which are carried out about every five years, are an important part of BEA’s regular process for improving and modernizing its accounts to keep pace with the ever-changing U.S. economy. Updates incorporate newly available and more comprehensive source data, as well as improved estimation methodologies. The timespan for this year’s comprehensive update is 1929 through the first quarter 2018.
These revisions, updates, and adjustments impacted many aspects of the entire pile of national data. But one adjustment stood out, an increase in “real” GDP by nearly $1 trillion, from $17.37 trillion in Q1 (unrevised) to $18.32 trillion in Q1 (revised) – a difference of $952 billion.
This chart shows the new “real” GDP in trillion dollars (revised, red line) and the old “real” GDP (unrevised, blue line):
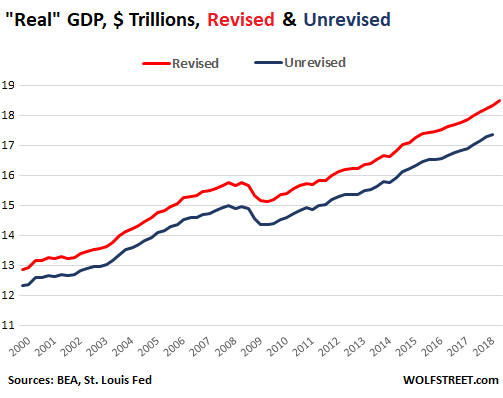
What caused this to happen? A change in the calculation of “real” GDP from using 2009 dollars to using 2012 dollars, and a reduction in the inflation index used for “real” GDP calculations. From the the BEA:
For 2012–2017, the average rate of change in the prices paid by U.S. residents, as measured by the gross domestic purchasers’ price index, was 1.2 percent, 0.1 percentage point lower than in the previously published estimates.
And that previous “average rate of change” in prices paid by consumers of 1.3% per year over the five years, was already ludicrously low, given the actual price increases experienced by most consumers. But now it has been reduced to just 1.2% over the five years. A lower inflation rate used to deflate “nominal” GDP translates into higher “real” GDP.
But nominal GDP, which is not impacted by inflation adjustments, barely changed. I overlaid the data for revised (red line) and unrevised (blue line) “nominal” GDP:
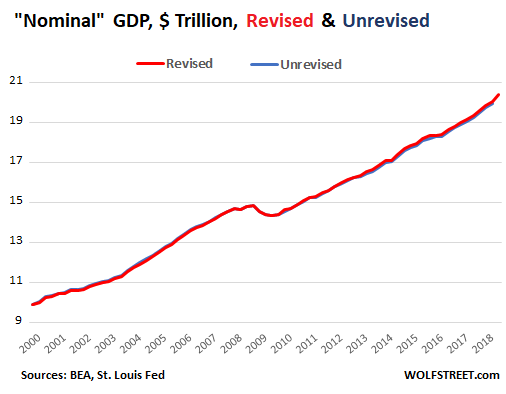
The fact that “nominal” GDP was barely impacted by any of the countless adjustments and revisions today, though “real” GDP jumped by nearly $1 trillion, shows that the adjustments that mattered for “real” GDP were the switch to 2012 dollars and the downward revisions in the prices-paid index. “Real” GDP is immensely impacted by the inflation measure used to deflate “nominal” GDP, and adjustments have an outsized impact over time.
GM, Fiat Chrysler, and Ford all got ugly in unison, in one day, something we haven’t seen since the Financial Crisis. Read… Carmageddon in Detroit
Enjoy reading WOLF STREET and want to support it? You can donate. I appreciate it immensely. Click on the mug to find out how:

![]()
Hedonic adjustment nonsense. Basically, they cant measure the real value of high tech goods. But that has little or no impact on people’s day to day cost of living.
I get a “measure” of the current GDP when I shop for needed groceries. That’s my reality!
Pretty soon we will be sucking on rocks for sustenance!
“they cant measure the real value of high tech goods. But that has little or no impact on people’s day to day cost of living.”
Average life expectancies in the U.S. have risen 5 years since 1960. Medical equipment and processes certainly count as “high tech goods”. What is the “impact” of millions of people living longer lives? What is it worth?
1) What makes you think it was right before? Because it was first? Maybe both are wrong and it’s higher still? Or maybe lower than both? Or something else?
2) I personally feel better off than even a year ago and expect to be even more better off as each month passes by. Rising rates have been great for me. I was never suffering before, but the thought of ZIRP or worse down the road forever really hunkered me down. It was the difference between planning out a retirement that was survival level comfortable vs today, where I am thinking about things I never imagined before.
3) Maybe, possibly, the bad data from the past was intentional because people are easier to influence when they’re apprehensive or worse? I know this isn’t a place for that kind of talk but ZIRP and NIRP and globalism were/are the biggest frauds ever perpetrated on us ever, giving a lot to a few at the expense of the many.
Those who are invested, diversified, own property, able to bank a sizable portion of their salary every month, NOT in horrible debt…in other words, the top 10% are doing swell.
…and disciplined people that make responsible financial decisions
Yep don’t go into the wrong field, don’t get cancer, don’t have an accident, don’t get born to the wrong parents …
…don’t be sick, don’t have mental problems, don’t help your aging parents, don’t give to charity, don’t be poor in a poor neighbourhood with bad schools, don’t go to the dentist…
More people in the 70th to 90th percentile of income earners could probably have more financial security if they were more financially responsible. I immediately think of many of my coworkers who I have a knack for getting to talk about their finances and they often compulsively spend money on the dumbest things and they will admit as much but just can’t seem to help themselves. However, the majority of income earners, basically the bottom 70% by my estimates really, have no hope of being able to bank enough of their income to have much meaningful financial security. The best they could hope for is to get a mortgage on a cheap house and hold onto it but the days of cheap housing are gone and most feel like they are living in a feudal economy and I think they have good reason to feel that way.
Nobody made me that way. I’m fairly ordinary. The only big difference is that I’m cheap, I save, I hate long term debt beyond a passion, and always try to think my way out of a cost problem. For example, community college at $100/hr vs Yale or Harvard or something similar that calls for massive debt that may not be affordably paid back over time from the education purchased. No Starbucks. No routine expensive weekends.
The 10% could easily be the 50% if people weren’t so easily influenced by whatever makes them think not saving and not thinking is cool.
No sympathy from me. That’s part of free choice.
Some are struggling terribly and many work hard without much cushion for the unexpected but to your point, many make a decent living but destroy their savings and futures with endless purchases of crap, the latest I-whatever and of course, got to go into hock for 8 years to get the wheels that make you look as good as or better than the Joneses and then trade it in four years with negative equity. I do wonder if the economic slowdown that has to happen at some point comes in a much more abrupt fashion than in the past.
Bart – my 2 cents – I think rising rates will delay the next slowdown for a long time.
The need for low rates is PR for the paper flippers.
Rising rates = more income for savers = more spending = economic expansion = more jobs = real business expansion = rising markets after the paper flippers take a little hit from margin calls. Real investors return to the markets once it looks more fair and honest due to a rising economy.
The slowdown fear is a wall street construction to protect the paper flippers and globalists. Low rates vs normal rates are, to put it bluntly, class warfare (and worse). Stupidity concerning money and economics is a weapon used by the paper flippers.
->No sympathy from me. That’s part of free choice.
Free choice has been in steady decline since Edward Bernays and died an ignominious death in 1964, buried in its chains.
You live in an age of manufactured consent, endless advertising, competing corporatist propaganda, constant contradictory official lies, expert promotion of irresponsibility and infantile narcissism, where science and critical thinking are discouraged by force and guile and plain facts are rejected in favor of illusions more profitable to your masters. It’s a wonder people know enough to remember to breathe, let alone think, let alone choose wisely.
What is this ‘free choice’ you speak of?
@CDR,
Thank you for your comment and willingness to risk a hit. My sister-in-law is turning 53 this year and she is building her first home. We are very happy for her because it is a big deal, although have many misgivings about her debt level, etc. Her sister (my wife) purchsed her first home at age 28 and has always saved a percentage of her income along the way. My wife drove a Maverick and a bare bones 90 Honda Civic…her sister bought a new F-150 with all the bells and whistles. You get the point. (God help her if her employment burps.)
I do feel very bad for folks who are struggling due to circumstances beyond their control. I have had many many lean years with a young family. I have also had many childhood friends, workingmen all, who never missed the fancy vacation or winter all inclusives in Mexico. I used to ask myself, “When did it become a right that a workng guy has a tropical fly-in vacation every year. Have I missed something”? And, “When did it become a necessity to have resort destination weddings”? “Why do so many weddings cost $50,000….on loan”?
Hey, I was married on an airplane dock in the middle of Quetico Park/Boundary Waters about 60 miles east of Intl Falls, MN. Cost? By donation and a bottle of good wine for the priest. We returned home in an open boat. Very romantic, actually. When I returned home to Vancouver Island my father-in-law thanked me for eloping with his daughter and gave us a cheque for $1500 (which was a fair chunk of change in ’75). It went into the house down-payment fund. :-)
As for the article, the meme these days is fantastic economy and ain’t life grand? Then why is housing unaffordable the World over? Why do so many young people have mucho student debt before they even start work…at the bottom? But they all have smart phones, plans, and like Starbuck lattes.
Define divide and conquer.
Define echo chamber.
Define exploiting your youth.
Define being so smart and narcissistic.
Define sympathy.
Define boom cycles.
Define interest rates.
Define hyperinflation.
Define free market.
Define bank closures in a
free market.
Define socialism.
Define communism.
Define free choice.
We all need to realize we have more in common than different.
Let’s all walk a mile shall we
I agree 100% with you! A lot of people waist a lot of money on stuff they really don’t need!
One example is eating out which is pretty expensive, I know several that really can’t afford that but do it anyway.
I have a pretty good job, and could afford to waste a lot of money, but I don’t want to. I even cut my own hair…
So Wolf, if this ” tiny adjustment” had not been made at this time, what would that have done to 4.1% growth number reported today?
Today’s GDP rate of 4.1% (first chart) wasn’t that unusual. Under Obama, the economy exceeded it four times. This is a very volatile measure that jumps up and down a lot (that’s why most/all major countries stay away from it). So a small understatement of inflation in this volatile measure in just one quarter would not have made a hug difference. Guessing, maybe 10 to 30 basis points.
Here’s one of the reasons GDP is bound to increase in coming quarters:
https://www.nola.com/environment/index.ssf/2018/07/10_things_to_know_about_st_joh.html#incart_m-rpt-2
Respectfully, I dunno if a $760M levee or even a $1.4B infrastructure project moves the needle appreciably, considering the Pentagon budget alone is approaching $1T?
The recently discussed farmer relief proposal was $12B, nearly 10x more…
These projects are going on all over but not covered as a national economic topic.
Don’t quite see the connection…perhaps wait and see what next hurricane season brings…they won’t be able to build those levees fast enough.
Weren’t the adjustments just changing from measuring in 2009 dollars to measuring in 2012 dollars? The 2009 dollar was after a major deflationary event- 2012 dollars was after a significant reflationary event.
CDR,
per your statement way above:
“… vs today, where I am thinking about things I never imagined before.”
Me too. The last time I felt this good was in 2007.
stan
So you have another year Stan until August 2008 arrives.. No worries
What’s ironic is the computation to “adjust” this GDP is also no doubt counted in the GDP.
Change you can believe in!!!
Better hope that this spectacular performance is not caused by people bringing their activity forward to get ahead of the tariffs. Because that’s just going to be an offset to future activity.
->Because that’s just going to be an offset to future activity.
So will debt when the bills come in. The numbers are so stupendous that people can’t process them.
I suspect GDP is up because of last year’s trillion-dollar stimulus package of free money which can never be repaid, stealing from the future to pay for the profligacy of the present. There are many such debts, not all of them financial in nature.
It should be clear now that the inflation numbers are whatever you want them to be and are now being dangerously manipulated by politicians to achieve their goals of getting re-elected.
I had posted this before, but I think this point really needs to be emphasized – to truly understand inflation, you really need to read this analysis by Miles Campbell of how inflation has worked for the last several decades:
https://blog.supplysideliberal.com/post/2018/3/16/relative-price-changes-1997-2017
And articles elaborating further by Bloomberg and WaPo:
https://www.bloomberg.com/news/articles/2018-07-10/chart-of-century-gives-powell-gloomy-glimpse-of-trade-war-world
https://www.washingtonpost.com/business/2018/07/12/one-chart-shows-why-trade-war-could-be-real-shocker/?noredirect=on&utm_term=.193dd7773b42
Basically, things that could be made cheaper by offshoring (globalization) or mechanization have dropped in price or had low levels of inflation. This group consists mainly of durable goods (electronics and cars)
Things that required a constrained supply of skilled labor or land, and which could not be made cheaper by offshoring, mechanization, or using cheaper labor have skyrocketed in price at much higher inflation rates – this group includes education, healthcare, and home construction. Homes in this usage is a durable good that is highly necessary, but the supply of land is constrained in many locations and the labor costs cannot be offshored or mechanized.
So when you look at Campbell’s graph, really the rate of inflation can be whatever you want it to be basically by shifting the weight of the CPI to emphasize or de-emphasize what is in the “basket of goods” that make up the CPI. And, one of the very first changes designed explicitly to LOWER the traditional CPI number, made during the Reagan administration in 1983, was to take the cost of homes out of the basket and replace it with the cost of rent.
I think we can see the effect of this in the continuing high inflation rates for the cost of housing – home prices no longer being reflected in the CPI, the Fed has since the 1990s kept rates at far too low of a level, which has had the effect of turning homes from a “durable good” that people used into valuable “Assets” (an asset that gets taxed every year is not really an asset, and you don’t really own it – you are just renting it from the state).
This also explains why, if you look at charts of the Shiller PE, the stock market, even at the bottom of the crash of 2008-2009, never went down to the historical normal levels for crashes – a PE of 5-7 – instead reaching a low PE of 15, which would have been a good PE in a decent economy in previous years.
I’ve also talked about the Taylor Rule, and what happens when the Fed does not follow the Taylor Rule for setting rates, and instead keeps interest rates too low for too long. The problem with the Taylor Rule, of course, is that it contains inflation (or a “GDP deflator”) as one of its calculation factors, and which inflation rate you use changes what the Taylor Rule specifies should be the Fed rate. There is also something called the “ouput gap coefficient” which can be changed to allow for lower interest rates. And so Taylor Rule charts vary depending on which inflation factor is used and which output gap coefficient is used.
Here’s a theory I have been working on – the Fed has been more or less following an “Easy Money” version of the Taylor Rule, ie the output gap coefficient is set to 1.0 instead of 0.5 and using Core PCE Inflation as the GDP deflator. That point is made here in this article
https://www.brookings.edu/blog/ben-bernanke/2015/04/28/the-taylor-rule-a-benchmark-for-monetary-policy/
However, Core PCE is generally LOWER than CPI Inflation, which we already know is artificially low. Setting the output gap coefficient to 1.0 instead of 0.5 will also specify a lower Fed Fund interest rate.
So, to go back to the Shiller PE, the stock market bubble has never completely popped since the 1990s, not even during the crash of 2008-2009.
http://www.multpl.com/shiller-pe/
Now, people of course have tried to justify all of this by saying that this is some sort of “new normal” – a favorite term to explain away these strange times – and that PE ratios and 10 year PE ratios don’t mean anything anymore. That’s a sure sign of tulip fever, when you start changing the rules for judging true intrinsic value.
It’s clear that by jiggering the inflation rate that the Fed has been able to justify keeping rates lower than it should be. This has obviously led to asset inflation in the stock and housing markets. And led to increasingly speculative bad loans and other financial instruments that are likely to set off another financial crisis in the near future.
And, it has contributed to the ongoing “True” Inflation rates of Health, Education, and Home building costs.
17.9% of the GDP is spent on healthcare.
7.3 % of the GDP is spent on education.
6% of the GDP is spent on new home construction.
That’s 31.2% of the U.S. GDP!!!!!!
These are the three biggies in Miles Campbell’s chart that have inflated at a higher rate than the official CPI And yet they are deliberately given markedly reduced weighting when calculating the CPI – for sure none of the inflation measures have healthcare, education, and new home construction as 31.2% of their weighting, and yet these dubious inflation measures are used in reverse as “GDP deflators” to calculate “Real GCP”.
Here’s a few charts of their inflation rates:
https://fredblog.stlouisfed.org/2017/07/healthy-inflation/
https://www.edvisors.com/plan-for-college/saving-for-college/tuition-inflation/
https://edzarenski.com/2018/02/15/inflation-in-construction-2018-what-should-you-carry/
Also note in Campbell’s chart that the drop in price of durable goods is starting to taper off. Finding cheaper labor around the world is getting harder. At some point you are not going to find workers willing to work for free or to pay you the factory owner for the privilege of working. There is a limit to how much further this can go on. Mechanization also has its limits. When you have fully automated factories that just require one employee to turn it on and off and provide servicing, you’ve reached the endpoint.
I see more inflation ahead of us and another asset bubble explosion.
P.S. So, just to make clear, as a corollary to all of the above, if 31.2% of the GDP is composed of the three elements of the economy with the highest inflation rates, and yet the inflation measured used to calculate the “Real GDP” essentially minimizes the contributions of these three high inflation elements, then the “Real GDP” is totally 100% BOGUS, FAKE, TOTAL CRAP, and this “update” is being generated only to make the current economic climate look good.
If the “Real” Inflation rates were closer to those of healthcare, education, and home construction, then in fact the “Real GDP” would be in the NEGATIVE range, i.e., we have in fact been in a period of prolonged recession.
As the good manufacturing jobs and the farming jobs have either been offshored or automated with machines, they have been replaced with lower paying jobs in the service industry or temporary contract work.
This also serves as an explanation for why wages are so resistant to being increased. We are and have been for a long time been in a deep deep recession for the traditional measurements of industrial output. Shifting to a service industry economy, which is internally hugely price competitive, has kept wages depressed.
So here’s where GDP really fails. Our current economy is 80% in service industries. GDP was designed to measure manufacturing output, and is terrible at measuring service industry output
https://www.weforum.org/agenda/2018/01/gdp-frog-matchbox-david-pilling-growth-delusion/
As for “Real GDP” , the only thing it measures is how eager the reporting government agency is to lie about the Real Inflation rates.
Nice writing. Usually, most long posts are so wordy and off point that I can’t get very far in.
You kept me completely in to the bottom of both and I learned something as well.
Well said, Olorin.
The common sense, pragmatic, objective unit of measuring economic activity is observation.
Permanently shuttered businesses.
Abandoned residential and commercial properties without for sale/lease/rent signs.
Homeless camps, nomadic, transient population
Unemployment or $500/month full time job salaries
I don’t know exactly what is going on out there but driving through vast swaths of land. These characteristics are perceived as sinister, frightening to someone grown up during the golden age of abundance and prosperity coming to age on 2001.
I read somewhere that most of the FIRE sector should be excluded from GDP calculations. The arguement seemed similar to the Broken Window Fallacy.
If you want to understand how shaky these calculations are look at Ireland’s GDP and compare with Ireland’s GNP.
The trouble is, the government’s GDP figures are the only game in town. The guys and gals preparing the data undoubtedly try their best to be fair.
Another thought: There’s a calculation referred to as Labour’s share of the Economy = Wages/GDP. If GDP is unfairly calculated by including the FIRE sector, then Labour’s share of the Economy may be underestimated.
So it seems like the FED is correct in raising rates to cool off the economy at the same time new tariffs raise inflation on imported goods, and consumer debt costs more to service and the export market is drying up (see tariffs). We’re all getting poorer and we have only ourselves to sell products and services too? And GDP is rising? GDP is evil
“Will the real baseline, please stand up?”
A sailing analogy is if you start a voyage one degree off course, after 400 miles of sailing, you end up so far off course to your rightful destination at that point.
It seems to me that these gdp adjustments and changes, by design, seek to obscure what the actual baseline is so that no accurate measurement of economic activity can be done.
In the meantime, debt data cannot be fudged by comparison.
Therefore, it is necessary to fudge GDP data so that it appears that a country is earning enough so that it can borrow more and become more indebted.
Measuring economic output data should not be this complicated.
We are being treated to a shell game in my view.
In light of Wolf’s observation about the consistency of the nominal GDP data, the thing here would be to compare nominal debt to nominal GDP. Apples to apples … you still see debt surging out of control.
Great article, thank-you for clearing up a confusing topic. Is it just me or are economic data and accounting rules becoming so convoluted they have become useless.
The constant bias toward trying to create reports that have been fudged to look good has gotten out of control. If they are going to release a number they should be clear about comparing it to the number calculated using the same method in the past.
For example, if someone asks what is the PE ratio for the S&P the answer should never be “well that depends”. The financial media always report a PE value calculated based on projected future (fantasy) earnings but they compare this PE to past values that were based on TTM earnings – seems like intentionally lying to me.
I like reading the comments on this site and I often play devil’s advocate to try and prod a response from people – I’m always eager to know what people think on a topic. I will admit to being influenced by some opinions here. Against my better judgment this morning I sold all of my stock positions, everything is sitting in precariously in fiat, now I’m with most of the guys here – hoping for a pullback. The financial market lies and manipulation have piled too high, even for me, it has become truly frightening to listen to CNBC, it’s hard to believe we have not hit the euphoric end of the cycle.
One-year fiat is now earning close to 3%, with US government backing. Don’t just let your excess fiat rot in a 0% account :-]
It will be a supreme irony…as an ever strengthening USD is what finally brings down Trump.
That sucker was going down anyway. We live in an age of slow motion train wrecks.
Beware of 2019, even government funded economists are saying is gonna be a problematic year.
That said, how much did taxes and tax cuts affected this year number so far?
big bus happier, small bus happier, people have more money in their pockets, job growth is good, people sense improvement, country ”going in right direction” and confidence is good, and we probably won’t have thermonuclear ww3 with Russia or NK and get a hundred million americans vaporized. can’t we give the president a tiny modicum of credit people?
on the second gdp chart that smooths over trailing 12 months. how is that,calculated ? . q2 2018 minus q2 2017 over q2 2017 = 2.8 % ? thanks for pealing back the onion.
Your formula is basically correct when it’s applied to the dollar figures for Q2 2018 and Q2 2017 (not the percentage change figures). However, it’s more complicated in reality due seasonal adjustments and other adjustments that happen on a quarterly basis.
Half the stuff in the CPI basket that gets cheaper has also become more shoddy.
It’s not a fair comparison.
Cheap junk was always cheap. Now it’s simply more commonplace and harder to avoid.
Amazon is 95% tat now. And non-Amazon sellers are often selling fakes now.
So GDP isn’t real, but the Fed raises rates to cool off the unreal economy? How’s that going to work?
When looking at the Chairman’s FOMC Press Conference Projections it is interesting to see a dip in numbers for 2020 to real GDP. Also in 2020 the Federal Funds rate has a median of 3.4 with a range of 1.6 to 4.1. Seems like they are expecting some kind of event, could it be their unwinding of their balance sheet, impact of the raising rates or the 2020 presidential election?
Almost feels like taking a large put position against the stock market for 2020 might be a good position to take.
https://www.federalreserve.gov/monetarypolicy/files/fomcprojtabl20180613.pdf
With respect to the FOMC, I truly don’t believe they could forecast their way out of a large paper bag if you gave them 5 tries.
A range forecast for rates of 1.6 to 4.1 bluntly states “We have no idea, even though we are the ones who set rates.”
It also implies some globalists are still in positions of influence on the FOMC. The threat of a return to ZIRP or the introduction of NIRP exists as long as any are still there.
Note to those who don’t understand the ZIRP/NIRP big lie: Normalized interest rates provide interest income, which allows people to spend, which allows the economy to expand. People borrow when they have income. People with diminished income do not borrow.
ZIRP/NIRP reduces personal income. People with reduced income do not buy lots of stuff and therefore, have no need to borrow no matter how low the rates are. Wall Street love ZIRP because it allows them to borrow a lot for nearly free to flip paper and create asset bubbles at low cost and high profit.
Result, no normal inflation because people are spending less. High asset inflation because assets are being flipped repeatedly using low rate borrowing. Capital (personal savings) is also consumed to supplement spending. Over a long enough time, money printing replaces personal capital and growth in asset bubbles replace income from savings.
Yet ZIRP/NIRP is / was sold to the public by the Fed (and other central banks) as a means to promote inflation they consider necessary for a normal economy. Thus, the big lie.
Wolf – what is your take on ShadowStats alternative measures of employment and inflation?
I don’t think he’s taken on GDP yet.
The guy is just having fun. He doesn’t have any data of his own. Just uses the standard government data and a formula that ads a bunch to it. Totally useless and much more misleading than the official data (which isn’t that pure either).
U24 means everyone is unemployed.
(that was a joke.)
– I believe ShadowStats more than the official calculation of inlfation and GDP. His calculation of GDP is much closer to the calculation of Charles Biderman’s Trim Tabs (uses Treasury data) and Steve Keen (uses a special debt gauge).
– ShadowStats indeed uses government data but adjust for changes in how the that e.g. GDP is being calculated.
Is there anything left that America doesn’t lie about? Trump’s doing a great job but all on fabricated data.
– I remember that the FED once revised GDP downwards for 2 previous years. The result was that the latest GDP calculation showed a growth in the GDP numbers.
– Without those 2 downward revisions for 2 previous years the GDP calculation would have showed that the GDP was negative.
– Can’t remember which year this trick was performed.