At least one of them is very wrong: Atlanta Fed GDPNow v. New York Fed Nowcast.
On July 27, the Bureau of Economic Analysis (BEA) will release its “advance estimate” of GDP growth for the second quarter. Based on preliminary and incomplete data, this number is what everyone puts under the microscope.
On August 29, the BEA will release its “second estimate” for Q2 GDP growth, which will include more data. On September 27, the BEA will release its “third estimate.” In future years, it will further revise GDP growth as more data becomes available or gets revised. Only China releases a GDP growth rate that is perfect on day one, is always very high, comes out before the US release, and never needs to be revised.
But in the US, even as the revised numbers get more accurate, the least complete and reliable “advance estimate” gets the most media attention.
Outside the BEA, an army of economists struggle to estimate what the “advance estimate” of GDP growth is going to be – including in the Federal Reserve machinery. The Atlanta Fed with its GDPNow and the New York Fed with its Nowcast just came out with very different forecasts.
The Atlanta Fed is out with a huge GDP growth number for Q2, after raising it from already high levels in early July: Its nowcast hit 4.5% on July 16 and stayed there on July 18 after real consumer spending for May, industrial production, real private fixed investment, and real private inventory investment data were released.
These nowcasts are supposed to get more accurate as data for the quarter accumulates. The quarter is over, and June data is starting to be included – though June’s consumer spending data, a biggie, is still missing:
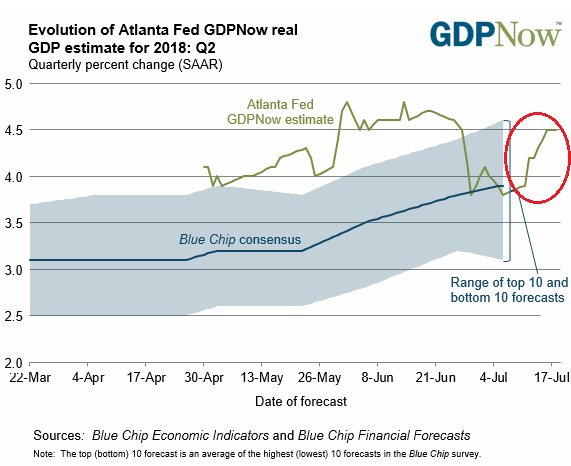
The GDP estimates of the “Blue Chip” economists surveyed by the Atlanta Fed are in the range between 3.3% and 4.6% (shaded area). So the Atlanta Fed’s 4.5% is at the top of the range of the Blue Chip economists. That says something!
Annual rate means that if the economy grows for four quarters in a row at the rate of the current quarter, the total annual growth would be 4.5% compared to the prior year.
How big is a 4.5% seasonally adjusted annual GDP growth rate? This is a huge number for the US. The last time the US economy grew at a 4.5% annual rate was…. Well, we have to dig deep into history… let’s see, back in the day… the Clinton era… in Q2 2000 (5.2%):
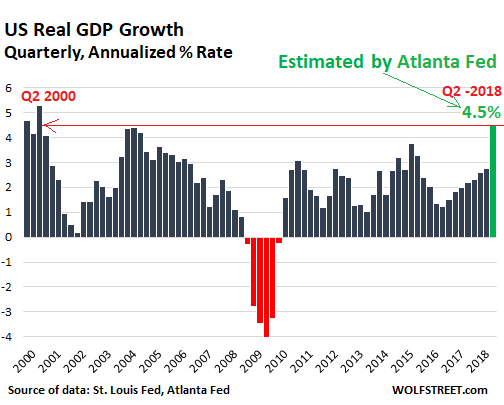
So the Atlanta Fed’s nowcast is truly an outlier – practically a miracle.
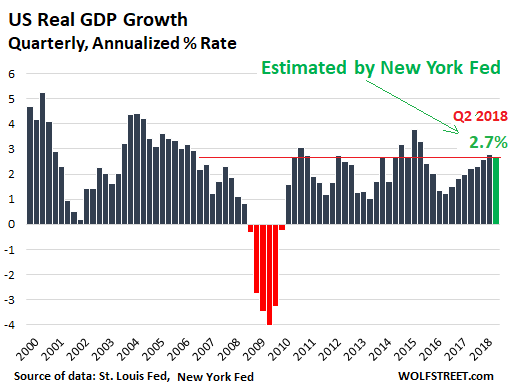
However, the New York Fed’s nowcast is raining on this parade. Released every Friday, it peaked on June 1 at 3.26% and has since been in decline, going the opposite direction of the Atlanta Fed’s GDPNow. Friday’s estimate dropped to 2.69%, the lowest in the series for Q2:
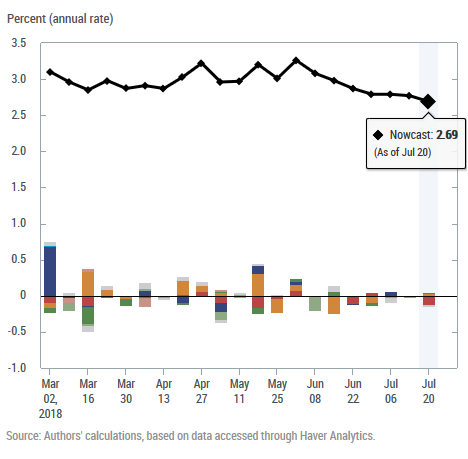
The colored columns in the chart above show the impact of each broad category of data on the Nowcast. And since the beginning of June, there were more and bigger negatives than positives. Not very inspiring.These are the broad categories:
So now big is an annualized rate of GDP growth of 2.7%? It’s still strong given recent growth patterns, but it’s smaller than the growth in five of the quarters since the Financial Crisis, including Q1 2018. While the Atlanta Fed’s GDPNow is a true outlier, the New York Fed’s nowcast (green column) is well within the post-Financial-Crisis normal-ish range:
So which estimate will be closer to BEA’s “advance estimate” when it’s released on July 27? From where I sit, the New York Fed’s estimate looks more realistic than the Atlanta Fed’s estimate: 4.5% is just a huge number for the US economy, given the growth history of the past 20 years. Frankly, even hitting the New York Fed’s 2.7% growth rate would be good. We will find out on July 27. Meanwhile, I’m wondering, why do they differ this much?
One possibility is that the economy in Q2 hit it out of the ballpark, and only the Atlanta Fed’s model saw it. But I doubt that.
Another possibility is inflation. The annualized GDP growth rates are adjusted for inflation – so “real” GDP growth rates. Consumer price inflation has been rising sharply. In June, inflation as measured by CPI, rose 2.9%, the biggest increase since February 2012. The Atlanta Fed’s model might not have fully captured the impact of inflation.
The reason I’m wondering about this is because “real” consumer spending, which accounts for nearly 70% of GDP, rose only 2.6% in April year-over-year, and 2.3% in May. June’s data will be released later this month. But with real consumer spending growing at only 2.3%, it’s nearly impossible to get to 4.5% real GDP growth.
So for now, the Atlanta Fed’s GDPNow estimate of 4.5% GDP growth in Q2 is a mystery seeking an explanation.
How the “Yield Curves” Stack Up in central-bank manipulated bond markets. Read… Which Yield Curve “Inverts” First? US, Japan, Germany, or China?
Enjoy reading WOLF STREET and want to support it? You can donate. I appreciate it immensely. Click on the mug to find out how:

![]()
The Fed has an abysmal track record when it comes to economic forecasting (or spotting upcoming crashes).
for the fed to not include inflation enough in its models is monetary malpractice! we need neo-chartalism! : D
– And what did the website of the US Treasury say about total (payroll) taxrevenues ? Did they go higher or lower ?
Total tax revenue (all sources combined) in Q2 rose. In April, income and SS tax receipts rose, but in May and June they fell compared to the same periods a year earlier. The tax cuts are now impacting the numbers, and year-over-year comparisons may not say much about the economy.
But tax receipts, wages, employment, etc. don’t enter into GDP calculation. GDP is measure of spending — how much money gets spent in the US economy.
There is a GDP-like measure that is income based (Gross National Income or GNI), but we don’t pay that much attention to it.
=But tax receipts, wages, employment, etc. don’t enter into GDP calculation.=
Mr.Richter;
Your sacred duty is to enlighten us mere mortals.I am not an economist but I read Paul Samuelson’ book “Economics” more than once.Wages DO enter into GDP calculation.
GDP is calculated twice:
-GDP Based on Production
-GDP Based on Income
Those 2 numbers should match.
I can’t squeeze Mr.Samuelson chapter dedicated to GDP,GNP,GNI in one comment-here is the short primer:
https://www.investopedia.com/terms/g/gdp.asp
Also if you are not allergic to linear algebra you may download latest GDP data from BEA and perform input-output analysis using MS Excel.Because raison d’être of a computer is to compute.
https://www.bea.gov/iTable/index_industry_io.cfm
BEA even provides Field Manual of input-output analysis in .pdf format “Concepts and Methods of the U.S. Input-Output Accounts”-see link above.
As I pointed out yesterday (below), there is an income-based measure, the Gross National Income or GNI. But that is a different measure and NOT discussed here.
GDP does NOT take income into account. GDP is based on the “expenditure” method.
Also, the way GDP is actually calculated is this way, according to the BEA (also see below):
“The sum of personal consumption expenditures, gross private domestic investment, net exports of goods and services, and government consumption expenditures and gross investment.”
That’s the actual formula. In other words, there is nothing about production in it. The BEA is trying to approximate production by estimating how much money gets spent.
You wrote:
“GDP is calculated twice:
-GDP Based on Production
-GDP Based on Income”
So both of these assertions are wrong. GDP is calculated only by one method — the “expenditure” method.
There is no such thing as “GDP Based on Income.” You’re confusing this with GNI.
The last time I read anything about it, the GDP number was so disappointing that the Obama administration decided to add the premiums paid for Obamacare into the nation’s GDP numbers. And if that alleged claim is actually true, then significant rises in the Obamacare premiums, that so many have been complaining about for so long, is actually a good thing, at least for the U.S. GDP. If the Federales can play those kind of games with the GDP numbers, then Katy, please bar the door.
GDP is a measure of spending. By definition, ALL insurance premiums figure into it, whether they’re related to Obamacare or not. If the consumer pays for these premiums, they go into the consumer spending category (= ca.70% of GDP).
Is healthcare an insurance premium or a tax I’ve seen lots of people who think it’s a tax
If the US were a first-world nation instead of a 2nd-rate one with a big military, it’d be a tax. Or rather, one of the things paid for out of income taxes. It’d be basic, taking care of check-ups, vaccines, broken legs, etc. You want to get a boob job, you’re on your own. We’d have essentially the NHS they have in England, or whatever France is doing.
Justice John Roberts thinks mandated Obamacare premiums are a tax. Otherwise, he would have had to declare the A.C.A. unconstitutional. Of course, now that the mandate penalty has been reduced $0, that ruling is due for realignment.
Once I was given a good example of this “spending” method of calculating GDP. You have a free parking space and then it is made a paid parking lot. So, you get “GDP increase” out of nowhere. Supposedly, people will save less or even borrow to pay this extra expense. And if they borrow there will be even more GDP created through financing transaction.
The US GDP statistics seem to look like Chinese statistics. This GPD “surge” is explained in part by net exports growth, which in turn is driven by increased soybean shipments! I wonder how much more soybeans you need to ship to move the GDP figure so much? I would assume that it is much easier to move it by simply increasing rent rates above “official” CPI.
Given this is a growth estimate is it possible, just possible, the Atlanta Fed is forecasting and pricing in an inflationary flareup in Q2 2018?
Inflation is rising its ugly head everywhere this year: it’s far more noticeable in Emerging markets (EM) with toxic monetary policies (in Egypt 2018 CPI growth increased to 14.4% in June and in The Philippines to 5.2%, despite the Duterte Administration ordering a big change in the statistical methods employed) but this year the whole world is feeling the pinch and very few sectors are immune.
I wouldn’t be too surprised if the Atlanta Fed’s model is calling for worldwide economic overheating extending to the US, which is already feeling inflation inch forward at a faster pace than the past few years.
And we all know that when an economy overheats the first cause is always inflation, far more so than increased volume.
In the past developed overheating economies were usually cooled through monetary tightening, but we live in an age where the weird monetary policies of several EM are openly lauded as some sort of panacea, so I am watching this intently to see if at the close of my life I’ll witness some more man-made prodigies. ;-)
The rate of expansion of the global monetary base despite the Feds minor tightening keeps inflation worries alive. As you expand the monetary base through debt the process becomes convoluted. Debt is in a bear market which is what happens when you make too much of anything. The problem with spending (GDP) and debt comes to a meeting when as Obama said about the debt ceiling, we have no choice, its money we already spent. Consumers invest in money pits, things which require more money to operate than they cost in the first place, cars, homes. So rising GDP is probably a bad sign, as rising savings would be a good sign. And the people who service your car, home, healthcare raise their rates, which is inflation, but in this case it lags spending.
Is there a separate chart showing real GDP growth versus projected GDP growth? It’d be nice to match up predictions to results.
On a side note, one can wonder about political influence. Rosy predictions of GDP growth could be a useful way of defending interest rate hikes.
It’s also troubling that GDP growth is viewed as an indicator of economic health. If all spending is included, I’d assume that stock buybacks, being spending, are also included. Spending would also include payments on those 300% payday loans taken out by desperate consumers … in which case GDP growth could be masking real problems in the economy.
From the horse’s mouth, the Atlanta Fed. Note, the comparisons are to the BEA’s FIRST estimate, same as in the article. The BEA has since revised these GDP numbers (second estimate, third estimate), sometimes sharply, but the revisions are not reflected here since the GDPNow model is trying for forecast only the first estimate (click to enlarge):
This shows the difference between the initial GDP estimate and the final “GDPNow forecast“. The Altanta Fed’s site states:
It’s still a model – do they ever match it up to the final numbers?
They maybe an simpler explanation – fiscal policy.
This graph IMO shows the reality of the neoliberal economic policy of Obama, who advocated and wrote the devastating austerity spending cuts that contributed to Obama being the first and only President in history to never reach 3% annual growth at any time.
Growth may be higher under Trump if only because Republicans did undo some of Obama’s devastating austerity spending cuts that are responsible for his worst-in-history performance.
If Trump crashes Obama’s 3% self imposed ceiling, fiscal policy should probably get the credit.
CONGRESS decides what gets spent, and what gets cut, and Republicans controlled Congress for much of the Obama era. So that’s where you need look for blame for “the devastating austerity spending cuts” …
Now that there is a Republican president, suddenly the Republican-controlled Congress says deficits don’t matter, and piles on massive spending increases and massive tax cuts.
Yes but the President submits the budget.
The budget proposals submitted by the President to Congress aren’t even looked at in Congress. In recent years, they’ve been DOD.
Have the Atlanta Fed’s GDPNow estimates usually been accurate?
If so, maybe its accurate again.
See above.
Only segments of the economy are doing well. IF GDP growth is 2-5% and technology revenues are growing at 15-30%, as evidenced by the FAANG +M, I think this means technology is growing to the detriment of everything else. The tech companies are also allowed to pay the lowest tax rates of everyone, so tax policy is encouraging the disparity.
We not only have growing inequality in the individual ranks, we have growing inequality in the corporate ranks. It’s becoming a nation of haves and have nots in many ways.
The solutions to this are easy, but the powers that be don’t want to hear them. It’s a rigged system that deals all the good cards to the wealthy and powerful.
I was going to say, “Sure, but what do you really call the economy? FIRE”?
Possible big GDP growth, but very little is actually made/manufactured, exported, sold to citizens who buy with money they actually have to spend. Instead there is health care costs, insurance, RE, services; you cut my hair, I’ll walk your dog, and my kid is at university on a borrowed dime kind of economy. And the oxy dealer bought a new car for cash.
Does a 7 year financed car really count, something underwater upon driving off the lot? (Not in my world).
Meaningless stat unless used as propoganda. Opinion not meant to offend, but to me GDP growth is just more hype. Now debt to GDP is a different animal.
If the real GDP growth is 3%, like estimated and inflation is over 2% that makes it almost 5.5% nominal or something like a trillion plus for the year! Where does come from?
Sure there is noticeable growth in oil and gas, but that would probably add 100 billion or so for the year at best. Then there are cars. Its 1.5% of GDP, so even 60% growth since the Great Recession lows is not really much in terms of GDP. Real Estate. Residential is 4% of GDP, how much can it add. What else is out there? Exports – these have shown growth, but judging by the annual trade deficits imports grew at comparable pace. You can import more without your trade deficit growing too much, but again that only added about a trillion + for 10 years (making it about 100 billion a year).
You have defense of course, but again, during the Clinton years the defense budget was cut substantially.
Numbers just do not seem to match. It does look like a huge statistic manipulation where you have many costs that are becoming more expensive much faster than overall official CPI (healthcare is one area, insurance is another, rents are also important) and this where you get your “growth”.
It is pretty much like the Great Recession when the overall statistic contraction was pretty minor, a couple of percent at best.
What is interesting is that on state level GDP contracted by well over 20 percent for some states (like Nevada and Michigan).
Just read Sean Hannity is worth $93 million………….oh but he’s a rags to riches story………..America has become a joke of a country economically. Our stupid country is so divided along political lines……we are more worried about gender pronouns than the governmental and corporate fleecing of our collective wealth and the rising income and wealth disparity. People like Hannity (both left and right) scream capitalism while knowing full well we are a country of nothing but cronies masquerading as capitalists. There needs to be some homestead act or something where the national wealth is divided among American citizens at birth. It’s “THEIR CAPITAL” to do with it what they wish. Oil, forests, minerals etc. The REAL capitalists in government need to put their money where their collective mouths are. This is my country and I was born on this soil………I deserve a few acres of productive land! That is how you build real wealth and that is how you build a true capitalist society. It has to start somewhere. The gap is so wide there is no going back.
A kid with a ruler could draw a line across the highs in GDP between 2000 and paint a picture of an economy in decline. That big number in 2000 was a sign everything was great? The mean GDP for the last two decades is probably 1%. Even 3% is a hefty outlier, and at full employment as well. The landing gear won’t drop, the engines are on fire and we’re gaining altitude (in the nose)!!
Eh, so basically the bigger the number, the more expensive everything is the US is?
Why they think that’s a good thing?
People borrowing from banks love to see inflation. Makes it easy to service their loans. Basically if you’ve lived responsibly, you should feel screwed.
I don’t get it. With the hot demand for trucks, the increase in consumer spending has to be higher than 2.7%. Otherwise, what are those trucks carrying? Also the trade war should reduce the deficit? So GDP should get a boost from that as well right?
There’s not one truck in ten on the highway that can carry a sheet of plywood
You have made me feel very special.
The govt is spending money on infrastructure projects. One person I know in Florida says the govt is going to build a new federal building in Ft. Lauderdale. Another person tells me Louisiana got flood control money they have been asking for forever. These projects are the ones I know about, I’m sure there are more out there.
Yeah as if a new federal fricking building is REALLY necessary? What about roads, bridges, dams, parks, water filtration, schools etc.
Wolf, unless we assume that unsold inventory is “bought” by the same manufacturer that made it, I thought GDP was a measure of how much is produced rather than spent.
GDP, by just measuring spending (flow), is a terrible measure of the economy. But that’s what we have. It doesn’t even account for how much of that spending comes from borrowing.
Unsold inventory counts as an “investment.” So when inventories rise, they add to GDP, like building a plant. When inventories fall, the subtract from GDP.
Looks like “fake news” is now coming from some Fed banks! Political favors, headline bait, ohhhh dear. bada bing bada boom.
Meanwhile, the middle class is still disappearing. The poor you will always have with you. So GDP is essentially a measure of how much richer the wealthy are getting.
As we can see, the rich are doing better than ever, much better in fact, as they have year after year, which everybody knew anyway. This discussion of exactly how much more fabulously wealthy they’re getting, sorting through the vagaries of GDP statistics, mostly just rubs it in the face of everybody else.
That’s a great perspective…and it’s absolutely true.
Utterly true.
I know ONE guy who’s making good money in tech. Other than that, I don’t know anyone who’s making this legendary tech money, and I don’t even know “of” anyone, other than as abstractions talked about in the newspaper or on the radio.
Everyone I know is making the same or less than me ($15k a year) except for a few who might be making as much as $40k, and those are music teachers.
Oh, and one guy making “tech” type money, north of $100k, owns a violin shop.
Maybe you should get out a little more?
Wolf – I think you are probably right.
After getting “stepped on” by a buy playing a drum (I was playing trumpet) in Mountain View, I decided maybe the drum(s) would be my thing, plus it was what were becoming the final couple of months of the move and I decided that the move was more important than the $60 a weekend I made busking.
So I just worked on the move and we got that done, then I got some practice pads and sticks and started working on learning drums, but a short while ago I realized I need to get back out there earning that $60 a weekend because that’s my grocery and transport money I’m missing out on, but I am no where near being able to sound like anything but a nuisance on drums.
But I’d come to the conclusion that I’d reached a sort of plateau, maybe a permanent one, on trumpet and besides, if I had to blow out a spit valve again I was gonna scream. So what to do?
I decided I’d have another go with the instrument I was messing around on years ago, before I had done very much with the trumpet at all; the clarinet. It’s best to study it for a year or two at least before moving on to the saxophone, and I know a lot of the problems I’d had on trumpet, like lack of range, won’t be there on clarinet or sax.
So I just got a clarinet and am working on it. The nice thing is I should be able to attain a much higher level of skill than on trumpet. I want to get good enough that I can go to any city of a decent size or tourist area and make a living.
And how does this relate to “getting out more”? Well, Silicon Valley isn’t really an area you go to for socializing. Everyone just works all the time. If I’d not falling for the tech scam and just worked in a warehouse, at least I’d have a company softball team to play for and things like that. But attaining a “journeyman” level of skill at music means people will want me to play at their weddings, give lessons, and so on.
I’ve gone and hung out at the “cool” coffee shops and bars here in San Jose and it’s just cliques from workplaces and other people just kind of ignoring each other. Like SoCal, really. Any sort of creative attainment does a sort of end-run around this.
(OK I’m gonna qualify this: Attaining a skill that others admire. While it’s a wonderful instrument, the harmonica will always only be about prison and hobo camps. Likewise learning to do tattoos, or how to make those flowers out of palm leaves. Jugglers are annoying more often than they’re entertaining, and sword swallowers are just gross. And the only people who really think you’re cool for performing “fire poi” are heavy smokers, since only they can’t tell you smell like singed hair and Ronsonol.)
Alex
You really need to get out more
Engineers in bay area are really making tons of money
“Everyone I know is making the same or less than me ($15k a year) except for a few who might be making as much as $40k, and those are music teachers. ”
People who are making “good money” are probably not hanging out with that many people who are making $15k a year, or playing drums on the street for money. I don’t mean any offense at all with that, but from my perspective that’s just the way it is, and it’s getting worse.
We’re in a slow motion dystopia where the rich will eventually fly away in their high tech space ships while the poor are left to rot on an environmentally devastated earth. Or was that a Matt Damon movie I’m thinking of?
It’s like being at a fantistic dinner party………..as a servant.
No, like being a homeless guy looking in through the window and having had nothing to eat, then getting shooed away by the private security guy who you know lives in his car.
alex, I enjoyed your soliloquy re making ends meet by playing in a band; you just can’t forget that the tradition of keeping artists hungry is well-entrenched in most cultures.
loved your ironic/humorous remarks re the harmonica- don’t underestimate them; maybe the legalization of marijuana gives their popularity a boost ?….i mean, outside prisons and hobo camps
good luck with the move to clarinet
The Great Moderation – i.e. jumbo shrimp:
https://fred.stlouisfed.org/series/A191RL1Q225SBEA
Remember that blowout Q278?
The St. Louis Fed defines GDP thusly:
“Gross domestic product (GDP) is the value of the goods and services produced by the nation’s economy less the value of the goods and services used up in production.”
Which isn’t true. Sounds official though.
Unamused,
You left off the second part of the paragraph (in bold), via the BEA (which tells you how it is actually calculated):
“Gross domestic product (GDP) is the value of the goods and services produced by the nation’s economy
less the value of the goods and services used up in production. GDP is also equal to the sum of personal
consumption expenditures, gross private domestic investment, net exports of goods and services, and
government consumption expenditures and gross investment.”
Go down to ” definitions”:
https://www.bea.gov/newsreleases/national/gdp/gdpnewsrelease.htm
The part you quoted is true. Accounting identities cannot reconcile it to the part I cited as untrue.
I’ll skip the proof. It would take a couple of hours of typing and nobody would read it.
->GDP, by just measuring spending (flow), is a terrible measure of the economy. But that’s what we have. It doesn’t even account for how much of that spending comes from borrowing.
Which suggests that a better measure of ‘real growth’ might be to subtract out the increase in debt from GDP – the federal deficit, corporate debt, and personal debt. You can do this at home.
The results will dismay you. That dismay could lead you to investigate further by, say, creating a balance sheet for the US economy which accounts for the change in value of total public and private assets purchased with the increase in debt, discounting for mere expenses like goods and services. Additional methodologies and refinements will also spring to mind.
That will also dismay you. Better to just focus on GDP statistics. Those at least will tell you that the US economy is doing just fine and doing so will allow you to avoid the unpleasant realities besides.
The big federal spending started in Obama’s last year or two to help Hilary win the White House. As Petunia noted just recently, back then I saw projects in Charlotte NC announced that had been only dreamed about until then. All that spending (and this continued spending) was masked under the debt limit suspensions agreed at the time. Anybody have any earthly idea of what our real budget deficits are? Those numbers are also being jacked around and manipulated as low as possible but they are readily above a trillion a year now.
With Trump’s tax cuts, more money has been turned loose to spend.
Construction is at 2007 levels in Charlotte now. It looks like a war zone in many neighborhoods and apartments continue to be announced/started.
All of this is deliberate. Booms are needed (or so it is believed by the masters of the economic universe) to stir significant inflation and get wages and prices up. This is the end game they need to reduce the enormous amount of dollar debt.
And it is happening to varying degrees. Food prices have gone up significantly in the past year. Construction materials are out of sight. Trucking/shipping costs, etc.
Essentially, we have another developing frenzy in many parts of the country and this is feeding inflation ….. as well as increased GDP numbers.
“The big federal spending started in Obama’s last year or two to help Hilary win the White House.”
Wrong: CONGRESS has the power of the purse and decides what gets spent and where. And REPUBLICANS were totally in control of Congress, and they would certainly not have done anything to help Clinton.
You are correct and I misstated. The big federal spending started with the BIPARTISAN BUDGET ACT OF 2015 which suspended the debt ceiling until March of 2017. Since it was bipartisan, it is likely that each party felt that a stimulated economy would benefit their march to the White House and control of Congress; not just the Democrats.
I admire your calm persistence, Wolf. :-)
Same here! Appreciate your articles, but also your insistence on facts and data. Thank you!
->With Trump’s tax cuts, more money has been turned loose to spend.
More money has been turned loose to disappear into overseas tax havens and to compensate for losses due to increased tariffs. Also more trillions in debt and billions in interest expenses.
The politically ambitious have long since figured out that they can buy votes with the voters own money – which money had to be borrowed from them without so much as a by your leave and with the full knowledge that it will never be repaid.
Both nyfed and Atlanta fed probably have access to the same data. So the difference can be attributed to the way they build their models. At the end of day, pretty much every number coming out of bls, the fed, or anybody else in the govt. is just a number spit out by a model. The journalist shills then go to town with these numbers and discuss them on cnn and pbs market news, ad nauseam.
Can we look at the past predictions to forecast the success rate of these forecasts? Until somebody really shows that the success rate for a model is different from that of a coin toss, I wouldn’t trust any of the forecasts. IMO, the people building the models are just earning their pay by putting these numbers out.
If Vegas were doing these numbers, it’d be another matter. There’s money to be made and lost. Unless fed shares its data with the rest of us and let us all build our models and bet on these models, the forecasts should be probably taken with a grain of salt.
I agree, the raw data is far more valuable than their interpretation of it (or what they present for public consumption). I don’t trust their methods or motives.
The GDP numbers are 100 percent fabricated to suit the economic backdrop at any given time. If interest rates are too high the GDP numbers always come in low 100 percent of the time. If China is devaluing the yuan then the GDP estimate will always come in on the low side 100 percent of the time. All you can do is shake your head every American is already on to this.
I wouldn’t say they are 100% fabricated, but I think your skepticism is valid.
I would guess that a bunch of highly (over?) paid federal wonks crunch all sorts of crazy numbers and stats to produce a range. Then a few at the top (with suggestions from higher up) tweak these numbers with fudge factors similar to what is done for CPI.
Anyone remember significant figures in math? Well I doubt the accuracy of GDP calculations is anywhere accurate to 2 sig figs (i.e., to tenths of a 1%). GDP numbers are probably no more accurate than to single digit numbers (e.g., 2% or 3%) and even then with a tolerance of +/- 1% at that.
Wolf,
A while back on another thread I had mentioned that the apparently low inflation numbers in the US were largely the result of globalization and mechanization, and that sectors of the economy like health and education that had suffered the highest inflation (and “durable goods” like housing) were those which were not easily cut down in price by increased mechinzation or offshoring the manufacturing/production.
Well whaddya know, some egghead economist made exactly the same points recently and actually quantified it in a nice color coded chart. This has finally caught the attention of some mainstream media and reportedly even made it to the attention of the Fed:
https://www.bloomberg.com/news/articles/2018-07-10/chart-of-century-gives-powell-gloomy-glimpse-of-trade-war-world
https://www.washingtonpost.com/business/2018/07/12/one-chart-shows-why-trade-war-could-be-real-shocker/?utm_term=.a268352d6b42
I would add to the points made in those articles that Trump’s Global War On Illegal Immigrants (GWOII) will also likely have inflationary effects, just like his Global War On Trade (GWOT, Part Deux).
That’s because those cheap, poorly paid illegals will have to be replaced by either Real ‘Mericans who will want to be paid much better, or, more likely, by increased mechanization, which will have expensive initial capital costs.
So, if either of the two signature achievements of the Trump administration, the GWOII, or the GWOT Part Deux, succeed, we are headed for much higher inflation indeed.
If the Fed refuses to fully adjust to rising inflation by raising rates adequately to Turner Rule levels (and already the Fed is about one year behind the Taylor Rule in its schedule, see my comments in the “Super Dangerous Place to Be” thread), it will only add to the inflation, either wage/price inflation a la the 1970s, or even more asset inflation, a la the 2001- 2007 period.
The outcome will thus be either the Stagflation of the 1970s or the Debt Bomb Meltdown of 2008-2009
That’s why a discussion of previous examples of where the Fed failed to follow the Taylor Rule, and what happened, are important.
This is all occurring, incidentally, at a time where Trump and the Republican Congress essentially made future generations of Americans take out a $1 trillion loan and then gave this huge amount of money away to Corporate America by lowering its tax rates. Much of this money was then used by Corporate America to do stock buybacks at current inflated prices, at the same time the Corporate Insiders were selling out their stock options at those inflated prices.
I just don’t see how this turns out well.
dear wolf– is it true that without deficit spending the real gdp growth would be nil, zero, or negative. for example, in a 17 trillion economy, 3% growth would be approx. 500 billion. with a 600 billion or more yearly deficit, the growth would be attributed to the government spending entirely. with a trillion deficit, the growth is negative 3%. karl denninger has a graph depicting this he shows often on market ticker. I was aghast to see it. thank you again for your great articles. with kind regards.
There’s probably very little information produced by gov’t that ought to be taken at face value. That being said, I suppose it’s still helpful to compare this month’s lie to last.
GDP needs to be looked by comparing it to the population growth. The official figure for population growth used to be over 1% (if one adds illegal immigrants, that should probably go higher).
On the real economy side, there have been bright spots. The shale boom has, of course, spurred a lot of activity. Shale is not the most efficient operation, so a lot of haulage and various equipment is required. It is not like you drill a well and keep pumping for many years to come. That is where you get the demand for trucks. So it is having a disproportional impact on GDP – first, by cutting net imports, and, second, by creating a lot of (unnecessary) activity.
But even all that included, borrowing is what drives the spending. The traditional economic theory says that you cannot consider growth through increased borrowing a real growth. So one should always look at by how much the borrowing exceeds income growth or revenue growth. If borrowing grows 10% and income by only 2%, you obviously have a problem.
In the current set up, it looks like it is to a large extent about federal spending.
It is a false signal to the Federal Reserve that they can continue with QT and interest rate hikes with no consequences.
So which Fed has a better PAST records to actual reported GDP numbers?
“Only China releases a GDP growth rate that is perfect on day one, is always very high, comes out before the US release, and never needs to be revised.”
All hail the perfect economy. Either that or a fraud that will never end…..
The headline should have been “Economists Don’t Know”, or “Economic Models NOT Good Enough for Policy Decisions”.
When even the best economists’ estimates differ by a range of 2:1 on something this important, then clearly they don’t understand the situation very well. This shows that they cannot predict what will happen a few months out, but they still insist they can model (predict) well enough to set policy that will have impacts for years.
Remember all the talk of “fine tuning” the economy? remember how well that worked out? We are fools to take anything they say as other than reading tea leaves.