This is a sight to behold. But I’m not sure what to make of it.
The TD Ameritrade’s Investor Movement Index (IMX) dropped another 8.2% in April, after having plunged 12% in March, 23% in February — the biggest month-over-month plunge in the history of the index — and 9% in January. The January plunge, the first in the series of four, occurred around the time of the final spurt of the stock-market rally that took the S&P 500 index to its still standing record close on January 26.
After climbing every month last year and forming a perfect spike, the index has now plunged every month so far this year, collapsing 44% from its peak in December. This – up on a steep escalator and down by express elevator – is an investing cliché that rarely turns into such a perfect and baffling chart. Note the historic range:
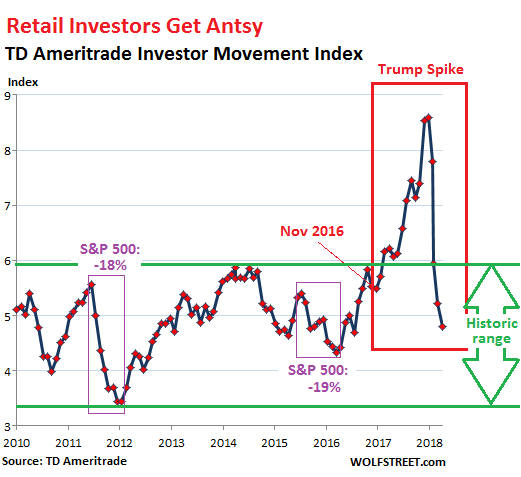
The IMX tracks the actual trading activities and positions of TDA’s clients. It’s not based on what investors say they “feel” or on what they say they “plan” on doing. It’s based on what they’ve actually done in their accounts and how they’re positioned in the markets. But the data does not go back to the Financial Crisis, so we don’t know what the index does during extreme stress.
During the time that the IMX surged 55% from the election in November 2016 through January 26, 2018, the S&P 500 soared 35%. Retail investors went all in, boiling over with enthusiasm, adding exposure to market risk every month in 2017. But then in January 2018, they got nervous.
The IMX index fell sharply during the past two stock market sell-offs, when the S&P 500 fell 18% in 2011-2012 and when it fell 19% in 2015-2016. But as the chart above shows, those two declines in the IMX were barely a ripple compared to the collapse of the breath-taking Trump spike.
And yet, so far, the S&P 500 index is down just 7% from its super-lofty peak in January and is only flat year-to-date. It’s really barely a dent. It’s not like there’s mayhem going on in the market, not at the level where I would expect investors and traders to get antsy to the point they’re starting to look for safe-haven alternatives and exhibit a sudden interest in today’s gold price.
But in just four months, the index collapsed from super-stratospheric and way beyond the historic range to “moderately low” within the historic range, with plenty of room to go lower. But at some point it will have to bounce, you’d think.
TDA Chief Market Strategist JJ Kinahan said in an interview that TDA’s clients were net buyers still, but were buying “lower beta stocks overall,” that they were rotating out of risk. “It’s a little bit of a quandary for everybody,” he said. “We’re beating earnings, and the market isn’t necessarily reacting.”
This was a reference to the phenomenon that the S&P 500 index surged 35% in 14 months in anticipation of tax-cut-inflated earnings, and when those earnings arrived, the market didn’t want to go any higher, and retail investors removed exposure to the market.
Retail investors’ reaction to these moves may be classic in terms of direction, but the magnitude of the moves is baffling – the enormous spike way beyond the historical range, and the total and sudden collapse since. And it makes me wonder: Do retail investors on the whole, with their disparate views averaged into one unit, know something we retail investors as individuals do not know? I’m getting the feeling that some kind of history is being made here.
The Fed’s QE Unwind is ramping up toward cruising speed to bleed oxygen out of the markets “gradually.” But these are getting to be serious amounts. Read… Fed’s QE Unwind Accelerates Sharply
Enjoy reading WOLF STREET and want to support it? You can donate. I appreciate it immensely. Click on the mug to find out how:

![]()
Yikes, that quite a drop, nothing the market can’t metabolize right?
It also shows the market power of retail vs institutional. Retail investors make up about 30% of the market and even this extreem case is just a blip blip the overall market. Good to see them selling. Didnt quite get Kinahan’s comment that his clients were still net buyers.
These investor sentiment type gauges never seem to work for me. The chart above is stark but it doesn’t go back very far and sentiment can change quickly (as the chart shows). Should I read it as bearish or a contrary bullish indicator? I don’t know.
I know the Fed is tightening, and you should never fight the Fed. But, if the Fed were to tighten for real, how would the government fund the 35% of the budget that is not covered by tax receipts?
I understand the Fed is not currently outright monetizing the debt, but it seems to me that others will stop buying U.S treasuries if they can’t be sure the Fed is willing to buy treasuries from them at a higher price in the future (front running). In other words, won’t everyone (who is not required by mandate) stop buying treasuries if they think the Fed does not have their back. And if that occurred, would that not make it impossible for the government to raise the 35% of the budget that it spends in deficit.
I have been waiting and hoping for a pull back for a long (long) time and hopefully this time is for real but it seems like investors know the Fed will be back buying because they will have to bail out the government and if/when they do resume QE say adios to the dollar (sorry to turn every comment into commentary on the Fed – I just find it fascinating).
This is NOT an “investor sentiment” gauge – on the contrary, as I explained in the article. Here is the definition once again:
The IMX tracks the actual trading activities and positions of TDA’s clients. It’s not based on what investors say they “feel” or on what they say they “plan” on doing. It’s based on what they’ve actually done in their accounts and how they’re positioned in the markets. But the data does not go back to the Financial Crisis, so we don’t know what the index does during extreme stress.
This is not fantasy, this is reality.
Is not like the FED has not been rising rates.
Is not like cheap debt is becoming a thing of the past.
Is not like people are buying more online and less offline.
Is not like Amazon isn’t basically at War with brick and mortal retail stores.
Is not like a stronger dollar does mean inports get cheaper.
The odd thing is that during the IMX drop recently, safe stocks went down and darlings kept rising. Perhaps retail investor trades have no impact anymore. When you have large corporate buyers and central banks buying stocks at the asking price without fail, with an intent to increase the stock prices, that may be all that matters.
Agree, corporate buyers have been a huge factor recently. Retail investors are just one of the cogs in the machine.
The bears are in control, retail or odd lots as they used to call them have been holding the market up on obvious trade points, 200ma, etc. Institutions don’t work that way. My broker says I am his only client who buys and sells individual stocks, everyone else is in a structured plan. It’s a knee jerk market. Who are the bears? Nervous offshore investors who watch the dollar, and listen to the tweets. Credit will contract, the money supply will shrink (or stop expanding) and inflation (generated by absurd Fed policy) will make up the difference and the lack of easy finance for buybacks will be offset by pricing power, or so the logic goes. And there is no reason the institutions cant’ buy bonds and stocks, as long as the bonds collateralize to a beneficial degree. There is the rub if the US credit rating doesn’t add up to anyone except the people at Moodys.
Big numbers are scary or after 12 years of jawboning interest rates nobody can afford to make jawbone soup?
I once tried to find out exactly what is the calculation behind the Ameritrade IMX. I could not find out. I think it is a secret, but I would like to know the exact definition of the index.
Also, would like to data-mine all their customer accounts for holdings and transaction data. A pony would be nice, too.
Exactly, what does an index value of 5 mean?
The data points on any and all indices have meaning only in relationship to other data points on the same index (is it higher or lower? trend? direction? range?). That’s how indices are designed on purpose.
Same as the S&P 500 index.
As explained in the article:
The IMX tracks the actual trading activities and positions of TDA’s clients. It’s not based on what investors say they “feel” or on what they say they “plan” on doing. It’s based on what they’ve actually done in their accounts and how they’re positioned in the markets. But the data does not go back to the Financial Crisis, so we don’t know what the index does during extreme stress.
You’re correct: the formula is proprietary, and they will not tell you.
Wolf, you said part of the Index consists of activity? I wonder if the cut in commissions in February 2017 had something to do with the move. Also, maybe a lot clients were holding/trading the short Vol ETF’s like XIV.
Oh yea! It’s been very good to Marcus of Goldman Sachs? Borrow and short the VIX was a money multiplier until very recently and now it’s a bond gauge? Short VIX carnage to continue!
They know what any intelligent individual knows That the equity markets are on a precipice and manipulated higher and taking their money out makes the most sense unless they want to lose all their gains
The internal mechanics of this index are kind of vague. Read the below gem of ambiguity from the TD-Ameritrade link below.
” the IMX gives you a snapshot of investor sentiment. It does this by analyzing and averaging the holdings/positions, trading activity, and other data from real portfolios held by real investors each month and boils it down to an index.”
Sounds good until you ask, which investors? What holdings? All holdings? The average holdings? Averaged over what, when how? And what’s that other data?
Perhaps someone can clarify exactly what the IMX is? Sounds like it’s whatever TD wants it to be.
https://www.tdameritrade.com/research/imx.page
From TDA:
“It measures what investors are actually doing, and how they are actually positioned in the markets. The IMX does this by using data including holdings/positions, trading activity, and other data from a sample of our 11 million funded client accounts.”
I’m actually curious how it’s possible that the index doesn’t go back to the last financial crisis. Even if it didn’t exist then, it can’t be created from customer account data from then? – I find it hard to believe that they wouldn’t keep trading data, account positions, etc for pretty much forever.
Or maybe they do, but it’s a product they sell to institutional clients or something?
Is there something I’m missing?
I think TDA started the index in reaction to the Financial Crisis. But I can imagine that it is very difficult to cull this type of granular real-time trading and positioning info (we don’t actually know what data goes into the index) from the limited historic account data going back years. Because of the difficulties, the reconstructed data set that goes back in time might be very unreliable. They might have tried and scuttled it after they saw how unreliable the output from this historic data was.
All indices start at some point. For example, the Empire State Manufacturing Index started in July 2001 (though the index and the surveys were likely in the planning stages long before then). The day the index was first published was during a recession and a few months before 9-11. The index shows huge gyrations right at the beginning. If they had had the idea of the index six months later, none of it would have shown up in the index. Granted, this is a survey-based index, and you cannot go back in time. But the fact the indices have a beginning is a very real problem.
Wolf – What does TDA get out of publishing an index? Why do it?
What does any company get out of gathering and publishing data for free?
Many companies publish data for free. Why do they do it?
Volitity echo
Morphic Field Theory…
I think a more important indicator is the NACM US Credit Managers Service Sector Dollar Collections SA survey.
It has crashed to 47.3 in April, its the biggest decline since November 2008, to below the 50 level which signals an economic downturn.
The TD Ameritrade index just hasn’t been around that long, to give you a solid comparison background as to its action. Taken in the context of the long run this could be just an outlier, or used in conjunction with other indicators a snap shot of whats just around the corner.
In other words, this represents the collective wisdom of the retail investors and it is NOT a cotrarian indicator.
That’s how I look at it.
I once listened to an episode of RadioLab on NPR that centered on the wisdom of crowds. They spoke of contests such as how many beans in a jar or the weight of a cow at a country fair. The individual guesses varied, and none were correct, however the average of the individual guesses was exactly correct, on the nose.
It was an interesting examination of society’s “hive mind” and how our combined thoughts act in nature much the same as an individual mind. If you believe there may be wisdom in the collective conscience then you should google it and give it a listen.
Lots of people figuring out “the rig” is in.
And that the “rig” is getting long enough in the tooth that they’re now at risk.
For me, this just reflects the overall S& P resetting a few times back to a rising 200 day SMA from a very high initial baseline. Has obviously happened before but probably not since 2010 after such a sustained period as the “Trump spike.”
I’d put it this way. You’d surely want to short a lot of things in early February. But after about 1 March only an idiot (IMO) would have been shorting US equities (as a whole) or anything highly correlated with them once the overall indices were closer to a strongly rising 200.
Also, probably reflects greater retail use of ETFs. Many ETFs are difficult to short through the equities markets. If the only momentum play at a moment is generally to be short then retail investor sits on the sidelines.
Also, very high intraday volatility in the indices during this time probably rattles a lot of swing-trade types out and they are waiting for things to settle down a bit I’d imagine.
The most overlooked aspect to all these indices is that they can be modified continually. A data point last month was not necessary calculated the same way a data point was this month. While the direction of the index may be correct, I wouldn’t trust much of anything else.
If you want to have some fun, go back and look at the different charts they published over time, and see if they still look even vaguely the same.
Instead of the “collective” or “individual” RETAIL Investors,it is better to follow the insiders.One prominent website mentioned,[ BEFORE THE FALL IN THE DOW ] that an Investment arm of a Legendary Banking House cashed out of the US Stocks just before the rate hikes and the consequent fall,in the Dow.
Also look at top executives leaving the firm, even if they have to pick a fight to get fired. Quitting or getting fired is a good way to cash out at the top. Getting fired has the added benefit of creating opacity to the process of bailing out.
Unreliable. For every “Legendary” insider well positioned just before a crash, there are 10 who aren’t. The winner only becomes obvious after the fact.
Why wouldn’t you follow the collective wisdom of the real “smart money”: the bond market? A historically very powerful leading indicator of recession has been a yield curve inversion in the US Treasury market. Every major US recession since at least the 1960s has been preceded it. I’m not willing to say “but, this time is different!” yet.
I don’t care to get trade frequently. Even if I’m on the right side of a short term trade, if I’m honest it’s more luck than brilliance on my part, and the short term capital gains tax negates most of the gain, anyways. I just dollar cost average in and hold, but I will sell and get defensive once the yield curve inverts. We’re not there yet.
Well…I would point out that the anticipation of major tax cuts (very good!) which was the major economic talking point of last year has the affect of driving demand for stocks (and jobs) while the major economic talking point this year has been potential trade wars (bad) which is viewed as risky for stocks (and jobs).
Last year investors expected Trump to REDUCE global tensions by reducing U.S. involvements overseas….yet this year, he has thrown in with neocons views on Syria/Iran, ratcheting up foreign involvement.
I would also opine that the prevailing “wisdom” is that the dollar is going to fall (despite the Fed raising rates…which will actually STRENGTHEN the dollar)….raises the profile of US inflation (which has been high for a couple of years but masked by various adjustments to the methodology being used) even higher than probably warranted. Since people equate high inflation with falling stock prices, they are trying to get out of the way….not understanding that the strengthening currency (vs. rest of the world) makes the U.S. stock market extremely attractive to the rest of the world contending with potentially large currency depreciation (i.e. Euro, EM currencies, Yuan, and Yen).
People are getting older, less anxious to take on risk, rather trade into cash, where they feel safer and needing to raise cash to pay taxes in April. Or a terrible thing is coming. I consider it more noise.
Maybe they’re are realizing that now it’s a better idea to buy risk-free 12-mo CDs or T-bills at 2.2% than the SPY ETF at a 1.8% yield and risk steep capital losses.
The “starved for yield” and “cash on the sidelines” meme promoted by CNBC is long in the tooth.
Here is my take: As individuals, it’s been my experience that individual retail investors are usually wrong reactionary lagging indicators.
But as a group, it is hard to ignore the “Wisdom of the Crowd”.
///
This looks like a past 3 months rolling average on crypto going down (Bitcoin futures fiasco?). Peak at December, and then downhill.
Just a wild guess though…
///
Can you tolerate market losses on the order of 60% over the next few years?
There is no “getting out of the market” in aggregate; every share is held by someone at each point in time. The question is, will it be you that holds it during that 60+% loss?
Seems like retail investors make up a relatively small segment of the equity markets nowadays. Most of the upside support in stocks is generated by bots and corporate buybacks.
Institutions and retail investors have been net sellers for years while corporations have offset their selling by buybacks.The first months of this year set a new record for corporate buybacks.
While most indicators show mixed results,the trend in total worldwide holdings by central banks is the one indicator is both logical and almost infalliable in its correlation to the market.By the end of the year, central banks will be at best increasing their holdings only slightly and at decreasing them at an increasing rate
Atlanta Fed GDPnow started quarter at 5.7% growth estimate? Don’t need a weatherman to tell which way the wind blows! We recession in silence.
One thing that occurred to me …
The retail investors here don’t really move the stock price, but they would certainly respond to price levels.
Perhaps when the tax cuts passed, retail investors thought it wildly bullish at first, but then began to cash out in droves as the stock prices shot ever higher.
I don’t think you can read into it much more than that. The real market mover today is worldwide central bank liquidity, nothing else matters at current valuations.
In January-February TD completed its merger with (large) Scottrade. Could this have skewed the readings?
No. Unrelated.