And look what happened to per-capita mortgage debt.
Growing consumer debt is the Holy Grail. Since household incomes have not kept up with consumer price inflation, and since college and medical expenses are on a runaway train, and since rampant asset price inflation has whipped housing costs into frenzy, the economic leadership in the US wants consumers to pay for it by taking on more debt.
Alas, after the Financial Crisis, consumers began paying off some debts and defaulting on others, causing big ripples in this elegant debt-driven rather than income-driven economic model. And it kicked off the race to get consumers back into a borrowing binge.
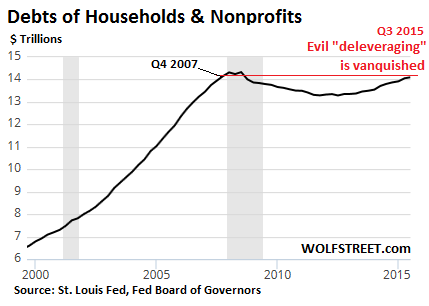
By now, this evil deleveraging has been mostly vanquished. The chart shows debts of households and nonprofits, which the Federal Reserve tosses together into one bucket. From the peak in Q3 2008 of $14.1 trillion, household debt began to dip during the Financial Crisis, bottomed out at $13.3 trillion in Q3 2012, and has been rising since, reaching $14.1 trillion in Q3 2015, back where it had been during the halcyon days of 2008:
The American Dream of debt is back. But the dynamics have changed. Deleveraging in mortgage debt kicked off with people defaulting on their mortgages during the Financial Crisis, which slashed mortgage balances outstanding. And it continues through the massive influx of cash buyers and investors.
When investors that buy and then rent out properties borrow against these assets, those debts don’t show up in household debt. And foreign homebuyers, such as wealthy Chinese who want to get some of their assets out of harm’s way and have a place to escape to when things get ugly, don’t figure in the data set of US household debts either.
Households are now making up for this hole in mortgage debt by piling on other forms of indebtedness: auto loans and student loans. Each category now exceeds $1 trillion.
However, growth in credit card debt has been stymied by consumers’ stubborn belief, picked up inexplicably during the Financial Crisis, that maxing out credit cards and paying 15% or more in interest in a zero-interest-rate environment is a lousy deal.
But household debt per capita, given the growth in the US population over the years, hasn’t moved in parallel with overall consumer debt. Turns out, on a per-capita basis, consumers are still getting more prudent about debt – to the greatest dismay and frustration of the Fed, other elements of our fearless economic leadership, Corporate America, and foreign manufacturers.
This is the case in many states – that households on a per-capita basis continue to deleverage. But there are some states where per-capita household debt has reached new all-time highs. And the biggest shining example of this isn’t California!
Of the 25 states with the most indebted households, according to New York Fed data, one thing sticks out: in most of these states, overall per-capita household debt (mortgages, student loans, credit cards, and auto loans) is either still declining or flat, and often significantly below the peak of 2008.
But there are four exceptions where per-capita household debt is now near or above the levels in 2008: Wyoming (about flat with 2008); Vermont (about flat with 2008); Alaska (slightly up from 2008); and Washington D.C….
In Washington DC, per-capita household debt is the highest in the nation. It’s the clear winner in the series. The Fed should be proud of those households.
OK, Washington D.C. isn’t really a state and doesn’t have rural populations. But this is what households accumulated on a per-capita basis: mortgage debt of $58,930, credit card debt of $3,470, auto loan debt of $2,420, and student loan debt of $11,260 (per capita, not per student!), for a total per-capita household debt $76,080.
This is up 3.8% from 2008. But mortgage debt, thanks to cash buyers, is down 1.5% and credit card debt is down 10%(!). Auto loan debt is up 8% and student loan debt is up 52%!
Maryland is in second place in terms of per-capita household debt, with a total of $63,300 – down nearly 8% from 2008!
In third place? My beloved and crazy California.
On a per-capita basis: mortgage debt of $51,850, student loan debt of $3,890, auto loan debt of $3,420, and credit card debt of $3,050, for a total per-capita household debt of $62,210.
This is down a whopping, Fed-defying 22.5% from $80,260 in 2008. Back then, California was number one in the nation in terms of per-capita household debt. The financial crisis was hard on Californians. Its economy crashed. Housing crashed. All kinds of booms and bubbles crashed. And the government went broke and had to issue official IOUs to its suppliers.
Some inland parts of California are still facing economic troubles. The four-year drought, now hopefully ending, has wreaked havoc in the Central Valley. But the Bay Area and the Los Angeles area have been booming: tech companies, startups, housing, construction, commercial property… they’re all floating on a sea of money from all over the world – though we’re seeing signs that some of this money is receding now.
The influence of cash buyers and investors on per-capita mortgage debt? Despite home prices that have raced out of reach for many people and now exceed in many cities the peak of the prior bubble, per-capita household mortgage debt has plunged 26%! Yup.
Enjoy reading WOLF STREET and want to support it? You can donate. I appreciate it immensely. Click on the mug to find out how:

![]()
The story for Alaska is actually a fairly simple narrative. There are a few private industries which support the state economy and its 750k population (entire state); mining, fishing, lumber, oil, and tourism. However, the is another, bigger, industry which is government and much of its employment has been disconnected from the crash of ’08 – thus the failure of debt to default – and the persistence of high prices in things such as real estate.
In fiscal year 2014, total estimated spending in Alaska amounted to $11.6 billion. Alaska also had the highest state debt per capita in the nation at $40,714. That is also the highest per capita spending in the US.
http://kff.org/other/state-indicator/per-capita-state-spending/
All of this was on the back of oil prices.
That is going to change though with depressed oil prices, an epic state budget mess, one of the most underfunded pensions, and topped off with the possible introduction of all kinds of new taxes – none of which can plug the gaping hole due to overspending. One example is the re-introduction of a state INCOME tax of 6% – to help plug a 3.5 billion dollar hole, which will raise an estimated … wait for it … 200 million bucks. But, the admin costs to make it happen are 15 million, or 7.5% of the take.
They are going to crush the private industries, trying to support the state government, and the blow up in real estate and other stuff is going to be EPIC. It is already very expensive to live in Alaska, so this is going to force a lot of folks to simply move, a trend that is already deeply evident in the 40-something demographic raising kids.
The reality is that oil fields, if properly managed, decline at 5% to 7% a year. And with the change in how Alaska takes its cut, those revenues can’t be replaced. For more info, read “The Last Alaska Barrell” by Miller.
Alaska is going back to being a territory.
Regards,
Cooter
Thanks for the info. Nice to get an unseen perspective.
Cooter, do you know if the population of Alaska is declining (i.e. people leaving to find work elsewhere)? This could explain why per-capita household debt is rising.
If the population is increasing AND per capita household debt is rising, even while the economy is getting hit by oil – that would be a huge rad flag.
Thanks for your report on Alaska.
I just hit the state labor website and easily pulled the info you want. I sourced from here:
http://laborstats.alaska.gov/census/hist.htm
The data 1990 and prior was all in a single PDF, where as 2000 and 2010 I had to hit the census report. Everything was right off the link I gave you and took maybe five minutes. Don’t think I misread anything. Here are the results:
YEAR POP Delta vs Prior Decade
2010 710,231 13%
2000 626,932 14%
1990 550,043 37%
1980 401,851 34%
1970 300,382 33%
1960 226,167 76%
1950 128,643 77%
1940 72,524 22%
1930 59,278 8%
1920 55,036 -14%
1910 64,356 1%
1900 63,592
Figures are state wide total population.
If you need any more info, let me know.
Regards,
Cooter
Great. Thanks.
It is actually even worse when you look at how much employment is directly government. If you total up Fed, State, Muni, and Tribal, you can easily hit 25% in major cities, some going upwards of 40% or more. That is why state government spending per capita is so high.
Also of note is the exodus of late 30-somethings/40-somethings and their offspring, while the older age brackets continue to grow. Young people love AK until they get married and face the reality of raising kids. So the growth is NOT evenly distributed – it is actually further exaggerated in specific demographics.
The state gets 90% of its general revenue from oil royalties/taxes/etc, so … it isn’t hard to figure out how this story ends (if oil doesn’t go back up) … particularly with the grossly unfunded state pension for all those current/former government employees.
Regards,
Cooter
“elegant debt-driven rather than income-driven economic model”
Nuff said.
Happy holidays.
Residents of Washington D.C. and Maryland are largely employed by the federal government. Up until now, they can’t be fired and many make 6 figures for worthless work. So no surprise the borrowing there is higher than national average.
DC has also witnessed a huge increase in cost of rent and a subsequent drop in Black residents, from over 70% in 1970 to under 50%, latest figures. The young white professionals who have moved in brought the high college debt with them.
I think that DC was the only area in the US where real estate prices did not decline in the crash of 2008.
It’s not surprising to see Texans tops in auto loan debt per capita. They will trade for a new pick-up truck at the drop of a ten gallon hat.
The anomaly of per capita debt in Wyoming is easy to understand when you understand that it is a largely rural state with low population containing within its borders a city/state with a totally different economy. Teton County Wyoming (Jackson Hole) is among the top two or three richest enclaves in the US. And the class divisions are far more stark than anywhere else in the country. The Rulers don’t bother with loans when they build their $20,000,000 cabins for use at Christmas and occasional golf weekends in the summer. And the servants who build them and wash their dishes can’t afford to rent a place of their own, so they live 6 to a room until they are caught and shipped back to Mexico or their temporary work visa runs out and they go back to Romania.
Wyoming is a funny place. The percentage of government employees is the highest in the nation (possibly excepting Alaska) yet it is also the most conservative state. Apparently being conservative does not mean you don’t spend taxpayer dollars. They get a lot of income from mineral severance taxes (that is, out-of-state consumers of Wyoming coal and minerals pay for state government) and they even stash some away in a mineral trust fund so the state finances are in good shape with little pain, yet they still have raised taxes recently. It’s a racket like any other state. You have to be a scumbag to be in the legislature, if you ask me.
I guess it’s not a surprise to see my current home “state” of DC as number 1 here. We have a huge influx of millennials moving here because it’s suddenly a cool city. DC has all the elements of the equation here for high debts : high priced housing, a well educated population (read: student loans) and a crappy and unreliable public transportation system that means many don’t give up their cars. Plus there seems to be a lot of “keeping up with the Joneses” in the form of material items so I guess that’s our credit card debt for you.
I hate debt. But I’m a child of Depression babies. We learned how to scrimp growing up in the 70’s.
Sooner, or later the DEBT party stops. Then, who pays? right…
Pretty obvious that the people in DC know that EVERYBODY ELSE pays when the music stops, so they party on!
And Colorado? Things are booming here, now I know why.
It is very interesting if you consider the political “leanings” of the states with the highest debt per capita (especially how California & Colorado sticks out amongst the rest of the West, Minnesota & Illinois vs the rest of the Midwest and the stark contrast between Maryland and neighboring West Virginia).
Colorado…yuck! Have lived here my entire life, and now looking to get out. Used to be a great place to live – but no more. Starting to really resent the culture of this state. The weather is pretty nice here, but I’d say that’s about it.