We’re sending more kids to college, but does the economy create good jobs for them?
By Larry Kummer, editor of the Fabius Maximus website:
I will perform an unusual magic trick for you using the employment report. Rather than transforming something mundane (a bird, a hat, cards) into something spectacular, I will transform the spectacular October employment numbers (now sparking a thousand excited articles) into something mundane.
October’s non-farm payroll gain (aka the Current Employment Survey) was a blockbuster at 271,000, vs. the 3-month average of 187,000 and the 12 month average of 230,000. Better yet, it was a big “beat,” with Wall Street economists expecting 150,000 to 200,000.
See this wonderful result on the graph of percentage change in jobs year-over-year, not-seasonally adjusted. Since the population grows, the percent change better shows the rate of improvement over time:
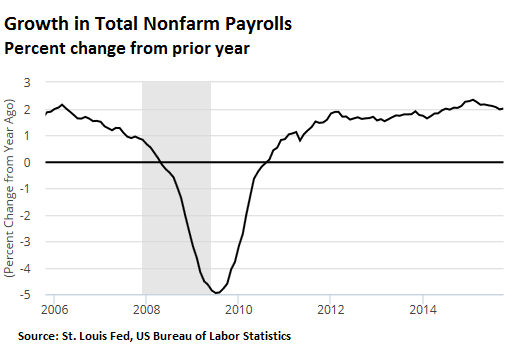
Not much change, is there?
Monthly jobs, like many economic statistics, are volatile and heavily revised afterwards. The seasonal adjustments necessary to understand the month to month changes are problematic (they’re volatile, too). But the gigantic US economy is like a supertanker: it changes direction only slowly — as seen in the trend of year-over-year numbers. A legion of economists and business journalists are paid to transform the short-term statistical noise into entertainment for readers.
Seeing the new America in the details
Where is the job growth? The answer tells us much about America. Despite claims of the growing government, their Federal, State, and local workforce has grown only 0.5% YoY (mostly from jobs in education).
We’re told the future lies in the information industries (as it was “plastics” in 1963’s The Graduate). But that’s only for a few. Jobs in the Information sector grew 1.6% YoY, but only to 2,797 million (2.0% of all jobs). Jobs in the Computer Systems Design and Services industry (part of the Professional and Business Services sector) grew 5.6% YoY — but only to 1.9 million (1.3% of all jobs).
Where are the new jobs? In the Prof & Biz Services sector look to the Administrative and Waste Services industry: up 2.2% YoY, to 9.1 million jobs (a gain of 196,000 jobs). Better yet is the Leisure and Hospitality sector: up 3.0% YoY (438,000 new jobs). The hot dot in that is Food Services & Drinking Places: up 3.4% (374,000 new jobs).
We are sending more kids to college, but is the economy creating good jobs for them?
About the rush to raise rates
In a typical recovery by now the Fed would be raising rates to prevent the economy from overheating. The Fed governors, their thinking rooted in the past, clearly want to do so. But the inflation metrics show no heating (let alone over-heating), with the YoY CPI below 2% since May 2012 (excerpt for 3 months).
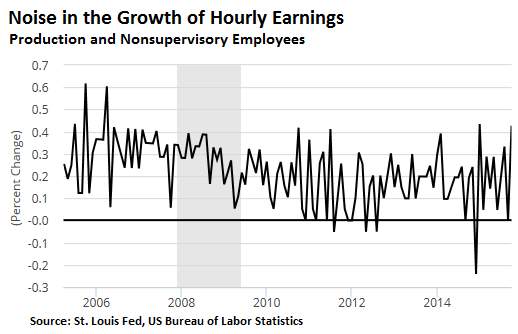
The October jobs report confirms the cool economy. Look at wages and hours of production and non-supervisory workers in the private sector (seasonally adjusted).
- Change in average weekly hours YoY: zero (33.7 hours).
- Change in manufacturing overtime: -0.1 hours (to 4.3).
- Change in weekly earnings: 2.2% (to $713.77, up 1.3%/year over 5 past years).
The MoM changes in earnings were impressive (+4.4% SAAR for all employees, +9.1%). But these numbers are very volatile, and the many similar pops of the past six years proved fleeting. I suggest waiting to see if this is a blip, or a trend:
The wage numbers are important because the Fed gets excited by rising wages (aka “wage inflation”), as the Fed serves America’s corporate elites — who want to capture, not share, the gains in productivity.
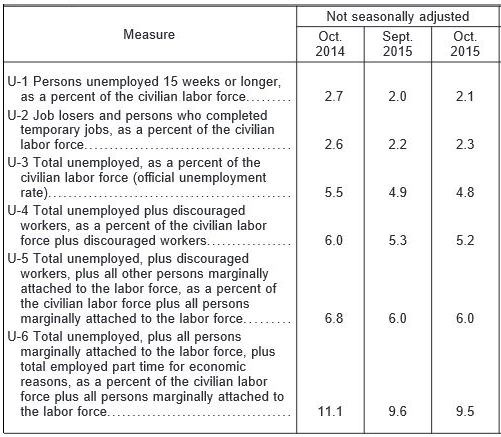
About the real rate of unemployment
Measuring the complex US economy is like counting apples. Whatever the “true” and hotly disputed employment numbers are, the Bureau of Economic Statistics provides six versions. Each has its use; none is more correct than the others. And all of them have dropped during the past 6 years.
Follow the trends, not the noisy short-term data.
Nothing unusual happened in October. The data is consistent with other recent data showing weakness in manufacturing and commodities, but strength in the far larger service sectors. The Fed might use this report as an excuse to raise rates.
But the big picture shows a slowing economy, with the strong dollar depressing exporting industries. Unless these things change, any Fed rate increases will be small and quickly reversed if the slowing continues. So on Wednesday, Janet Yellen told a House committee that “Potentially anything – including negative interest rates – would be on the table [if the economy were to] deteriorate in a significant way.” By Larry Kummer, editor of Fabius Maximus
So, given Yellen’s admission, expect the unexpected. Read… What Will Cause the Next Recession?
Enjoy reading WOLF STREET and want to support it? You can donate. I appreciate it immensely. Click on the mug to find out how:

![]()
…with the strong dollar depressing exporting industries
Not to mention a global slowing just about everywhere across just about every sector.
Consistent with with Wolf has been reporting about the massive slowdown in China’s port traffic, WSJ reported the other day that the Dutch shipping giant Maersk announced layoffs and cancelled orders for XXL container ships.
In the Good News department, the new James Bond flick is out today…
BradK,
A cautionary note: data about transportation costs are both volatile and notoriously difficult to interpret. IMO it’s among the least useful of economic metrics. As a warning, see the frequently wrong interpretations of the Baltic Freight Indexes.
We use it because it is both hard and relatively real-time. But it should be used to validate trends visible in more reliable metrics, imo.
As for China, it’s important to the world economy is exceeded by the mystery of its economy. Again, be cautious.
For a reliable indicator of US freight activity, I recommend the DoT’s Transportation Services Index. The Freight index has been flat since Octo 2014.
It also shows the usual relationship between data timeliness and reliability: we’ll get the September data on Nov 15.
Here’s the graph (click on the legend at the top to add/delete a series):
http://www.rita.dot.gov/bts/transportation_services_index
Transportation costs are a function of supply (such as container ships) and demand (need by shippers to send their stuff somewhere else). In the maritime container trade, there has been a gigantic and growing oversupply of ships that is now meeting very lackluster demand. As a consequence, rates have collapsed.
Transportation rates must always be looked at as a function of at least these two factors (and there are more factors). So rates are critical in understanding the market, just like oil prices are critical in understanding the oil market (where there is a similar problem of oversupply and lackluster demand).
Rail transportation volumes have been sliding during 2015 in most freight categories, but prices increases hid this slowdown, as carriers were able to increase rates for captive shippers, at least up until recently.
At lot of locomotives, equipment and crews are now being idled and storage trackage is going at premium rates.
Stop beating up on the college kids. They are hiding out on the college campuses because there are no jobs of any kind for them. It is easier to be a perpetual student than a 25 year old who has never held a job. They don’t hire anyone for a low wage job anymore unless they speak a foreign language.
My son can build computers from scratch including installing multiple partitioned systems on them, and they won’t hire him to sell cell phones in the mall. In Miami more than half of the jobs require you to speak a foreign language, including janitorial work. The real unemployment rate is a lot higher probably 25%. Everybody knows people who have been looking for work for years. Trump is doing well with voters, because he is the only one who has any idea what is really going on in the economy, and is willing to tell the truth.
94,513,000 Americans Not in the Labor Force; Participation Rate Again Matches 38 Year Low
http://www.breitbart.com/big-government/2015/11/06/94513000-americans-not-labor-force-participation-rate-matches-38-year-low/
Good stuff sir
Antidote to the usual cheerleading
Thx
Here in UK and as I always say to anyone who’ll listen, the fact that people have a right to work doesn’t mean it is compulsory for others to employ them.
I have been self-employed, running my own business, for 40 years which apart from the first few years after leaving school is the whole of my working life so far. (Only another 50 years to go.) In the 1970s there were only about 1.5M self-employed people in the UK, now it’s around 5M.
The snag with increasing numbers of people going it alone is that our collective discretionary spending power dilutes demand for goods and services. Combine that with the relatively low rates of pay that others have to live on and it is hard to see where the future economic growth is going to come from without resorting to deeper levels of indebtedness.
Turnover is vanity, profit is sanity.
From Jobenomics blog 2nd Quarter review:
“Sooner or later, the American people will figure out that it is theoretically possible for the United States to have a zero rate of unemployment while simultaneously having zero people employed in the labor force. ”
The 3rd quarter review has been out and is probably one of the most readable analyses of unemployment landscape in the USA.
http://jobenomicsblog.com/jobenomics-u-s-employment-analysis-q3-2015/
Lots of local employers are looking for college educated people with skills, not language, but kids want big city life(Denver, etc).
My community of 125,000 just isn’t good enough for those indebted punks
Where are you? Somehow your comment doesn’t ring true. Most of these kids are connected on the internet and physical location is not that important to them. Can you give an example of job and pay?
Moreover, a lot of these jobs went to oldies (see zerohedge).
I think that hints to the sickness of prolonged ZIRP policies. A 60 y.o. previously with $1m in cash might have earned $50k say from interest, whereas now it’s next to nothing. This may explain why these older people are re-entering the workforce.
The same low interest rates also make it very hard for young people to save effectively (e.g. to buy a house). Part of the reason more and more 25 year olds are at home in their mum’s basement!
The bigger picture is the solvency of the pension/retirement system under ZIRP (or heaven-forbid, NIRP!)
Oh dear!