The US Gross National Debt, that monster that keeps ballooning so much faster than our infamously slo-mo economy, just jumped by $340 billion in one day.
The debt ceiling was hit in March, and from that point forward, the Gross National Debt was stuck at about $18.15 trillion, give or take a couple of billion. But the government continued spending the money that Congress had told it to spend, though Congress also told the government not to issue more debt to pay for this spending. If this sort of debt-ceiling fight looks like a Congressional charade to the world outside the Beltway, it’s because it is a charade.
So instead of issuing new debt, the Treasury relied on “extraordinary measures,” taking the money it needed from other government accounts, robbing Peter to pay Paul so to speak, and ended Fiscal 2015, on September 30, with a total Treasury debt outstanding of, well, the same $18.15 trillion.
That remained the Gross National Debt until just now. In late October, Congress agreed to raise the debt ceiling and end the charade, days before the out-of-money date, as everyone knew it would. The Treasury then embarked on a flurry of activity, undoing these “extraordinary measures” and going on a debt-sales binge. Now it made the accounting entry – adding $340 billion in one day to the Gross National Debt, bringing it to the new phenomenal level of $18.492 trillion.
Over fiscal 2015 plus October, the Gross National Debt rose by $668 billion, up 3.7% over the period, growing nearly twice as fast as GDP, which edged up from Q3 2014 to Q3 2015 a measly 1.95%.
This leaves the Gross National Debt at 107% of 2014 GDP and 105% of estimated 2015 GDP.
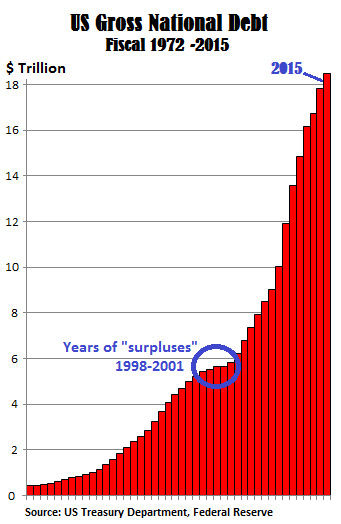
This chart shows the peculiar fiscal condition of America over the years: Since 2002, the government has borrowed $12.7 trillion, or two-thirds of the total debt! Since 2008, it has borrowed $9.5 trillion, or about half of the total debt, the biggest “stimulus” package of all times:
But here’s the thing: the official government “deficit” for fiscal 2015, based on government accounting, was “only” $439 billion. In other words, it took $668 billion of real hard debt to pay for $439 billion in government-accounting deficits.
This isn’t a one-time discrepancy but an ongoing pattern. In fiscal 2014, with an official deficit of $485 billion, the Gross National Debt soared by $1.1 trillion. Both, fiscal 2014 and 2015 combined, sported an official “deficit” of $924 billion. And it took $1.75 trillion in new debt – almost twice as much – to pay for it!
And look: the US, had four years of official “surpluses” between 1998 and 2001 that at one point exceeded 2% of GDP. They should have brought down the Gross National Debt by the amounts of the surpluses. But not these “surpluses!” Instead, the debt increased in every one of those four years, in total by $394 billion. That’s how much real debt it took to cover these government accounting “surpluses.”
So when we lament corporate accounting games, financial engineering, and balance-sheet strip-mining that companies use to pull a bag over all-too-willing investors’ heads, we should remember that there’s something even shadier: government accounting.
Enjoy reading WOLF STREET and want to support it? You can donate. I appreciate it immensely. Click on the mug to find out how:

![]()
Looking at that exponential wall makes me wonder how much longer this charade can be maintained.
No doubt to boost the stock market.
It’s only paper or virtual digits floating around in cyberspace. They’re valueless and not worth anything. For sure one wouldn’t call them real wealth.
Because real wealth can’t be printed or folded and is measured with a scale and comes in grams, ounces and kilos. Not govt approved and specially inked paper or worse yet, virtual digits credited to one’s account, based on debt, fraud, lies and illegal and Unconstitutional banking schemes perpetuated by those higher ups both in govt and finance that should (and do) know better.
That is why we don’t trust politicians and why we don’t bother to vote because no matter who you vote for they all end up being Irresponsible we pay the price and they get away with it. So wrong
The problem is that at some point those who own a piece of the “digital currency” will be looking to redeem it for something of value.
They’re doing it now. Commodity prices are down so North Dakota soil is appearing on the market. Local bankers say the buyers are from the East Coast. Farmland is currently considered to be the best hedge against any calamity. That is, until there’s a drought or a huge surplus of product. With the U.S. dollar continuing to climb in value vs. the other commodity nations like Brazil, Canada, Australia; their exports will ship before ours.
Marty,
I need to check out the current market for ND farmland prices, but I’m sure that there’s pressure to sell some acres to cover expenses.
Last week NDSU posted this: In 2015, farmers in the Red River Valley lost on average $50 to $60 dollars per acre on wheat (mostly spring – not winter) and soybeans, and they lost $100 per acre on corn! NDSU forecasts Ag prices for next year at $5.30 for spring wheat, $8.00 for soy & $3.60 for corn. At these prices, farmers might come close to break even on HRSW, but they’ll lose a bit on soy and corn.
On 10 April 2015, NDSU put out this land value guide, from which I’ve selected the highest priced section, the South Red River Valley:
2009 – $1,992 per acre
2010 – $2,136
2011 – $2,628
2012 – $3,083
2013 – $4,180
2014 – $4,319
2015 – $4,340
Farmland is currently considered to be the best hedge against any calamity.”
they’re not looking for a hedge. they’re looking for control. they’re buying the farmland so they can leave it fallow.
That that mean we are only a few year away for the debt to reach 1 quadrillion dollars.
As James Rickards from Currency Wars and the Death of Money explains it.
“The U.S. treasury has issued over 18.4 trillion dollars of debt in the form of bills, notes, and bonds. Compared to about 4 trillion in money notes issued by the Fed. Unlike Federal Reserve notes, Treasury notes are not thought of as money. Another difference is treasury notes have maturity dates and pay interest. Fed notes can be issued in indefinite quantities and remain outstanding indefinitely, but treasury notes are more subject to the discipline of bond markets, where investors trade 500 billion dollars in treasury securities….every day.
The Fed prior to 2010 would customarily pay its profits from collecting interest received on Treasury bonds back to the Treasury. Yet, with the slow down and reversal of QE, the Fed needed a solution to hide its balance sheet. When the Fed starts to sell the Treasury bonds, it will lose money on every sale. In order to keep the balance sheet of the Fed a secret and not public knowledge, the Fed and Treasury came to an agreement. They set up a “Liability account” basically an IOU, in that the Fed keeps the cash acquired from the interest on Treasury bonds and uses it as capital, thus maintaining the image of solvency. But in reality the Fed is just increasing the amount of IOU’s to the Treasury and is truly insolvent!”
The United States now has a system in which the Treasury runs un-sustainable deficits and sells bonds to keep from going broke. The FED prints money to buy those bonds and incurs losses by owning them. Then the Treasury takes IOU’s back from the FED to keep the FED from going broke.
The FED and the U.S treasury resemble two drunks leaning on each other to stay upright, and what a sight it is!!
This is “common” knowlegde for anybody with an IQ superior to his shoe-size. Therefore, GET OUT of the fiat-money system while you can. Buy precious metals or land ( keeps its value but is not “transportable” ), guns and ammo, a generator and fuel, ….. all the rest is SOB ( standard operational bullshit ).
Another fun formula to play with is the PDS framework (Primary Deficit Sustainability). Simply put, this framework measures whether the current National debt and deficits are sustainable or not. PDS is a method to determine if the U.S is becoming say….. Greece. The key factors in the PDS framework are as follows.
•B = Borrowing costs
•R = Real output
•I = Inflation
•T = Taxes
•S = Spending
Together, they form the acronym (BRITS).
R + I = The total value of goods and services produced in the U.S. economy, AKA nominal GDP, or (NGDP)
T – S = The primary deficit. By definition it is the excess of what a country spends over what it collects in taxes. In this calculation, spending (S) does not include interest paid on the National Debt. This not because interest expense does not matter, it matters a lot! In fact the whole purpose of the PDS framework is to illuminate the extent to which the U.S. can afford the interest and ultimately the debt. Interest is excluded from the primary deficit calculation to see if other factors combine in such a way that the interest is affordable. Interest is taken into account in the formula as “B”.
B = Borrowing costs. Interest on the National Debt.
In plain English, U.S. deficits are sustainable, IF economic output (NGDP) minus interest expense (B) is greater than the primary deficit (T – S). This would mean the U.S economy is paying interest and producing a little extra to pay down debt. But if (NGDP) – (B) is less than (T-S) then overtime the deficits will overwhelm the economy and the U.S. will be headed for a debt crisis, even possible financial collapse. To a point, what matters is not the debt and deficit level, but the trend as a percentage of GDP. If levels are trending down, the situation is manageable, and debt markets will provide time to remain on that path. Sustainability does not mean that deficits must go away; in fact deficits can grow larger. What matters is that total debt as a percentage of GDP becomes smaller, because nominal GDP grows faster than deficits plus interest.
So what does our economy look like in the PDS, BRITS framework? As of 2015 it looks like this.
1.5%(R) +0% (I) – 2.2%(B) = -.7% (T-S) = 2.5%.
-.7% is < 2.5%. Indicating U.S. deficits are not sustainable. To achieve sustainability either -.7% must go up or 2.5% must go down, or both. The math is basic but rigid. If (R) is 1.5% and (T-S) is 2.5% and borrowing costs will not go lower, then the only path to sustainability is for the FED to raise inflation (I) above (B). Of course inflation tends to increase borrowing costs, a good example of feedback loops within the BRITS. In theory the FED could cap (B) at 2% and raise (I) to 3%. This is why we always hear Old Yellen and friends yapping about this magical 2% inflation target that they are hell bent on achieving!
By using PDS and BRITS it is possible to see the unavoidable policy solutions. In the absence of higher real growth, either Washington must reduce the primary deficit or the FED must produce Inflation. There is no other way to prevent a debt crisis. I'm not a betting man,but the idea of Washington reducing the primary deficit is not a bet I would take. That leaves the night in shining armor (The FED) to come to the rescue, armed with their financial weapons of mass destruction. Inflation or BUST!!!
you’re missing the real point. the u.s. dollar is not fiat currency. it is fiat debt currency, with interest. when the fed prints more dollars, that is not inflation. it is deflation, with them owed and us owing.
The graph shows the well known exponential function.
Compound interest is an exponential function.
Exponential functions look quite ordinary until they begin their rise to infinity, which is what is happening on the graph.
Keith
TPTB have lost their grip of reality. Worldwide debt is out of control. 12 years ago Warren Buffet wrote this piece http://www.freerepublic.com/focus/news/1053684/posts about profligate countries, namely the USA. It’s taken time. Since the 1960’s the US has had only 5 years of surpluses. We cannot spend money like drunken sailors forever. The market will school the USA soon IMHO.
JM
“TPTB have lost their grip of reality.”
you don’t get it. their grip on reality is fine. they are increasing their grip on us. that’s all. that’s the whole point of what they’re doing.
So nearly doubling the debt in 8 years while the economy barely grew is no problem? I should have used a log chart. It would have reduced the soaring debt of the last eight years to a fraction of its ballooning size. And we all could sleep better, right? The debt is just the chart’s fault. There’s really nothing to worry about. Choose a different chart and make the problem go away. Gosh, why didn’t I think about that sooner.
With North Dakota’s extreme climate, I wonder what those investors on the Dirty Side (as opposed to the Shaky Side) are thinking. The big crop up there is sunflowers. Maybe they’re hoping for the future of shale? Who knows? A trillion here a trillion there, pretty soon it adds up to “real” money. The hangover on this is, like Jimmy Buffett says, “a commode hugging drunk”.
This nation has gone off the deep end on debt! Those ‘Years of surpluses’ from 1998 to 2001, were not really surpluses as much as they were accounting tricks by Clinton to put off future liabilities from current books, but at least it looked good until W. took office.
The CBO has declared the the USA will have a debt to GDP ratio higher than 100% for at least a decade to come. This $18.5 T monkey on our backs is bad enough to finance in today’e ZIRP land of make belief where yesterday’s T-Notes closed at 0.4% on 1 year, 0.84% on 2, and 1.16% on 3.
Compare these numbers to those the Treasury had on 2 January 2007 where 1 year Notes were 5.0%, 2 were 4.8% and 3 were 4.71%. Someday, sooner or later, there will be hell to pay. David Stockman has much to say about where the two-fold ambush of the Fed’s $4 T helicopter money and the Treasury’s never ending deficits will lead us, and it’s not good.
My initial reading of this post was just to glance at it because it old news that the debt is rising exponentially. But now that I have had a chance to read it carefully I have concluded that this may be one of Wolf’s most important posts – they are all good, its just that some are really good and very important, and this is one.
I have been aware that the activities of the deep state are so secret that they do not need to be authorized, approved or sanctioned in any manner by Congress. Nonetheless, even though the US government that has difficulty agreeing to fund entitlement programs, e.g., Social Security and Medicare. it never seems to have any difficulty whatsoever in providing the funding for deep state activities, and never demands an accounting.
Wolf notes
“the official government “deficit” for fiscal 2015, based on government accounting, was “only” $439 billion. In other words, it took $668 billion of real hard debt to pay for $439 billion in government-accounting deficits.
This isn’t a one-time discrepancy but an ongoing pattern. In fiscal 2014, with an official deficit of $485 billion, the Gross National Debt soared by $1.1 trillion. Both, fiscal 2014 and 2015 combined, sported an official “deficit” of $924 billion. And it took $1.75 trillion in new debt – almost twice as much – to pay for it!”
The only explanation that readily comes to my mind is that the money is the funding for our secret deep state activities. These activities are not mandated by the Constitution, the budget, or any legislation. They just exist because of some anonymous appointed officials. I suspect they are kept secret from most if not all elected officials.
From January 2002 October 2015, which coincides with the ramping up of activities related to the Patriot Act, “(s)ince 2002, the government has borrowed $12.7 trillion, or two-thirds of the total debt! Since 2008, it has borrowed $9.5 trillion, or about half of the total debt.” If the pattern that Wolf discovered for the last 2 years is applicable for the entire period since 2002, about half the $12.7 trillion were expended on deep state activities.
Since there is no apparent willingness to rein in ever increasing deep state activities and their costs we are indeed in a quandary.
.
These “deep state” activities are probably: slush funds for high level crooks to steal from, creating/training/arming terrorist groups, and last but not least Israeli Zionist agenda. Remember how Rumsfeld announced the Pentagon “lost” a trillion dollars? Remember the date? Yup, sept 10, 2001.
“These ‘deep state’ activities are probably: slush funds for high level crooks to steal from”
heh. such a small perspective. “slush funds”? all of humanity is their slush fund.
What is the excuse the government gives for discrepancy between the “official deficit” and the ‘actual’ increase in the national debt?
How do they justify the accounting trick?
simple. do you want a paycheck or not?
Wolf, you are right “that there’s something even shadier: government accounting.”
It is through sleigh of hands that today the published gross national debt is only 105% of estimated 2015 GDP. This is because this reflects only the funded debts.
Add in the mind-boggling $222 trillion of ‘hidden’ unfunded fiscal gap, like long term liabilities owing to 78 million baby boomers for Medicare, Social Security and Medicaid and the total debt to estimated 2015 GDP soars to 1365%. Unbelievable? Then watch this:
https://www.rt.com/usa/debt-crisis-us-kotlikoff-535/
And to add insult to injury, on Sept 10, 2001 the Pentagon announced that it could not account for $2.3 trillion which was missing. Today that amount has shot up to $8.5 trillion. For over 14 years the Pentagon’s books have been audited but they always failed the smell test.
“Looking at that exponential wall makes me wonder how much longer this charade can be maintained.”
as long as water comes out of the tap, food is in the stores, fuel is in the gas pumps, and entertainment is on tv.
when that will stop … no idea. should have stopped already, but like the energizer bunny it just keeps going and going and going. suppose we should be glad, but ….