Soaring US crude oil inventories.
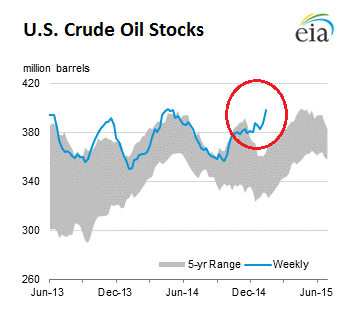
Crude oil inventories in the US (excluding the Strategic Petroleum Reserve) rose by 10.1 million barrels to 397.9 million barrels during the week ended January 16, the EIA reported on Thursday. Inventories have now reached 397.9 million barrels, the highest level for this time of year in “at least the last 80 years,” or as far as the EIA’s records go back.
This chart by the EIA shows that current inventory levels (blue line) have been on a terrific upward trajectory that defies the 5-year range and seasonal movements.
These ballooning crude oil stocks will exert further downward pressure on prices.
What I’m scratching my head about is what these speculators are thinking when they’re leasing tankers to fill them up with “cheap” crude, waiting for the price to rise. Leasing a tanker is not free, unlike borrowing money overnight. And there are plenty of other costs and risks involved – including already ballooning inventories. Who the heck is going to buy all this crude out of storage when production is soaring faster than demand?
But their thinking has gotten a lot of press recently which makes me think that they’re trying to lure others into that trade for reasons of their own.
But there is a bitter irony: The plunge in the price of oil is pushing desperate drillers, buckling under their debt, to maximize production from existing wells while slashing operating costs and capital expenditures. BHP Billiton, perhaps unwittingly, explains this irony: despite the oil glut, collapsed prices, layoffs, and shuttered facilities, US oil production is soaring and will continue to soar, at least for a while. Read… Why the Great American Oil Bust Will Be Long & Painful
Enjoy reading WOLF STREET and want to support it? You can donate. I appreciate it immensely. Click on the mug to find out how:

![]()
And with Iran production coming on stream within 2 months, this is about to get a whole lot worse. Going long oil?
You’re crazy.
USA oil consumption is about 19 million barrels per day (dated figure). So by your 397 million BPD we’ve got about 20 days supply (~17 billion total to buy up that supply at $45/ barrel).
I’m wondering if the 60 billion/month of stimulus the ECB is providing will find its way into purchasing oil futures. As you’ve noted in a previous article, the drop in oil prices coincided with the end of open market operations by the fed. By that logic the price of oil should be heading up sooner, rather than later.
Who cares about supply? Something is worth what someone is willing to pay for it. Mysterious bidders with deep ECB lined pockets may very well come to save the day.
As many have noted, the ECB stimulus will likely have little benefit given the demand drought in Europe. Perhaps it’s all just to provide an oil stimulus?
Re: “production is soaring faster than demand” and “The plunge in the price of oil is pushing desperate drillers, buckling under their debt, to maximize production from existing wells while slashing operating costs and capital expenditures.”
How do those two statements square with the fact the number of operating oil rigs in this country has declined by over 20% since last summer? They don’t. Here’s the story from today’s news: “U.S. oil rig count drops another 4 percent” (http://bizbeatblog.dallasnews.com/2015/01/u-s-oil-rig-count-drops-another-4-percent.html/). That story states, “Since October 10, the oil rig count is down 18 percent, as rigs continue to be taken out of service across the nation’s oil fields.” Or “US [oil and gas] Rig Count Falls To Lowest Since August 2010,” (http://finance.yahoo.com/news/comes-baker-hughes-rig-count-173959401.html).
It would be more reasonable to say that production is falling less quickly than demand, but to say that would be to admit that the world’s economy is in recession, or depression, and that’s not acceptable for politicians, policymakers, and their toady talking-head MSM pundits.
You misunderstand “production” and “oil rigs drilling for oil.”
Production is the quantity of oil from a finished well reaching a trading hub. It’s measured in barrels.
Drilling for oil is done with a drilling “rig”; it’s an activity that costs a lot of money and may not “produce” any oil (dry well), or lots of oil, gas, condensate, and/or natural gas liquids, but ONLY after the drilling is finished, the well has been completed, and hooked up to processing equipment and a pipeline or some other means of transportation. All of which takes time. That drilling rig goes into the “rig count.” Once the well is drilled, the rig moves on to another project or is idled.
At that point, the new well starts producing oil or gas. For the rest of its life, the well “produces” – and the rig count no longer enters into the equation for that well.
So the rig count can plunge for many months, while production (from existing wells and newly completed wells) can continue to rise.
And this is what is happening in the US: Production in the US is rising (just check the numbers), the rig count is plunging (see my latest post on this), demand in the US is rising, but slowly, and inventories are soaring.
If you click on the tab “The Oil Bust,” you’ll see lots of articles that get into all of this. Start working your way through them, and it will all make sense after a while.
The oil stored on tankers is not flat price speculative, let alone luring others to make spec bets. The storers are buying cash and selling deferred futures. This is currently quite profitable because of the high contango. It will continue until storage is used up, which can be quite awhile. At that point (which has happened) contango will go to levels that entice tertiary storageholders into loading up. In the 90s, this caused the contango to go to $1 per month. Tertiary storage is extremely high. Think of businesses and homes topping off their tanks.
Rjohnson’s point is well taken. Total world storage ex SPRs is small relative to demand. If a cutback could be arranged, oil stocks would decline quickly. That’s why I think the first sign of a turnaround agreement would involve the US or China adding to their SPR.