Our Drunken Sailors earned and saved a lot more than we thought, spent more too, causing substantial up-revisions to post-pandemic GDP.
By Wolf Richter for WOLF STREET.
This might explain in part why consumers have held up so well: They made a lot more money, and they saved a much larger portion of it, and they spent more too than we thought. The Bureau of Economic Analysis today released its annual revisions for inflation-adjusted consumer income, spending, and the savings rate. The annual revisions go back five years, but the biggest revisions hit the period 2022-2024. And so we’re going to get our special tu-tone charts, red for the revised data through August and blue for the unrevised data through July. Brace yourself.
Personal income without transfer receipts, adjusted for inflation:
- Revised version for August: +3.1% year-over-year.
- Revised version for July: +3.2% year-over-year.
- Old version for July: +1.6% year-over-year.
This is income from wages, interest, dividends, rental properties, farm income, small-business income, etc., but excludes government transfers, such as Social Security benefits, unemployment insurance benefits, Welfare, etc.
And this: over the two years between July 2022 and July 2024, personal income without transfer receipts adjusted for inflation:
- Revised version: +6.0%
- Old version: +3.6%!
![]()
Disposable income, adjusted for inflation:
- Revised version for August: +3.1% year-over-year
- Revised version for July: +3.2% year-over-year
- Old version for July: +1.1% year-over-year.
For the two years from July 2022 through July 2024, adjusted for inflation:
- Revised version: +8.5%
- Old version: +5.5%.
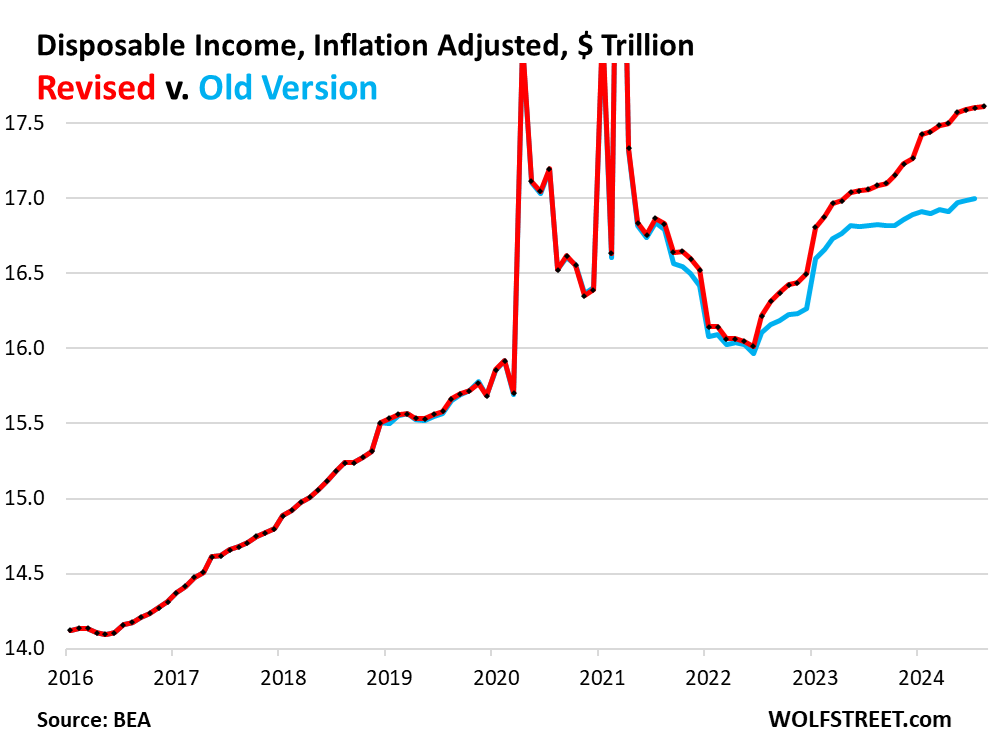
Disposable income is income from all sources after income taxes and social insurance payments. It includes income from wages and salaries, interest, dividends, rentals, farms, personal businesses, etc., and from transfer payments from the government, but excludes capital gains. Disposable income is what consumers have left to spend on goods and services and to save.
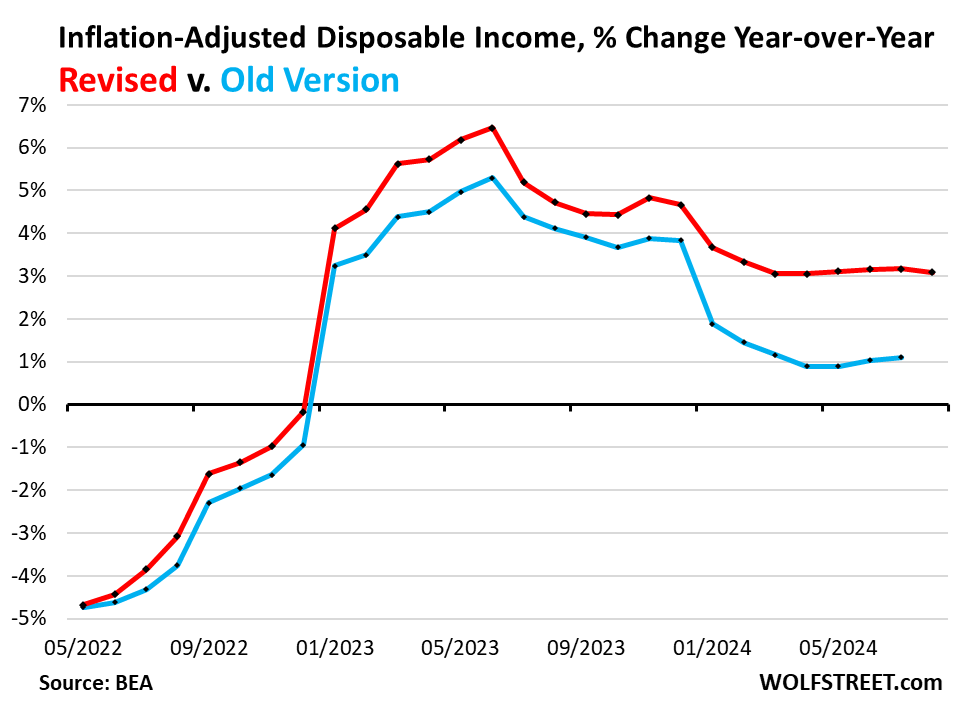
In terms of the year-over-year percentage change of inflation-adjusted disposable income: The last five revised increases (April-August) were over 3.1%, about triple the unrevised increases over the April-July period of around 1%.
The revised increase of disposable income has been outrunning inflation by a wide margin for about two years. The unrevised increase over the same period also outran inflation, but not by as wide a margin.
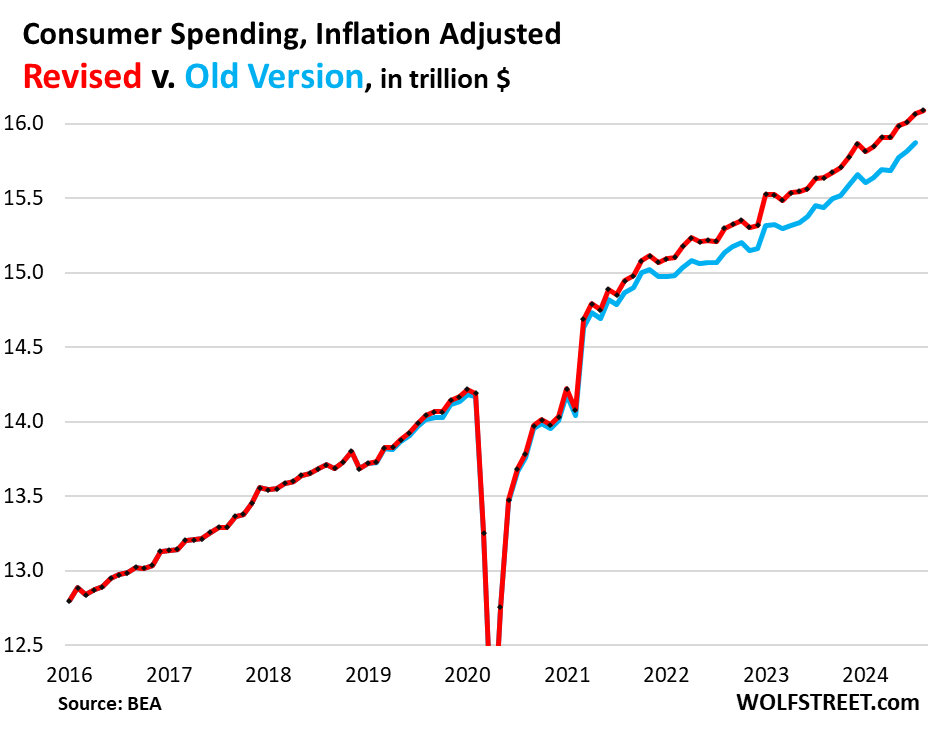
Consumer spending adjusted for inflation:
Oh deary, our Drunken Sailors as we lovingly and facetiously have come to call them around here – was also revised higher, but by a much smaller amount.
- Revised spending for August: +2.9% year-over-year
- Revised spending for July: +2.8% year-over-year
- Old version for July: +2.7% year-over-year.
Over the two years from July 2022 through July 2024, the inflation-adjusted revised consumer spending rose by 5.6%. The old version over the same period rose by 5.3%.
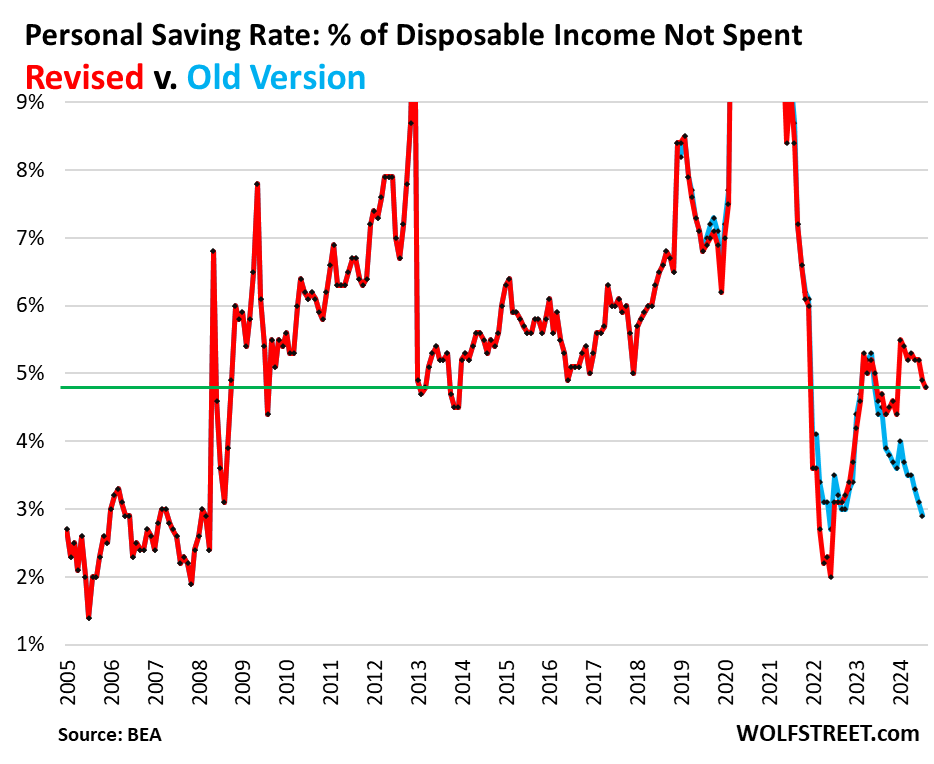
And the savings rate, oh-la-la.
What, our Drunken Sailors were party poopers? Income was revised up massively, and spending was revised up only a little, and so the savings rate – the percentage of the disposable income that our Drunken Sailors didn’t spend – was much bigger than we thought.
The savings rate in August was 4.8%. The revised savings rate for July was 4.9%. The old version of the savings rate for July was just 2.9%. This is a huge difference:
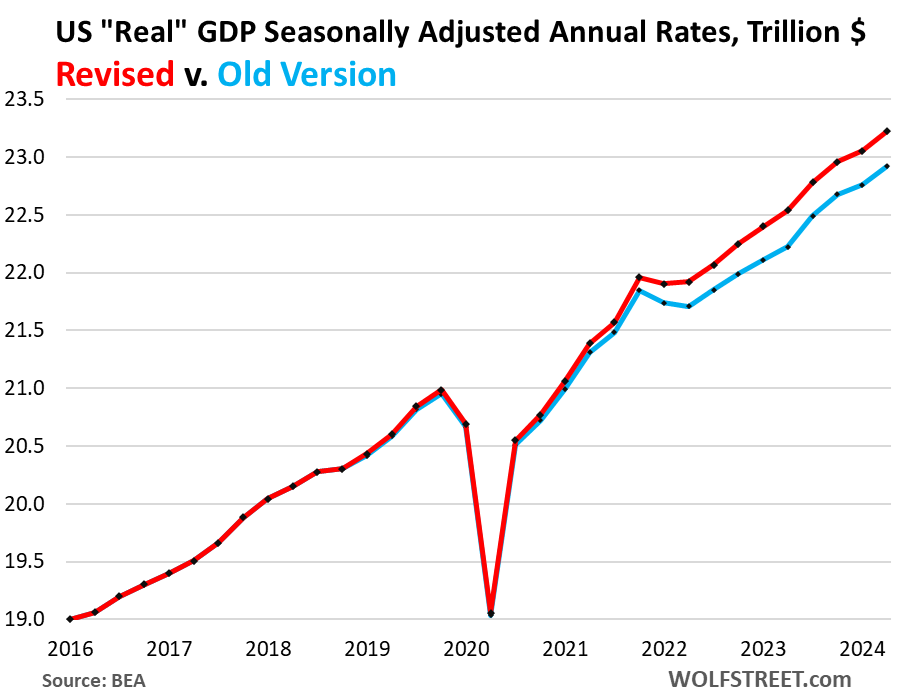
GDP too.
These revisions also made it into the GDP figures going back to the pandemic, and GDP increased much faster over those two years than we’d thought.
As a result, in Q2 2024, revised GDP, adjusted for inflation, was $305 billion higher than the old version. Since the end of 2021, revised real GDP grew by 5.8%; the unrevised version showed 4.9% growth over the same period.
Enjoy reading WOLF STREET and want to support it? You can donate. I appreciate it immensely. Click on the mug to find out how:

![]()
This makes logical sense. Up until recently many people were jumping jobs to make more money or get better conditions. Employers needed to pay more to retain as well. It does seem like most of this slowing down that things may return to normal, whatever normal is being defined as these days. Given the previous articles about corporate profits they have adjusted as well and then some. Holiday season is here so let the spending begin!
Too bad we can’t have a pandemic every 5 years, and we’d really have the best economy ever!
The pandemic was a horrible thing, not to be mentioned…the P word.
Never let a good “P” go to waist, and they didn’t, anything available to divide the people of our country was used by our fearless leaders.
The “revisers” being in town could change the “P” word…. as tho it never happened.
How about that? Amazing.
This economy is unstoppable – everybody is rolling in dough! Thanks government!
Yes, we are in a never-ending bull market. Everybody is happy.
Yes. but there are worse things. Imagine a country with more than one gun per person, and nobody has a job, and there is no welfare safety-net, and no monetary flexibility. Things get very zero-sum, very quickly.
Some people has always has a job and some don’t in every country, every system in history. Even during war times. What you say is nothing more a dystopian 90s Mad Max movie.
Things are always zero-sum. Some win, some loose.
Your imagining is extremely imaginative. What do you think people will do riot and go take power? they’re more likely to rob their neighbors who also have as little as they do.
Looks like the red line took some Viagra, the blue line….not so much.
When things are looking bleak, put a shine on your beak, call the “revisers”.
Bloggers like to point out how much the dollar has lost value. But we’ve more than made up for that with higher pay. If that wasn’t true we’d all be living in tents. Easy math if you stayed on school a bit.
I know my standard of living is much higher than decades ago when prices were lower.
Inflation more dollars less buying power.
I’d bet all of your net worth that you probably own some assets and we’re not born in the 1990s.
That might have a lot to do with it
The “Disposable income inflation adjusted” chart above already accounts for this, and shows that “more dollars” totally overpowered “less buying power”. Read the article.
So does this mean The Fed will take back its 50bps rate cut? You know… data dependent and whatnot.
You wish….
They definitely considered downwards Jobs revision and to catch up; they did 50.. But those upwards and inflation pressuring income revisions they wont consider at all.
Market is already giving 65% probability for another 50BP cut in Nov meeting. Guess what I used to believe now FED wont listen to Market. Up to last year end it was true to certain extent. But we are past that era. They say inflation came down drastically. (Not the prices)..
Doves are in charge of FOMC..
If the economy is still on the same footing as today and the FMOC whacks again, 25 or 50, then we call all collectively agree that it has nothing to do with the economy.
Instead, it’s all about driving down short-term borrowing costs for the Treasury. It’s not about jobs anymore. It’s about the interest expense.
My prediction is $1.15T FY 2024 or about 24% of revenue which is scary. In 5 years, we’ll add $10T more to the debt. Assuming there’s a recession, that number could climb to at least $12T as revenue and interest expense dives.
No, it’s about juicing asset prices and the net worths of greedy pigmen.
This is a case where the pigmen can have their cake and eat it too for awhile longer.
Lower interest rates = slower debt growth but they’ll have to cut spending too, to have any longer term effect. Will see how that goes…
Did they change a methodology or something? I mean, I’m all for conspiracy stuff but at the end of the day, it seems like these revised figures are such a drastic difference compared to the norm that it almost feels like something fundamentally would have had to change to make it happen. I’ll have to look into it I guess.
I suspect they’re starting to pick up some of the 6 million immigrants that came in 2022 and 2023, many of whom are working and making money and spending money.
We’ll see more of that over the next few months in the household survey of the jobs report and elsewhere.
This is what the BLS said:
“Today’s release presents results from the annual update of the National Economic Accounts. The revisions for income and consumer spending estimates begin with January 2019. Monthly estimates for January through March of 2024 include revisions resulting from the incorporation of first-quarter wage and salary data from the Bureau of Labor Statistics (BLS) Quarterly Census of Employment and Wages program. Estimates for wages and salaries for April through July of 2024 have been updated to reflect revised monthly data from the BLS Current Employment Statistics program.”
I once interviewed to work for one of the 4 letter statistics government agencies and the director ask how I would handle a certain analysis situation and I replied that I would report the numbers like a hurricane track forecast. They replied back we can not have error and our numbers can not be off. It would appear that is clearly not completely accurate. I turned down the job but mostly becuase cost of living was too high in DC.
Thank you, Wolf, for the “tu-tone” charts. Glancing at each chart that goes back more than a couple years seems to reveal material divergences that begin in 2021/2022, and the divergences compound over from 2022 to present.
Why then does the BLS quote you supplied identify 2019 as the starting point? Were there other revisions that you have not covered yet that began further than 2021?
Oops, meant to ask:
“Were there other revisions (out of BLS) that go back further than 2021?”
Thanks!
These are annual revisions. They’re done every year. And each year, they go back 5 years — this one to 2019. So the biggest revisions hit the most recent years (2024 and 2023). 2022 was already revised once, in 2023. And 2021 was revised twice (in 2022 and 2023), 2020 was revised three times, and 2019 four times. So after each revision of the same year, the revisions get smaller. So the revisions for 2019 were minuscule. GDP and lots of other data are also revised that way.
But this year, the revisions for the prior two years were much bigger than I’d seem them before – normally they’re not such a big deal — and so I think it’s the waves of immigrants that are now showing up in the revised data for 2022-2024.
If they are here illegally, how are they employed? Who’s hiring them? What ever happened to E-verify? Are they hired off the books?
Reality is only a few states mandate E-Verify and then some of those only for public contracts.
Yes, Yes, No, Yes.
And if you think anyone is deporting them, No.
It’s a big scam that both political parties – bought and paid for by the wealthy special interests – are running on legal citizens to drive down wages and the standard of living so pigmen can pig out.
Depth Charge,
It is not really a scam but a well researched and long held concept of surplus labor. It is of course highly desired by profit driven entities as it acts to drive down labor costs by having more competition among workers, who are already at a disadvantage simply by the nature of the imbalance in power that inherently exists. Trade agreements often are at the heart of this as well such as NAFTA, which while heralded as a win/win by most mainstream media it is much more nuanced in reality.
This helps explain the Vibesession, where people feel screwed, even though they’ve never been better off — perfect!
Check the FRED chart on pension v.s. stock holdings for households.
Mr. Market has much larger voice today.
While working to make homes better for folx for many years, I finally realized that no matter how good my work was, about 10% of clients were never going to be happy.
(In that case, it was easy for me to go totally commercial and/or industrial/institutional and deal only with professionals who knew the difference between good and perfect, and also knew not to let perfection stand in the way of good.)
In this case, clearly, Some folx will never be happy, as opposed to some older folx who have been very happy to reap the rewards of 5% T-bills!
IMHO, one of the first things our next POTUS should do is to establish, by the apparently unlimited Executive Order method, a USA National Bank that ALWAYS pays 5% or more on deposits,,, while lending at as low as possible rates, based on deposits cost and costs of running the bank.
Far damn shore I realize it will never happen while WS and the rest of the oligarchy owns the politicians, etc., but maybe, just maybe, at some point the owners will realize that such a bank might save their ASSets,,, eh
People really don’t like inflation, but many are getting raises to compensate and then some.
People get grumpy lookin at pump prices when they they refuel, but the natty gas bill is set to autopay, and they don’t realize they’re paying historically low prices for gas.
They are not paying lower prices for gas just because natural gas is lower historically. You forget that utilities companies have increased their pricing power for gas delivery to homes, etc. Just check your heating bill history for the past 3-4 years.
Well we may be moving in the right direction according to our day.
The last thing this country needs is more saving. Which means the billionaires wanting to get 5 and half from the Fed
The next generation is in control of the future.
Thank goodness it’s their fault and not ours.
I dunno, maybe it’s time for the government to stop deficit spending.
Massive tax increases! That’ll put everybody in a foul mood and bring on the blessed recession.
No majority of voters in this democracy will approve actually paying for the benefits received. It always comes back to the crowd. That is what gets votes: free stuff, with laughably low taxes in comparison. The politicians feed back into it with their promises, but they are hand puppets of We the People. I have yet to meet a self-titled conservative who refused any public benefits.
These upward revisions posted five weeks from a tight election seem to good to be true. It will be interesting to see how the bond and stock markets. Keep in mind we have rising unemployment, earnings calls with executives commenting on consumers downshifting their retail spending, higher credit card late payments, and consumer sentiment surveys flashing a potential recession (especially among the lower two-thirds of income earners).
1. “Keep in mind we have rising unemployment,”
Unemployment actually declined in August to 4.2% which is historically low. Layoffs are historically low — we see that in all the data. Where weakness has crept into the labor market is job creation – there are still jobs being created but at a slower rate than normal.
2. “with executives commenting on consumers downshifting their retail spending, ”
That’s BS. Only retailers with shitty operations blame consumer weakness, instead of themselves, LOL. Walmart and Amazon – the two giants – had blowout quarters, lots of other big retailers that know what they’re doing did too. Costco just reported a US revenue increase of 6.3%, with ecommerce sales up 19.5%.
Retail sales themselves gave us another blowout month in August
https://wolfstreet.com/2024/09/17/recession-not-yet-retail-sales-help-push-up-atlanta-fed-gdpnow-to-3-0-for-q3-gdp-our-drunken-sailors-arent-backing-off/
“higher credit card late payments,”
More BS. Read this:
https://wolfstreet.com/2024/08/09/credit-card-delinquency-rates-drop-for-4th-month-despite-confused-reporting-on-the-ny-feds-transition-into-delinquency-rates/
“consumer sentiment surveys flashing a potential recession”
More BS. Consumer sentiment rose to a five-month high. But consumers are pissed off about inflation — that’s not a recession signal, that’s a healthy human reaction to getting ripped off. And it shows up bigly in all sentiment surveys and drags them down.
The most recent Conference Board’s Consumer Expectations Index—based on consumers’ short-term outlook for income, business, and labor market conditions—declined by 4.6 points to 81.7. A reading below 80 usually signals a recession ahead. It’s on their website. So you can argue with them as to the accuracy ;-)
You should also check out the August Michigan consumer sentiment index. It’s on their website. Looks comparable to 2009 Great recession. And, um, the sentiment number is down quite a bit this year. And looks even worse for the lower two-thirds of income strata.
Month Year Index
1 2024 79
2 2024 76.9
3 2024 79.4
4 2024 77.2
5 2024 69.1
6 2024 68.2
7 2024 66.4
8 2024 67.9
Facts matter, right?
LOL…
1. In mid-2022, the Michigan Sentiment Index dropped to 50, largely due to inflation, and that was lower than any time during the Great Recession, it was in fact a record low, and there was no recession in 2022, nor in 2023, nor in 2024.
2. Since mid-2022, it has come up by 40%, from 50 to 70.1, and the economy is growing at 3% pace, you recession-monger goofballs.
3. Like I said, consumers are pissed off about inflation, and that pushes down the overall index. Check the subindices. They’re on their website.
4. Separately but in the same vein: The Conference Board via its Leading Economic Index has said since mid-2022 that the economy is on the verge of entering a recession and will be in a recession in a few months, month after month they’ve said the same bullshit, for over two years, these idiots, and the economy is still not anywhere near a recession with 3.0% GDP growth in Q2, and Q3 looking similar. I have ripped them apart publicly here almost a year ago, and they’re still saying the same bullshit:
https://wolfstreet.com/2023/11/20/leading-economic-index-predicts-recession-for-early-2024-after-having-predicted-a-recession-for-late-2022-early-2023-mid-2023-late-2023/
And ever since mid-2022, there has been a gazillion recession-monger goofballs on YouTube and in the social media with their idiotic clickbait recession BS, and people drag this BS into here, and I’m now just sick of it, after seeing it over and over again since mid-2022. You people don’t ever give up, do you?
Being a drunken sailor is fun. Why stop?
The extra income I would put into a house is spent on durable goods. Why save for a home you can’t afford? Living in California, the social state treats its poor homeless people well. All you need a tent over your head and a fish pole to survive here. Go spend your money on crap life it short. It’s time to get drunk and sale on.
You are a great thinker and drinker.. drunk sailors are on a solid ship …USS Kamala…
Are “transports” or whatever, and oil, correlating with all this happy-times economy?
Vibecession is a funny word, sounds more like a description of the transitory zeitgeist of a moral hazard society who have been confused to the point of not knowing what to think or feel any more.
Vibecession is a clickbait term in the social media (TikTok) with which “creators” are making lots of money.
How does this square with the 1Q24 record-setting downward revision in employment and payroll?
That was a preliminary revision that specifically did not pick up the 6 million immigrants that came in 2022 and 2023, many of whom are now working. The reason it didn’t pick up the new immigrants who are working is that the revision was based on unemployment insurance filings by companies, and illegal immigrants cannot be in the UI data because they don’t qualify for UI. The final revision will be out early next year, which might shed more light on this. But this UI-basis and illegal immigrants not being part of it has been well-documented and explained.
We will likely see a huge upward adjustment of employment in the household data next year that will include some of the immigrants, but not all since illegal immigrants rarely fill out surveys.
Add that 40% of homeowners have no mortgage, 59.4% that do have mortgages are 4% or below. So the landowners in America have the best balance sheets ever and are sitting on inflated home equity values. Throw in record stock prices, high interest rates on savings and you have “drunken sailors” spending like 1999!
I just laugh when I see 30% credit card interest rates. Those who HAVE LESS are becoming the HAVE NOTS. The HAVES are doing well.
Low-income folks don’t even have credit cards because they don’t qualify, or they have credit cards with very low credit limits, to where interest doesn’t really amount to much. These people mostly use debit cards.
It’s the young dentist that got into it over his head that’s paying the 29% interest on $100,000 card balances.
In my situation our retirement income in the last year and a half has risen 5 times what it had previously been as a result of T-bill rates. That’s been a substantial “raise” in our household.
Danielle DiMartino Booth and Lacy Hunt, et al, are very exasperated by this unanticipated revision, which is ironic, because they still claim, there’s downward revisions ahead that will spark a recession within months.
They seem to be among the very long list of experts that have called out twenty of the last three recessions — they are greatly entertaining — but increasingly embarrassing — yet, I totally sympathize, primarily, because hyper data seems to be continually erratic, inconsistent and lacking credibility — yet, here we are, weighing garbage in the left hand versus crap in the other hand:
In a very recent doc from Census, from Feb 24:
Mitigating residual seasonality while preserving accounting relations in hierarchical time series
“In particular, the Goods and Services portion of Per- sonal Consumption of Expenditure (PCE), which accounts for two thirds of GDP, is published at a monthly frequency and needs to be consistent with quarterly values, while also preserving hier- archical accounting relations. Further complicating matters, for some components of GDP there is no monthly raw data available, i.e., only the monthly seasonal adjustments have been provided to BEA (by other agencies). Hence there is no way to compute a quarterly or hierarchical aggregate, and therefore no way to compute a direct adjustment; apparently, the indirect adjustment is the only available method, and in some cases the adjustment is inadequate.”
DDM has been calling for a recession and claiming that the Fed overtightened for what, two years now? And the recession never comes. She earned a lot of credibility and good will as a critic of the Fed’s overly accommodative policy post-GFC and during the pandemic but it appears she has absolutely lost the plot.
I’m starting to think that her whole schtick is “criticize the Fed for being too loose when it’s loose; criticize the Fed for being too tight when it’s tight.” Mindless contrarianism, in other words.
Needless to say, as a person who thinks the Fed was WAY too loose when it was loose and still too loose when it was tight, I find that schtick exasperating.
“DDM has been calling for a recession […]”
…er, DDB, I mean.
I guess everything everywhere was and always has been fine. And now rate cuts. Go figure.
Trying to apply common sense to this economy since about 1987 has been a continuous exercise in humility for me.
Didn’t you read the article…you are saving money, you have been revised upwards. You also made more money
Go and see….
“You have been revised upwards..” Lol, gotta love it!
I always feel better after reading Wolf Street.
Nobody tell Senator Warren.
Do we know the per capita numbers?
Here you go:
Re: “ The savings rate in August was 4.8%. The revised savings rate for July was 4.9%. The old version of the savings rate for July was just 2.9%. This is a huge difference:”
Wow! Makes me wonder why my savings had been falling with treasury yields crashing…
Meanwhile at Fannie:
“ The large upward revision to GDI now shows significantly stronger growth in real disposable personal income over the past several quarters, which helps to explain why consumption growth has remained robust. A fundamental assumption in our forecast had been that the personal savings rate had been unsustainably low as income growth meaningfully lagged consumer spending in recent quarters. With income growth now being revised upward significantly, the second quarter saving rate is now a relatively healthy 5.2 percent (4.8 percent in the latest monthly data). These revisions thus present some upside risk to our growth forecast through the end of 2024 and into 2025. “
I should have continued on to next thought from Fannie:
“While we had previously called for slowing growth in part due to believing consumers would need to retrench to allow incomes to catch up with spending, we will be reassessing this view in our next update”
I think that implies acceleration in incomes and savings is already fueling inflation rebound — and further rate cuts to stimulate growth will almost guarantee that the pre-election effort to have a soft landing will end up being an aborted landing — or perhaps like a bird strike that wrecks the turbines — I mean, what kind of landing happens when all the data was wrong, right after rate cut? Suddenly we have an acceleration in growth and spike in savings, then a huge rate cut, with the Fed racing to cut by another 100 bps? I would think this is going to be confusing to a lot of proline in an unforeseen way…
Thank you yet again Wolf for teaching “applied economics” without agendas meant to glaze over my easily fooled mind!! All the Best, Kenny
On the “Per capita disposable income, adjusted” graph those are some big upward blips in 2020 and 2021. Do they include government stimulus checks? That fabricated money should never be considered income.
So you’re referring to the chart I posted in the comments, not in the article.
Yes, those spikes were caused by stimulus payments (including stimulus checks, PPP loans, extra unemployment benefits, etc.). And this type of one-time extraordinary income is where “annual rates” distort the image, because an annual rate extrapolates that month’s income out to an entire 12-month period, and it shows what that income would be in a 12-month period if it continued that way for all 12 months. But stimulus payments didn’t continue.
That’s why I like the income without transfer payments, which excludes all those incomes from the government. It shows a better picture. First chart in the article. So RTGDFA
All is well what ends well. No catastrophe this time as well ,,,
The new Personal Income chart mimics stock market charts for the same period (S&P, NASDAQ etc).
Just coincidence?
Assets and capital gains are not included in personal income.
Capital gains would be on top of personal income. But they’re not reflected here.
What is “Transfer Receipts”?
This probably really screws up Anna Wongs forecast related to a 70% chance of recession in next qtr:
“ The average of GDP and GDI, also referred to as gross domestic output and considered a better measure of economic activity, increased at a 3.2% rate last quarter. That was revised up from the previously estimated 2.1% pace. Gross domestic output advanced at a 2.3% pace in the first quarter, revised up/down from the previously reported 1.4% pace.”
Anna is probably confused but so is fed with aggressive panicky rate cuts — this revision is awkward — and presumably the one around February will really screw up planning.
Big positive revisions look suspicious to me just before an election. I’ll wait a few months to see what they look like after the election. But since all the new jobs have gone to foreign born workers, Wolf may be right. But then you can’t include the remissions to foreign countries in US savings.
“Big positive revisions look suspicious to me just before an election.”
And big negative revisions, like the massive down-revision of the nonfarm jobs, right before the election?
Powell in the Q&A at NABE: The upward revisions of GDI were “quite interesting”
That GDI wasn’t as low as once thought “removes a downside risk to the economy”
The upward revision to the savings rate does the same thing. “That suggests spending can continue at a healthy level”
What’s with the cheerleading? Pi up only 15% in 5 years lol
Since the end of 2019 (so nearly 5 years):
– personal income not adjusted for inflation: +33.7%
– personal income adjusted for inflation: +12.7%
– personal income without transfer payments, adjusted for inflation: +11.0%
– disposable income adjusted for inflation: +12.3%
From Moodys analytical:
Perhaps a better measure of economic activity is real gross domestic output, calculated by taking the average of real GDP and real GDI. Research from the Council of Economic Advisors shows that growth in real GDO is a better predictor of future revisions to real GDP growth … blah, blah, blah.
Hence, our latest revised Real GDI is 3.4% and revised Real GDP is 3% — and more revisions on the way, but growth looks sustainable above 3% for at least next qtr.
Like it or not, this isn’t a bad economy and it seems like post pandemic resilience will continue, regardless of somewhat normal bifurcated unevenness within our polarized reality.
I find it challenging to accept that home prices will normalize near current values, or that stock values are normalized, but it’s kinda looking like we live in a new normal.
FOMO and BTFD chase each others tails and TINA.
Nostradamus in the cloud