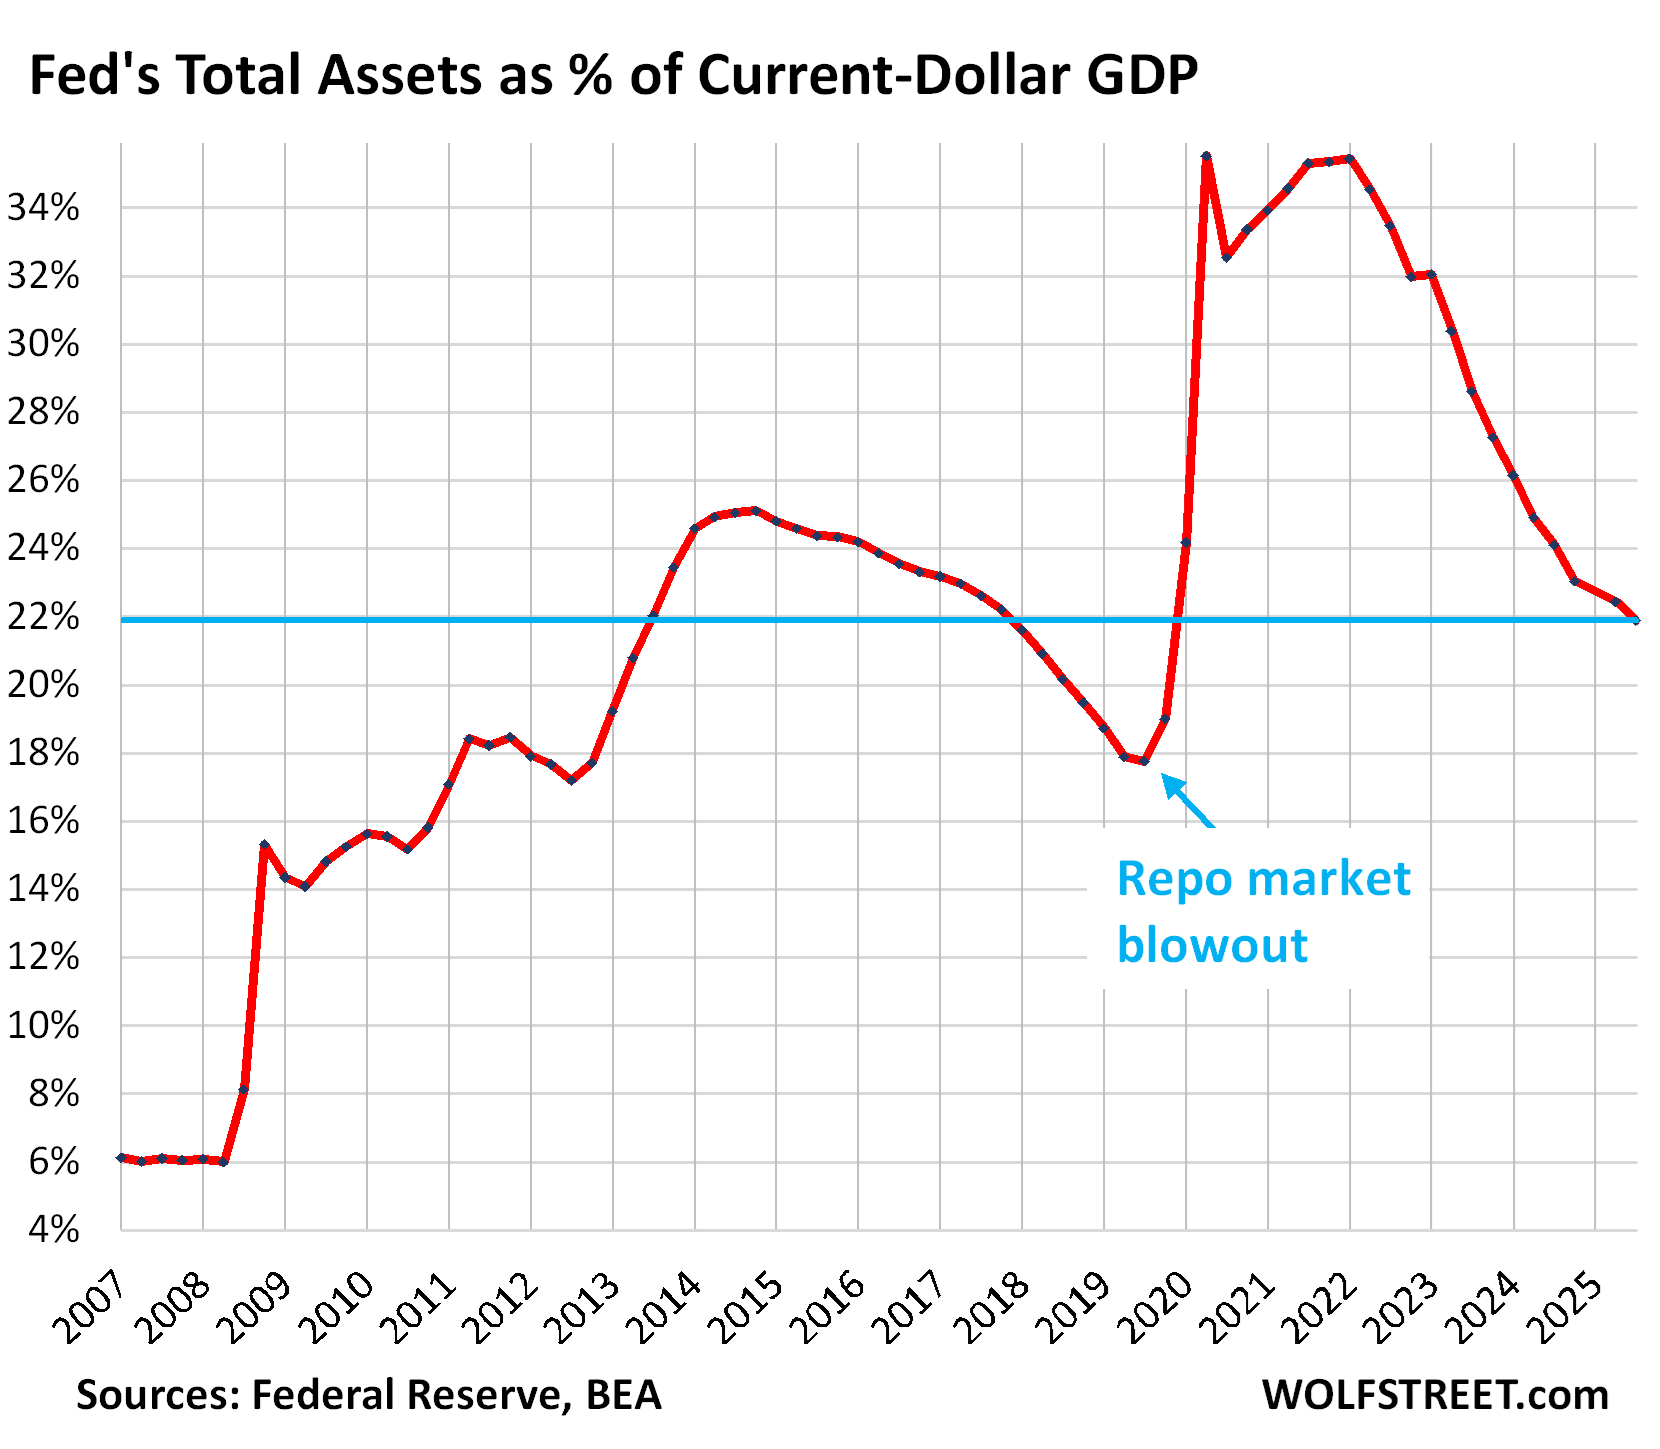
The ratio of the Fed’s assets to GDP dropped to 21.9%, lowest since Q4 2019 and back where it had been in 2013.
By Wolf Richter for WOLF STREET.
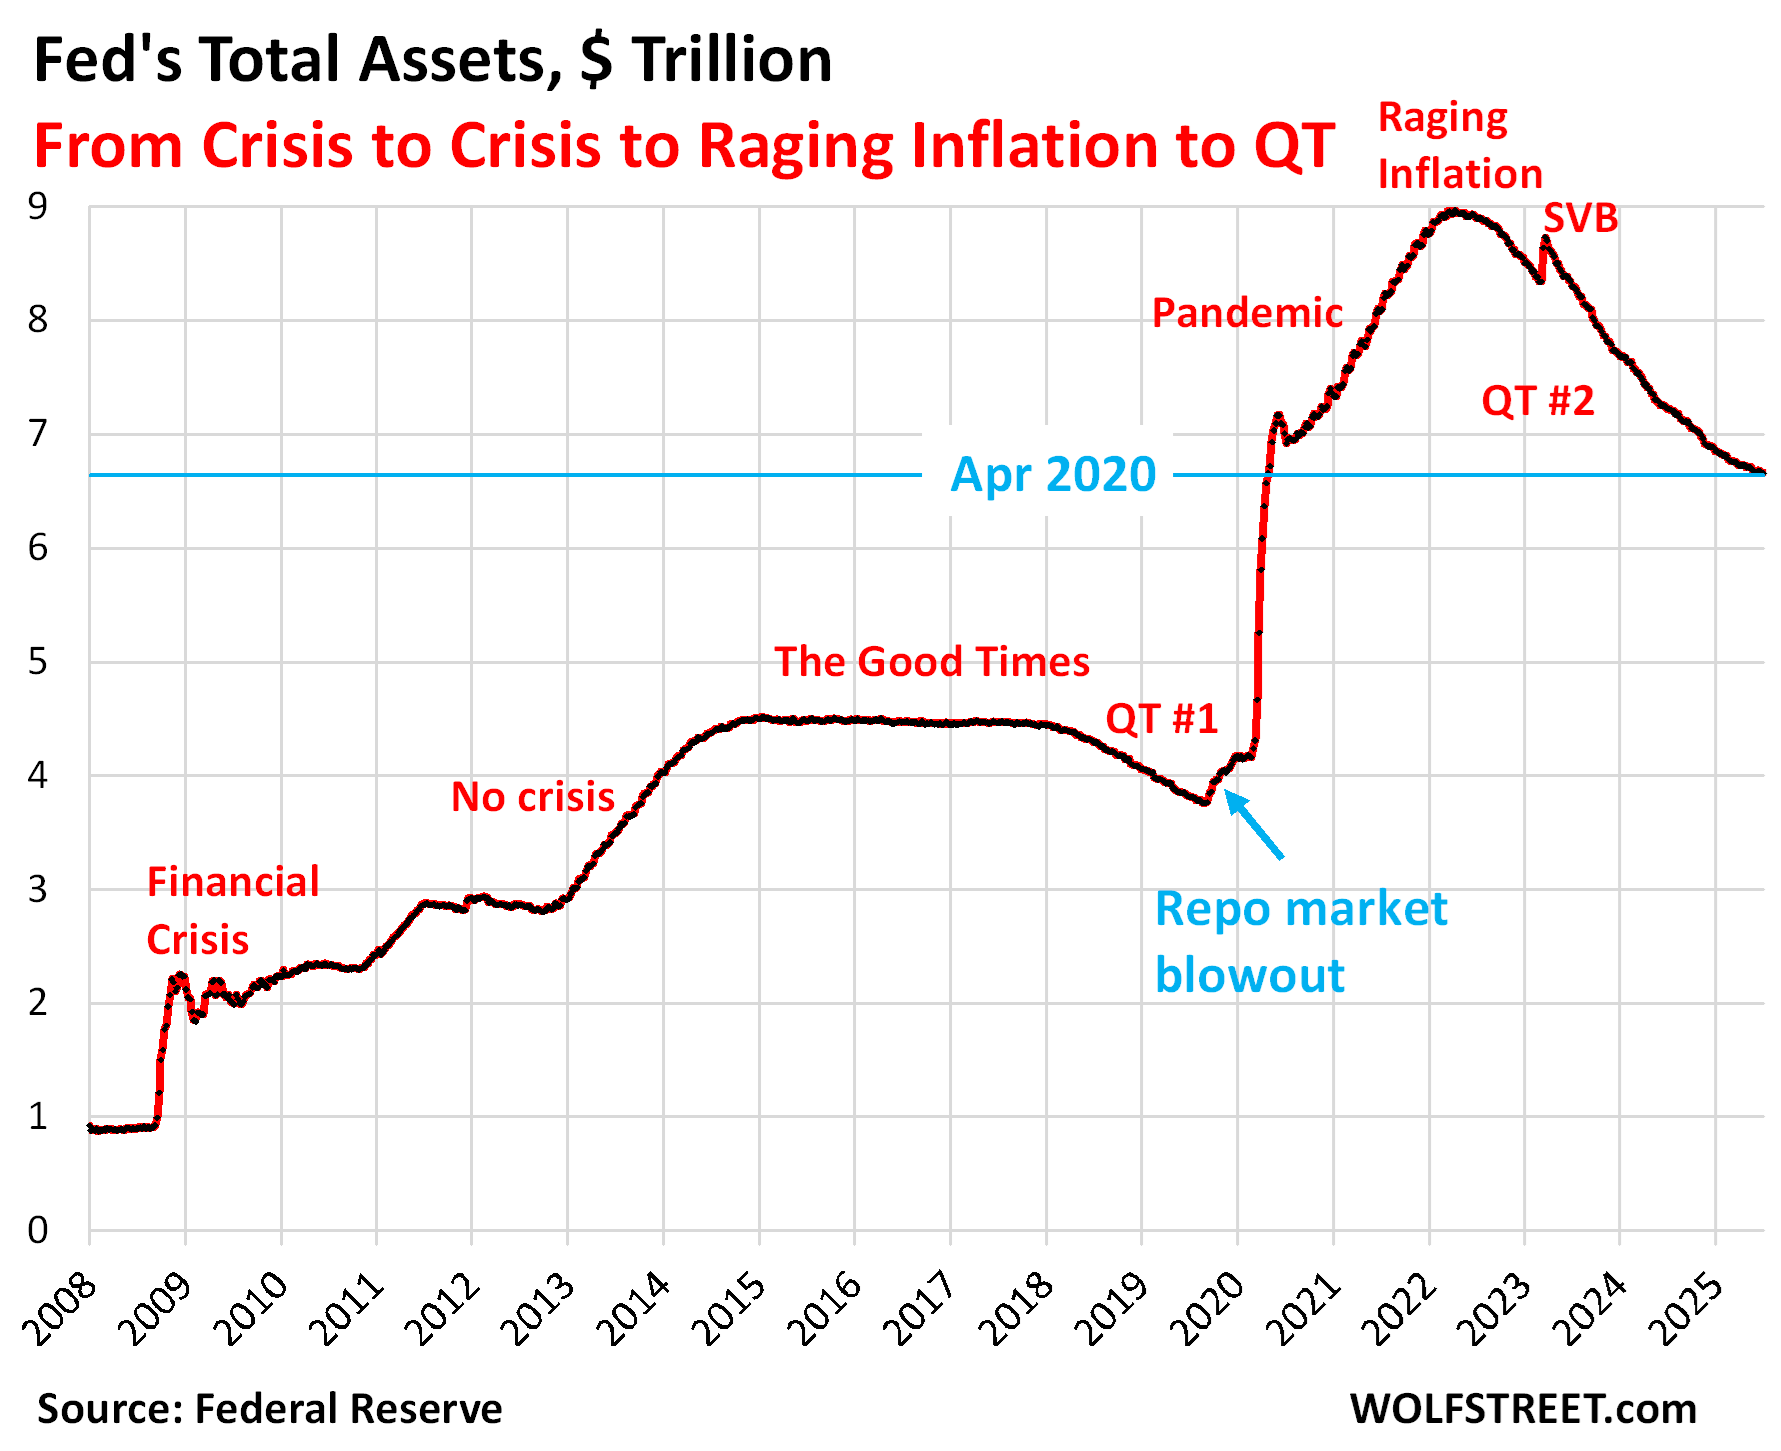
Total assets on the Fed’s balance sheet declined by $19 billion in July, to $6.64 trillion, the lowest since April 2020, according to the Fed’s weekly balance sheet today.
Since peak-balance sheet at the end of QE in April 2022, the Fed’s QT has shed $2.32 trillion, or 25.9% of its total assets.
In terms of Pandemic-era QE, the Fed has shed 48.4% of the $4.81 trillion in assets it had piled on from March 2020 through April 2022.
QT assets.
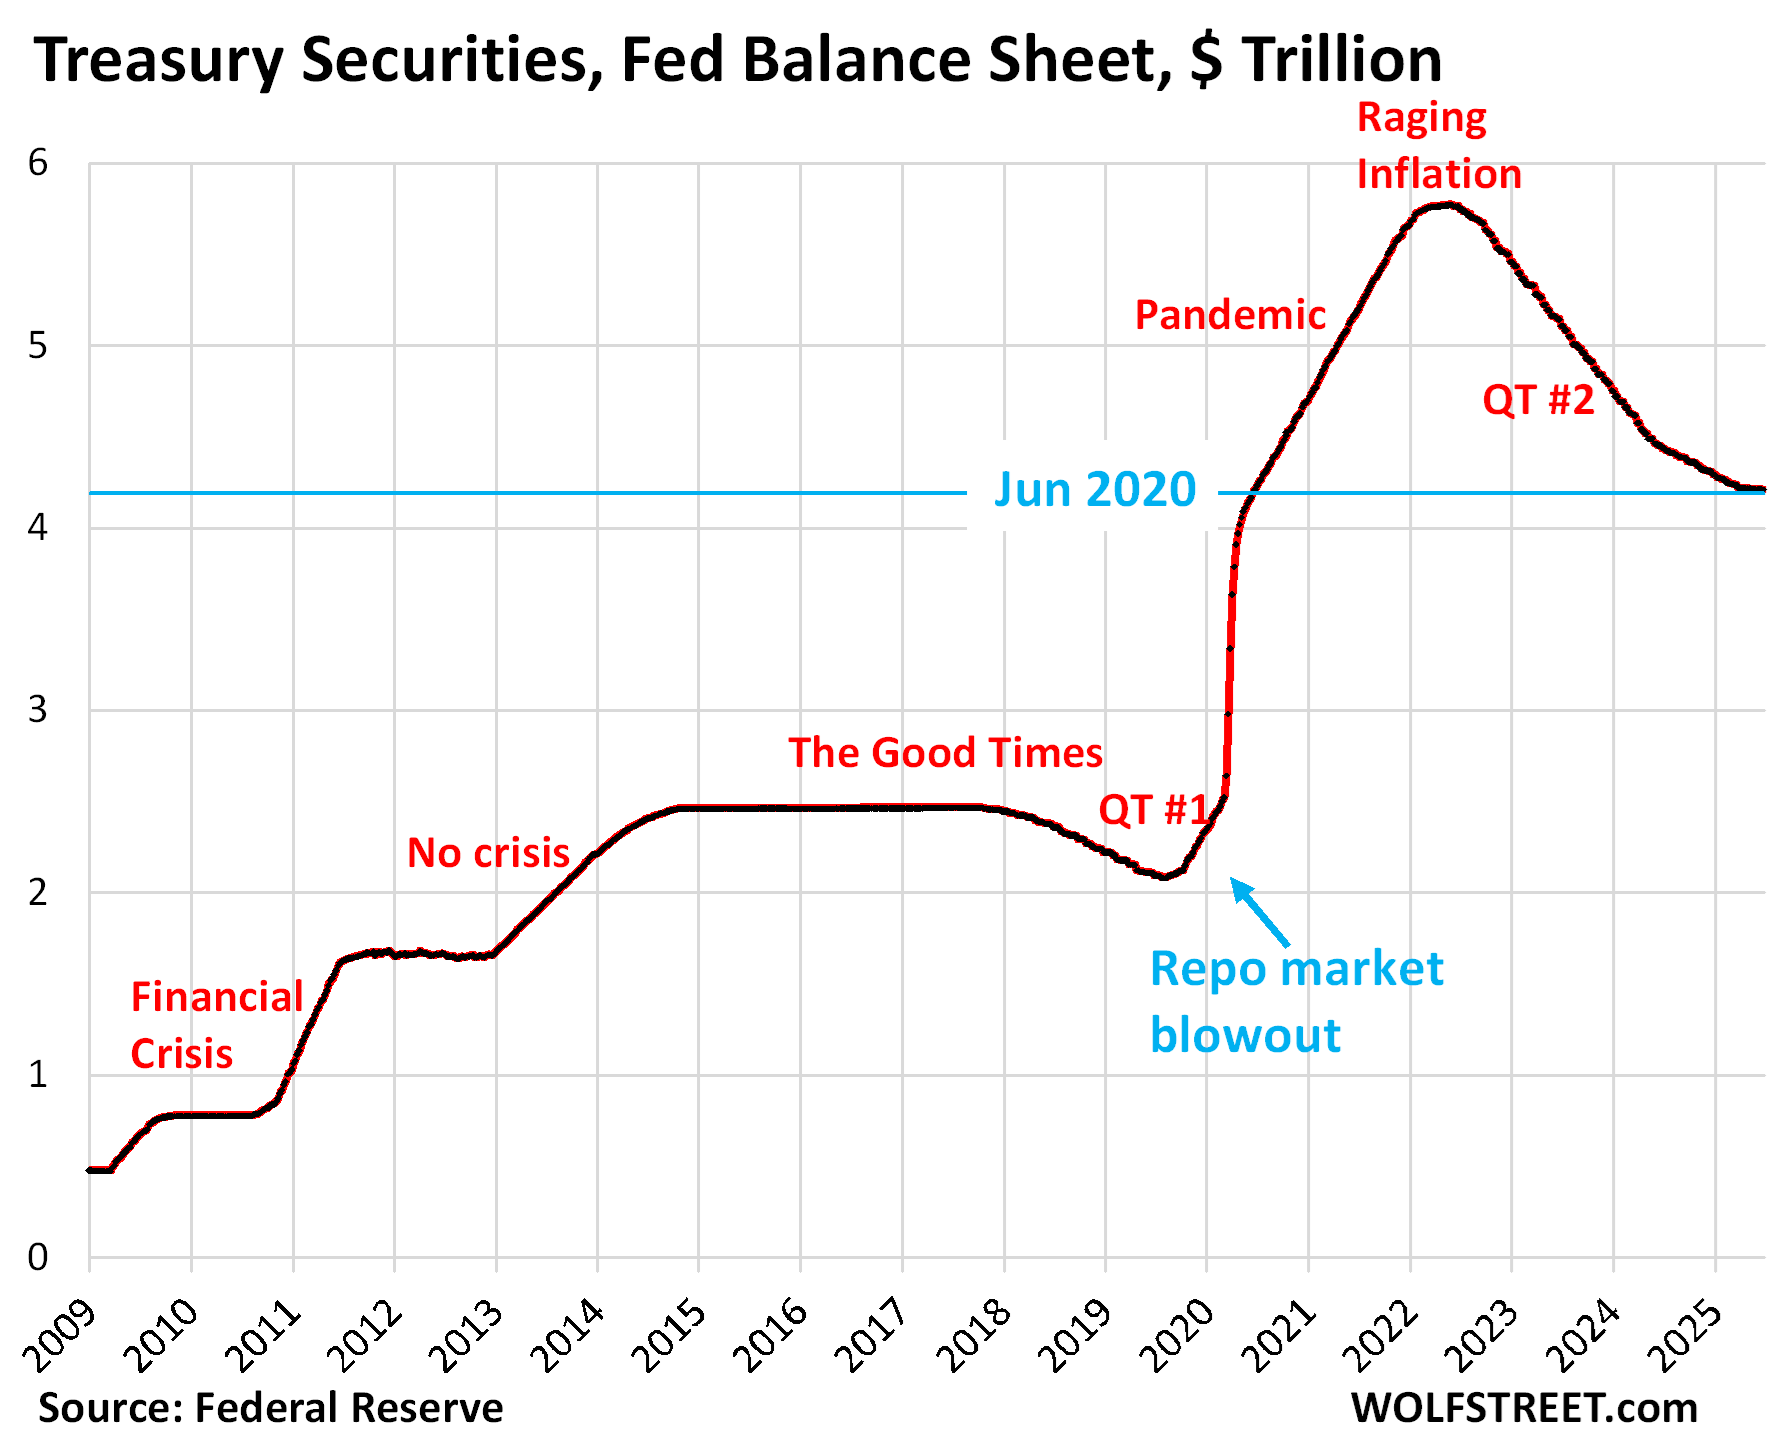
Treasury securities: -$3.8 billion in July, -$1.57 trillion from peak in June 2022 (-27.1%), to $4.20 trillion, the lowest since June 2020.
During pandemic QE, the Fed had piled on $3.27 trillion in Treasury securities. It has now shed 47.9% of that.
The $3.8 billion decline was in line with the Fed’s recently lowered pace of QT for Treasuries to $5 billion a month. The $1.2 billion difference was the inflation protection that the Fed earned on its holdings of Treasury Inflation Protected Securities (TIPS), which is added to the principal of the TIPS, instead of being paid in cash.
But there was an interesting shift: All of the QT came out of its TIPS holdings:
On July 15, $10.9 billion of 10-year TIPS matured, consisting of $8.03 billion par value plus $2.8 billion in inflation protection, and the Fed got paid this $10.9 billion, and these TIPS came off the balance sheet.
But instead of replacing all or nearly all of these TIPS with new 10-year TIPS at the auction on July 24, it only purchased $1.4 billion of TIPS at the auction and replaced the rest of the matured TIPS with Treasury notes.
So the Fed’s TIPS holdings fell by $8.9 billion (to $419 billion, including $110 billion in earned inflation protection), while its holdings of Treasury notes and bonds rose by $4.4 billion. The rest rolled off the balance sheet as QT.
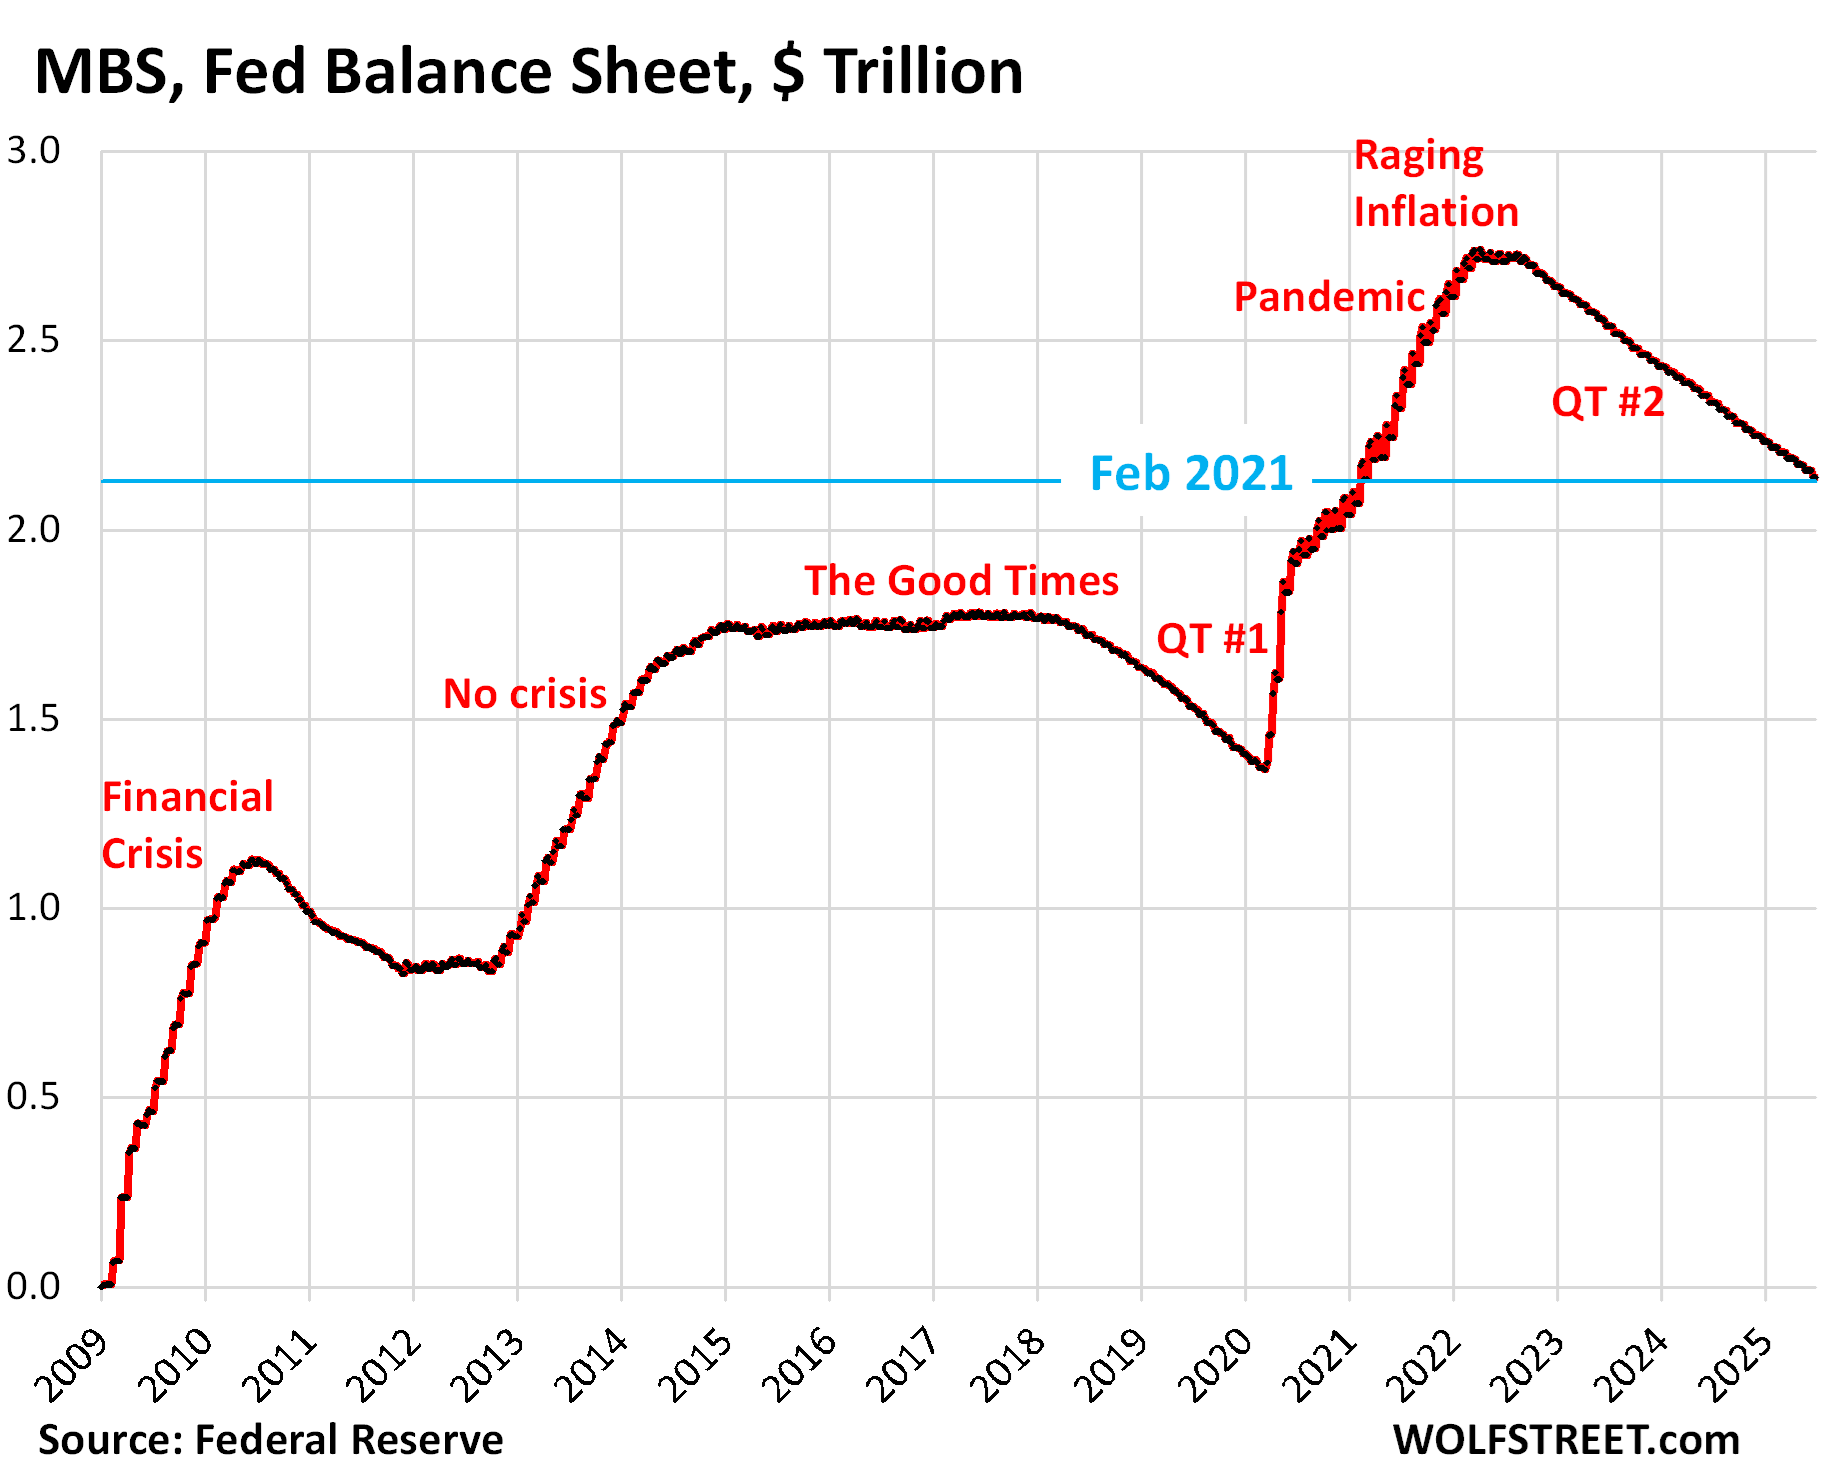
Mortgage-Backed Securities (MBS): -$17.8 billion in July, -$620 billion from the peak, to $2.12 trillion, where they’d first been in February 2021.
The Fed has shed 22.6% of its MBS since the peak in April 2022, and 45.1% of the $1.37 trillion in MBS that it had added during pandemic QE.
The Fed holds only “agency” MBS that are guaranteed by the government, where the taxpayer would eat the losses when borrowers default on mortgages.
MBS come off the balance sheet primarily via pass-through principal payments that holders receive when mortgages are paid off (mortgaged homes are sold, mortgages are refinanced) and as mortgage payments are made. But sales of existing homes have plunged and mortgage refinancing has collapsed, and far fewer mortgages got paid off, and passthrough principal payments to MBS holders have slowed to a trickle. As a result, MBS have come off the Fed’s balance sheet at a pace that has been mostly in the range of $15-19 billion a month.
If pass-through principal payments become a torrent again, as during a refi boom, the Fed would allow the MBS balance to fall by the entire amount of the pass-through principal payments, but any amount above $35 billion a month would be replaced with Treasury securities. In that case, total QT would reach $40 billion a month, the theoretical maximum under the current QT regime.
Bank liquidity facilities:
The Fed has three bank liquidity facilities. There was little activity in July. The Fed has been exhorting banks to start practicing using these facilities with “small value exercises,” or at least get set up to use them, and pre-position collateral so that they could use them quickly.
- Central Bank Liquidity Swaps ($0.0 billion)
- Standing Repo Facility, or SRF ($0.0 billion).
- Discount Window: $4.9 billion, down by $1.5 billion from a month ago. During the SVB panic, it had spiked to $153 billion.
The Fed’s balance sheet in relationship to GDP.
The Fed-assets-to-GDP ratio – so total assets divided by “current dollar” Q2 GDP (not adjusted for inflation) – fell to 21.9%, the lowest since Q4 2019, and back where it had first been in Q3 2013.
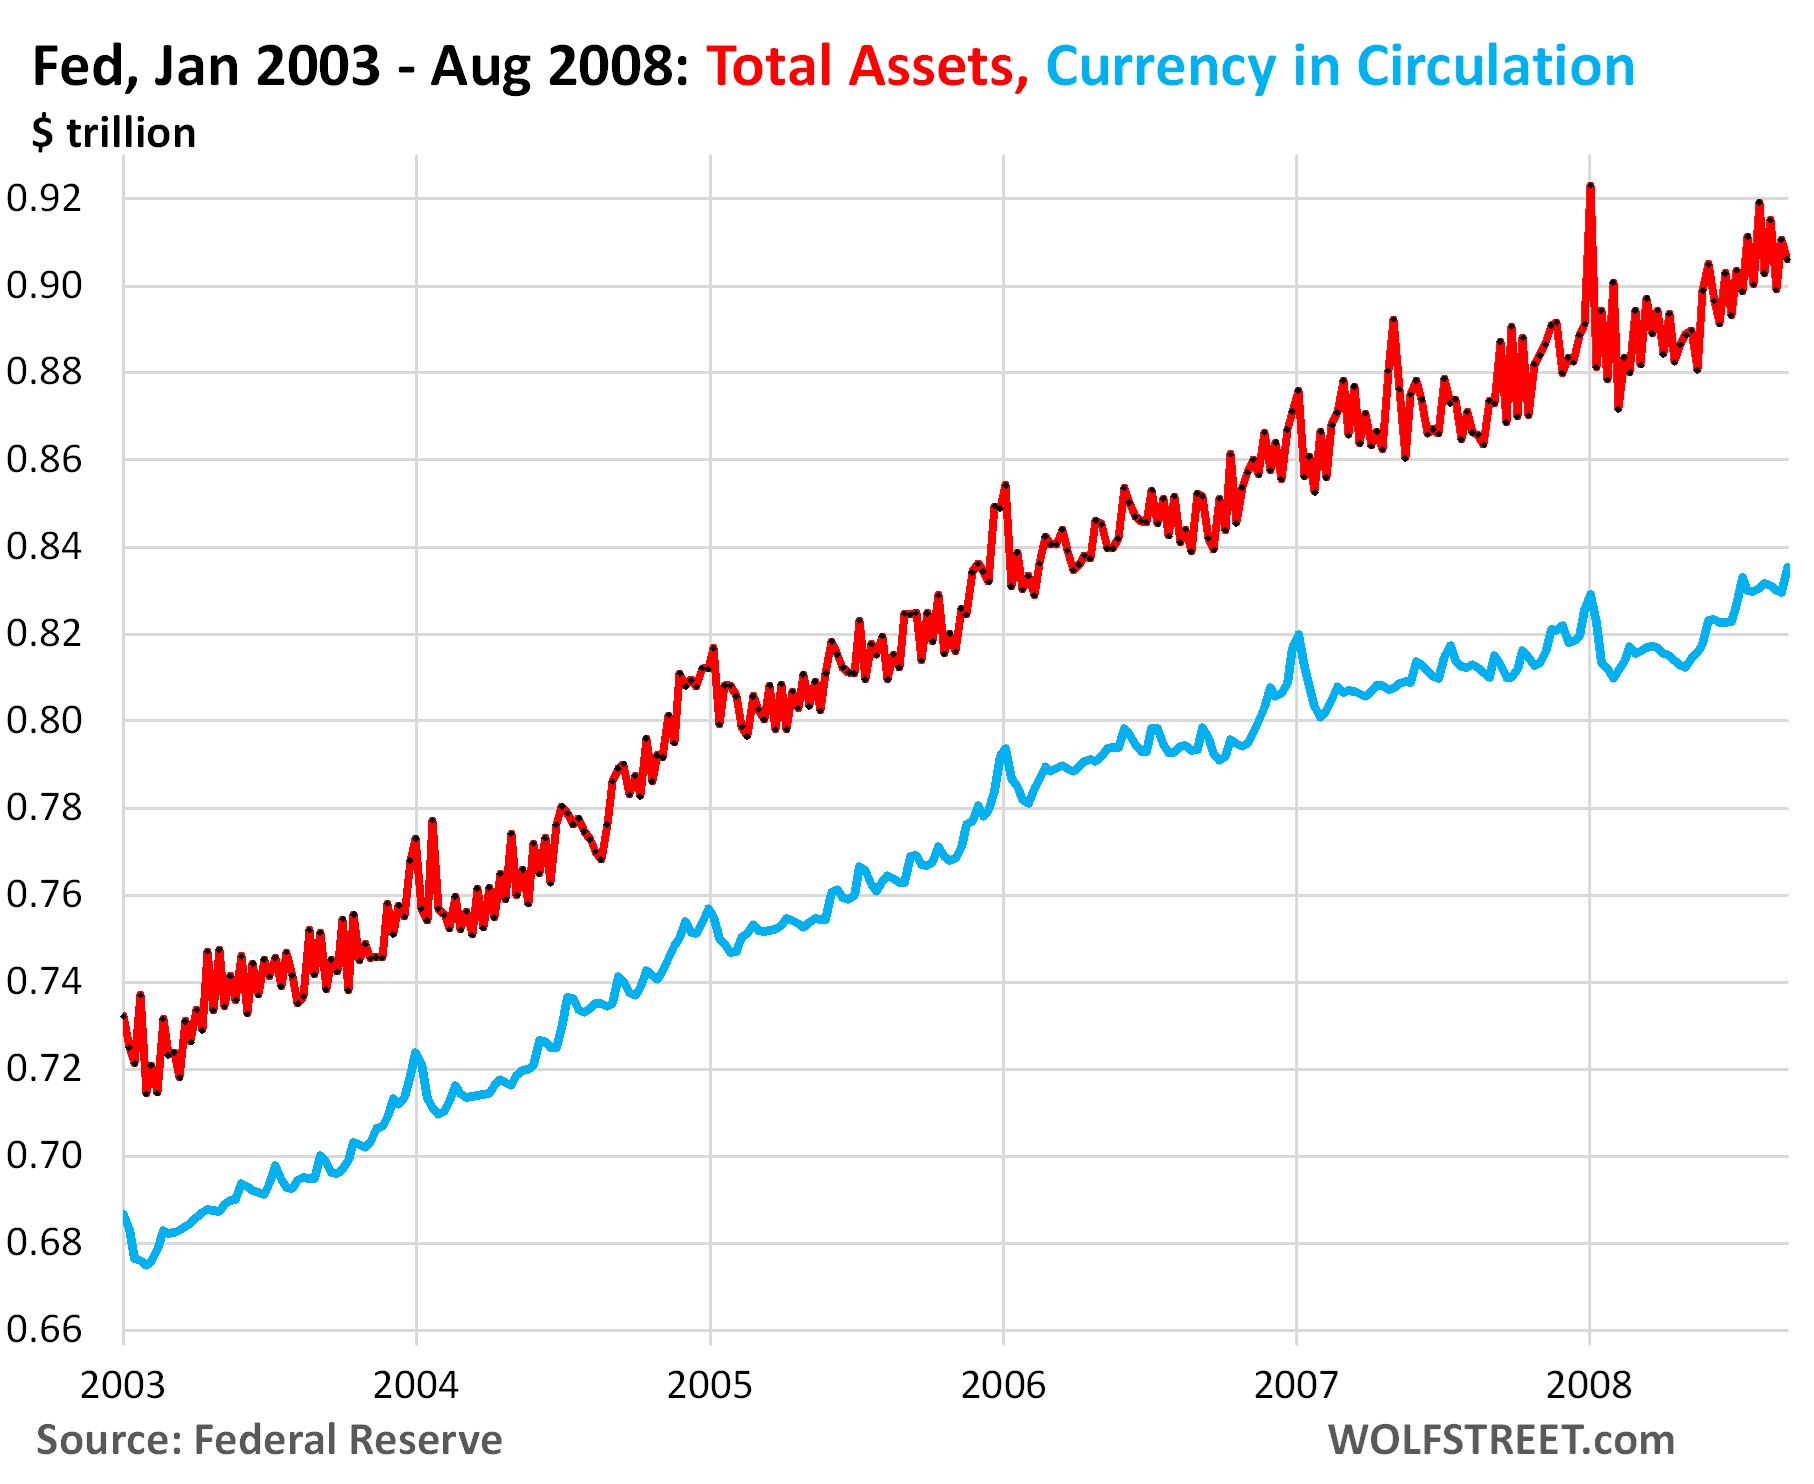
In the era before QE through 2008, the Fed’s balance sheet grew over the years roughly in line with the economy as measured by “current dollar” GDP (so neither the balance sheet nor GDP are adjusted for inflation).
The Fed’s main assets were overnight repos and T-bills. It used its repo market trading to keep the yields in the money markets near its policy rates.
The balance sheet (red in the chart below) grew mostly as a function of “currency in circulation” (paper dollars, blue in the chart below), which are a liability on the Fed’s balance sheet, and reserve balances (also a liability, not shown in the chart) which were influenced daily by the Fed’s repo market trading.
But repo market trading was within a range, and currency in circulation was demand based and grew roughly in line with current-dollar GDP. So the growth rate of the balance sheet closely tracked current-dollar GDP growth rate.
For example, at the beginning of 2003, the Fed’s assets amounted to $732 billion. During that year, its assets grew by 4.4% to $773 billion, while current dollar GDP grew by 4.8%. That’s roughly how it went year after year.
During that time through 2008, the Fed’s balance sheet ran near 6% of GDP. The bouts of QE during and after the Great Recession drove the ratio to 25% by December 2014. QE stopped at that point, and as the balance sheet remained flat while current-dollar GDP kept growing, the ratio fell. Then in late 2017, QT-1 commenced and ran through mid-2019, which accelerated the decline of the ratio, until it dipped below 18% in Q3 2019.
At that point, repo market rates blew out. This multi-trillion-dollar-a-day market made a mess. So the Fed decided to mop up the mess by supplying cash via repos and buying T-bills. By December 2019, the ratio had risen to 19%.
Then pandemic QE exploded on the scene, and the Fed-assets-to-GDP ratio spiked to 35.5% in Q2 2020 and revisited 35.4% in Q1 2022. Then QE stopped. And the ratio has declined ever since.
In July 2021, the Fed revived its Standing Repo Facility (SRF) that the Bernanke Fed had killed in 2009. The SRF is now standing by to prevent that kind of repo market blowout, and its mere presence soothes the money markets. So in theory, the Fed is now prepared to drop the balance sheet below 18% of GDP and let the SRF do its job as it had done in the era before QE.
Enjoy reading WOLF STREET and want to support it? You can donate. I appreciate it immensely. Click on the mug to find out how:

![]()
One of the lessons that wasn’t learned from 2008 was suppression of all volatility delays blowups. The fed needs to stop.
IMO, since 2009, the Fed has expanded their role (unilaterally) to prevent all business cycling….
But cycles play an important part in a free market economy. They flush excesses and encourage discipline.
Delaying blowups, as you note.
But with each “blowup” the Fed accrues MORE power, expands their “role”.
Taylor Rule is needed, IMO.
Say Wolf,
Thank you for this article.
Is there a scenario where the Fed reduces interest rates, but continues to let treasury securities trickle off the balance sheet? Or, is that a counterintuitive idea?
That Fed has already been doing that for 10 months. It cut by 100 basis points last year and continued QT. It’s the official policy that “balance sheet normalization” and monetary policy (interest rates) are independent.
I see, thank you sir!
It’s a miracle inflation hasn’t been higher since 2008.
Inflation has been zooming up since 2008. Visible in the price of housing and stocks. This is known as the “Wealth Effect”.
Inflation was suppressed during the ZIRP era because liquidity struggled to reach the American consumer. The demand for the basket of goods that inflation is measured against did not increase. Instead, that liquidity went towards overseas investment, stock buybacks, real estate, etc. For some consumer goods – like clothing and electronics – overseas investment even suppressed prices. I would not call it a miracle.
Wolf, all the Fed seems to mention is “run off” in Quantitative Tightening. When the Fed does QT ( Quantitative Tightening ), are there any actually selling of the Assets from the Balance Sheet from the Federal Reserve or is it just Letting it Run Off ( Mature ) ?
There are a lot more Treasury securities maturing every month than the Fed wants to shed. Like in August, about $80 billion in Treasury securities mature and come off the balance sheet. So the Fed wants to keep the runoff at $5 billion, and it’ll replace $75 billion of the maturing $80 billion with new securities that it buys at auction. So from that point of view, there is no reason to sell. Obviously, it could decide to do QT faster and let whatever mature run off the balance sheet, and its balance sheet would shrink pretty fast.
But MBS is different. They’re not maturing, they’re coming off via pass-through principal payments, and those have been slower than the Fed wants, and the Fed has been talking about actually selling MBS to speed up the runoff.
Thanks Wolf.
Earlier FED was replacing maturing securities with similar kind longer dated securities.
The new twist you mentioned, “replacing 10-year TIPS with shorter duration i.e. Notes”, is this a shift FED talking about? They have been talking in some speeches. But did they explicitly made a policy?
The notes could be 2-year to 10-year. The shift I was talking about is the effort to get out of the TIPS faster. The Fed played a huge role in the TIPS market during QE, which pushed down the TIPS yield (the interest part) into the negative, thereby artificially pushing down the metric for market-based inflation expectations — one of the metrics the Fed looks at for signs of inflation. In other words, during QE it manipulated the metric it was looking at for signs of inflation expectations. I wrote about it at the time.
The Fed lowering their balance sheet as markets make new highs, real estate, gold, etc holding sharp gains…..GDP up 3%, etc…all points to too much liquidity, past “over monetary stimulation” still sloshing around in the economy.
QE was nuts.
I don’t agree. I wrote in a comment a few weeks ago that while money printing is sufficient for asset bubbles, it’s not necessary.
Here, in my opinion, asset prices are not based on liquidity currently in the market, but about perceptions of future government intervention (including additional liquidity). The asset bubble will persist until something comes to shock the system, and Congress/Fed doesn’t immediately jump in to “do something.” At that point, once investors realize that a rescue/bailout isn’t coming, prices will revert to historical averages.
Given all the history from 2009, it’s not unreasonable that people believe that a bailout will always be coming.
Well I just read a highly touted news letter that said the Fed should abandon its 2% target and move to 3%.
It is the sport of those FULLY INVESTED in everything to push for easy money. They wish to feather their bed off the shaving of dollar value.
That is the elite in this country. Most others suffer from inflation.
How far we have come from “Stable Prices” and NO inflation.
Wait till the tariffs kick in, and they will, they must. To what degree they impact prices can be debated, but it is not a deflationary event.
Big difference in the rule of 72, how long it takes prices to double.
Good Point.
Congress needs to get off its fat a$$ and prohibit QT by law and mandate the orderly sale of all MBS within 4 years and mandate a ceiling on assets the Fed can hold relative to GDP. This is obvious. The Fed has claimed authority it doesn’t Constitutionally hold, and if it can’t be restrained, it should be abolished.
Typo?
“prohibit QT by law” — do you mean “prohibit QE..”?
Oh my goodness yes, my bad,
Happens to me all the time. Glad it happened to someone else for a change 🤣
Well, as Wolf and others have explained the Fed must hold some amount of Treasuries to support bank system liquidity and more importantly to back those Federal Reserve Notes we all hold in our wallets. Those are essentially zero interest bearer bonds issued by the “semi-private” Fed and right now there’s what – $2.5T of cash floating around the world?
Looks to me that we’ve hit rock bottom on the balance sheet Treasuries. $4.2 trillion. I would not be at all surprised to see this number start to creep up again while MBS rolloff continues.
“prohibit [QE] by law”
That is ridiculous. First, QE is just a name for doing more quickly what it has always done: holding treasuries.
Second, it’s just another tool for the Fed to use, albeit one that they now know can have serious side-effets and thus must be used with care.
Third, some times (e.g. pandemic spending) actions like this are required. If Congress hadn’t spent the money, the Fed wouldn’t have needed to do QE.
You’re blaming the wrong people.
Until 2008, the Fed never saw the need to own Treasuries more than roughly 6% of GDP, QE is wildly wildly more than this, and it has massive consequences, there is nothing in the Fed charter or our Constitution that allows this, and it should be limited to what it was prior to 2008 before the Fed completely destroys the dollar.
And somehow we survived a Century of Fed governance without QE. I think we can somehow limp along without them devaluing the dollar and inflating bubbles.
Excellent article. One thing that I’m missing is more intuition into how to interpret these charts. E.g. the Fed’s balance sheet in relationship to GDP, as I understand it, is a measure of stimulus in economy, potentially unproductive investment, so when it goes down that should put upwards pressure on overall economic productivity. Or maybe another way to look at it is, that ratio is a measure of interest rates repression and thus a transfer from net savers (households?) to net borrowers (businesses?), so with it going down we’d expect higher household incomes from savings and thus more consumption.
Or in other words – why is it important to the Fed to reduce their balance sheet? What effects should we expect from the balance sheet decrease?
I wonder how bad the housing market has to get before the FED starts buying MBS again. If the FED continues to shed MBS the only cure for high prices are high prices.
The Fed started buying MBS twice and now regrets it and has trouble getting rid of them.
1. when the banking system was in the process of collapsing because mortgages were going bad because the collateral values plunged. It bought MBS to push up these collateral values and save the banks. But now the banks are off the hook, they now hold less than 20% of the mortgages, while the risk of over 80% of the mortgages has been transferred to government entities and investors. So, with banks off the hook, the Fed doesn’t care anymore.
2. the once-in-a-(my)-lifetime pandemic.
Neither one of them are going to be factors going forward — the #1 for the reason I explained: banks are off the hook and so the Fed doesn’t care anymore.
Thank you Wolf. Looks like the only answer to the freeze up in home sales for now is much lower prices. There is some adjustment happening now in the form of inflation and concessions resale sellers are paying while prices dip and wages move up easing the affordability factor but not enough to jump start sales.
Wolf…
has the Fed ever tried to control the long end?
it sure looks like they tried with all those MBS purchases, pushing long rates to perhaps all time lows.
So if that was their goal, they achieved it…and so much for “the Fed only controls the short end” commentary.
Was that the first time the Fed entered the long end with the intent of controlling it?
Thanks
@J J Pettigrew
Yes, operation twist.
Not WR but the answer is Yes .
FED can easily control the long end yield by dong QE ie buying long bonds. The decade plus long asset inflation we saw is all because of QE.
Well it is manifest that the Fed did control long rates…..for a time…and now sits on about $1 Trillion in paper losses.
Rates popped back up…
So the “try” was unsuccessful in the long run….and costly, which I assume is why the Fed, until then, did not venture into the long end as a matter of policy.
From the commies at the Fed, a few weeks ago:
“ Net income is expected to turn positive again as interest expenses fall, and remittances will resume once the temporary deferred asset falls to zero. As a result of the ongoing reduction in the size of the Federal Reserve’s balance sheet, interest expenses will fall over time in line with the decline in the Federal Reserve’s liabilities”
Related commies say:
“ Using survey-based assumptions about the path of interest rates, the projections indicate that total SOMA net income could remain negative in 2025, driven by the cost of interest-bearing Federal Reserve liabilities, before returning to positive levels in subsequent years,” the report said”
Resumption of Remittances: Transfers to the Treasury are only anticipated to resume after the deferred asset, which accumulated during the period of negative net income, is paid down. Estimates suggest this could happen around mid-2027.
In essence, while positive Federal Reserve net income and remittances can help mitigate the federal deficit and reduce the need for Treasury issuance, the current situation of negative net income and the deferred asset means this potential benefit is currently unavailable. This places a greater burden on Treasury to issue debt to meet its financing needs.
Thank God the deficit was increased $4 trillion — on to the trash bin …
The repo market blowout coincided with the low in bank reserves since October 2012.
I’ve been giving some though to this lately. It might not be a bad thing that the Fed still has this much on the books. If tariffs start driving prices up, the Fed may need to do something in not sure has been done before. Lower interest rates while executing QT with it’s balance sheet. If unemployment is going up, lower rates should lead to more employment, while reducing the balance sheet should keep prices in check (less supply of money should be deflationary in a perfect world). I think the worst case would be not having a balance sheet with enough on it to execute QT.
I cut back from drinking an entire 1.75 liter of booze to only 1.5 liters.
Buying two fifths is almost twice as much, but I’m a drunken sailor.
Well, the collective dip$hit$ must be doing something right. As I type the 10 year is sitting at 4.28, 3 bp above the overnight, and right in the middle of a range it has held for the past two years.
Do you want to take that bet for 10 years? I don’t. Not when I can roll over 4-6 week notes in the 4.3-4.5 range.
The problem with T-bills is that their yield goes down when the Fed cuts its rates. So when the Fed cut by 100 basis points last year, T-bill yields dropped from 5.4%/5.5% to about 4.3%/4.4%. Now another rate cut is getting priced in, and the six-month yield for example is down to 4.12%.
I don’t think the Fed can cut a lot because the bond market is going to throw a hissy fit at the long end if it does. But that 4.3% may not hold much longer.
We started shifting some of our T-bills into 10-year TIPS at the auction in July (I mentioned that here) since I’m concerned inflation might not just vanish, that it might become a 3-4% feature here. TIPS pay a variable inflation compensation based on CPI that is added to the principal, and the stuff we bought also pays close to 2% on this growing principal in coupon interest. I figured if CPI is around 3% over the 10 years on average, they’ll yield about 5%. In periods when inflation spikes to 6%, they’ll pay 8%. (We have those in our tax-deferred accounts so we don’t have to mess with the tax issues that TIPS come with).
TIPS used to have a negative yield during QE (instead of the 2% at the last auction). Those were really shitty deals. But that was the Fed’s doing back then. Now the Fed is unloading its TIPS and is replacing them with regular notes as I mentioned above.
In a normal world your TIPS answer would be fine.
How are they going to work in a world where an administration can just make up inflation numbers?
This administration has already shown that they are willing to fire anyone who reports bad economic numbers (no matter how accurate they are) and then have presentations in the White House by the partisan Heritage Foundation showing whatever economic data they want to make up.
That is just the first step.
What is Russia’s official inflation rate versus their actual, real inflation rate? That is where we are going. How will TIPS do there?
“What is Russia’s official inflation rate…”
You cannot have it both ways. If have Russia’s inflation, you’ll have Russia’s interest rates, not the Fed’s interest rates.
Russia’s official inflation = 9.4% now, it was over 10% a couple of months ago.
The Bank of Russia’s policy interest rate = 18% (helps put a lid on inflation)
So if that happens here, T-bill rates will be 18%.
What would be implications of Fannie Mae and Freddie Mac going public? It seems that outright selling of MBS will impact FM & FM significantly as public stock investors will lose.
It all depends on the small print. My understanding is that the government will remain the guarantor of the mortgages for a fee, as today, to privatize profits, socialize the risks, but hopefully for a big enough a fee. If that is the case, there might not by much impact.
In terms of the Fed selling MBS, this is hot off the press and gets into it:
https://wolfstreet.com/2025/08/08/government-sold-724-billion-of-treasuries-this-week-debt-hits-37-0-trillion-getting-ready-for-the-feds-shift-to-t-bills/