Lots of inventory, little demand: Median days on the market before homes got pulled or sold spiked to 70 days in Phoenix.
By Wolf Richter for WOLF STREET.
Here are the inventories of homes for sale, and the median number of days they spent on the market, in the biggest metros in the West, other than those in California, which we already discussed here.
Inventories have surged in these markets not because there is a flood of new listings – there isn’t – but because demand has plunged. This shows up in the spiking number of days a home sits on the market before it sells or is pulled off the market; this metric of median days on the market soared despite a surge in delistings by frustrated sellers that couldn’t sell their homes for what they wanted.
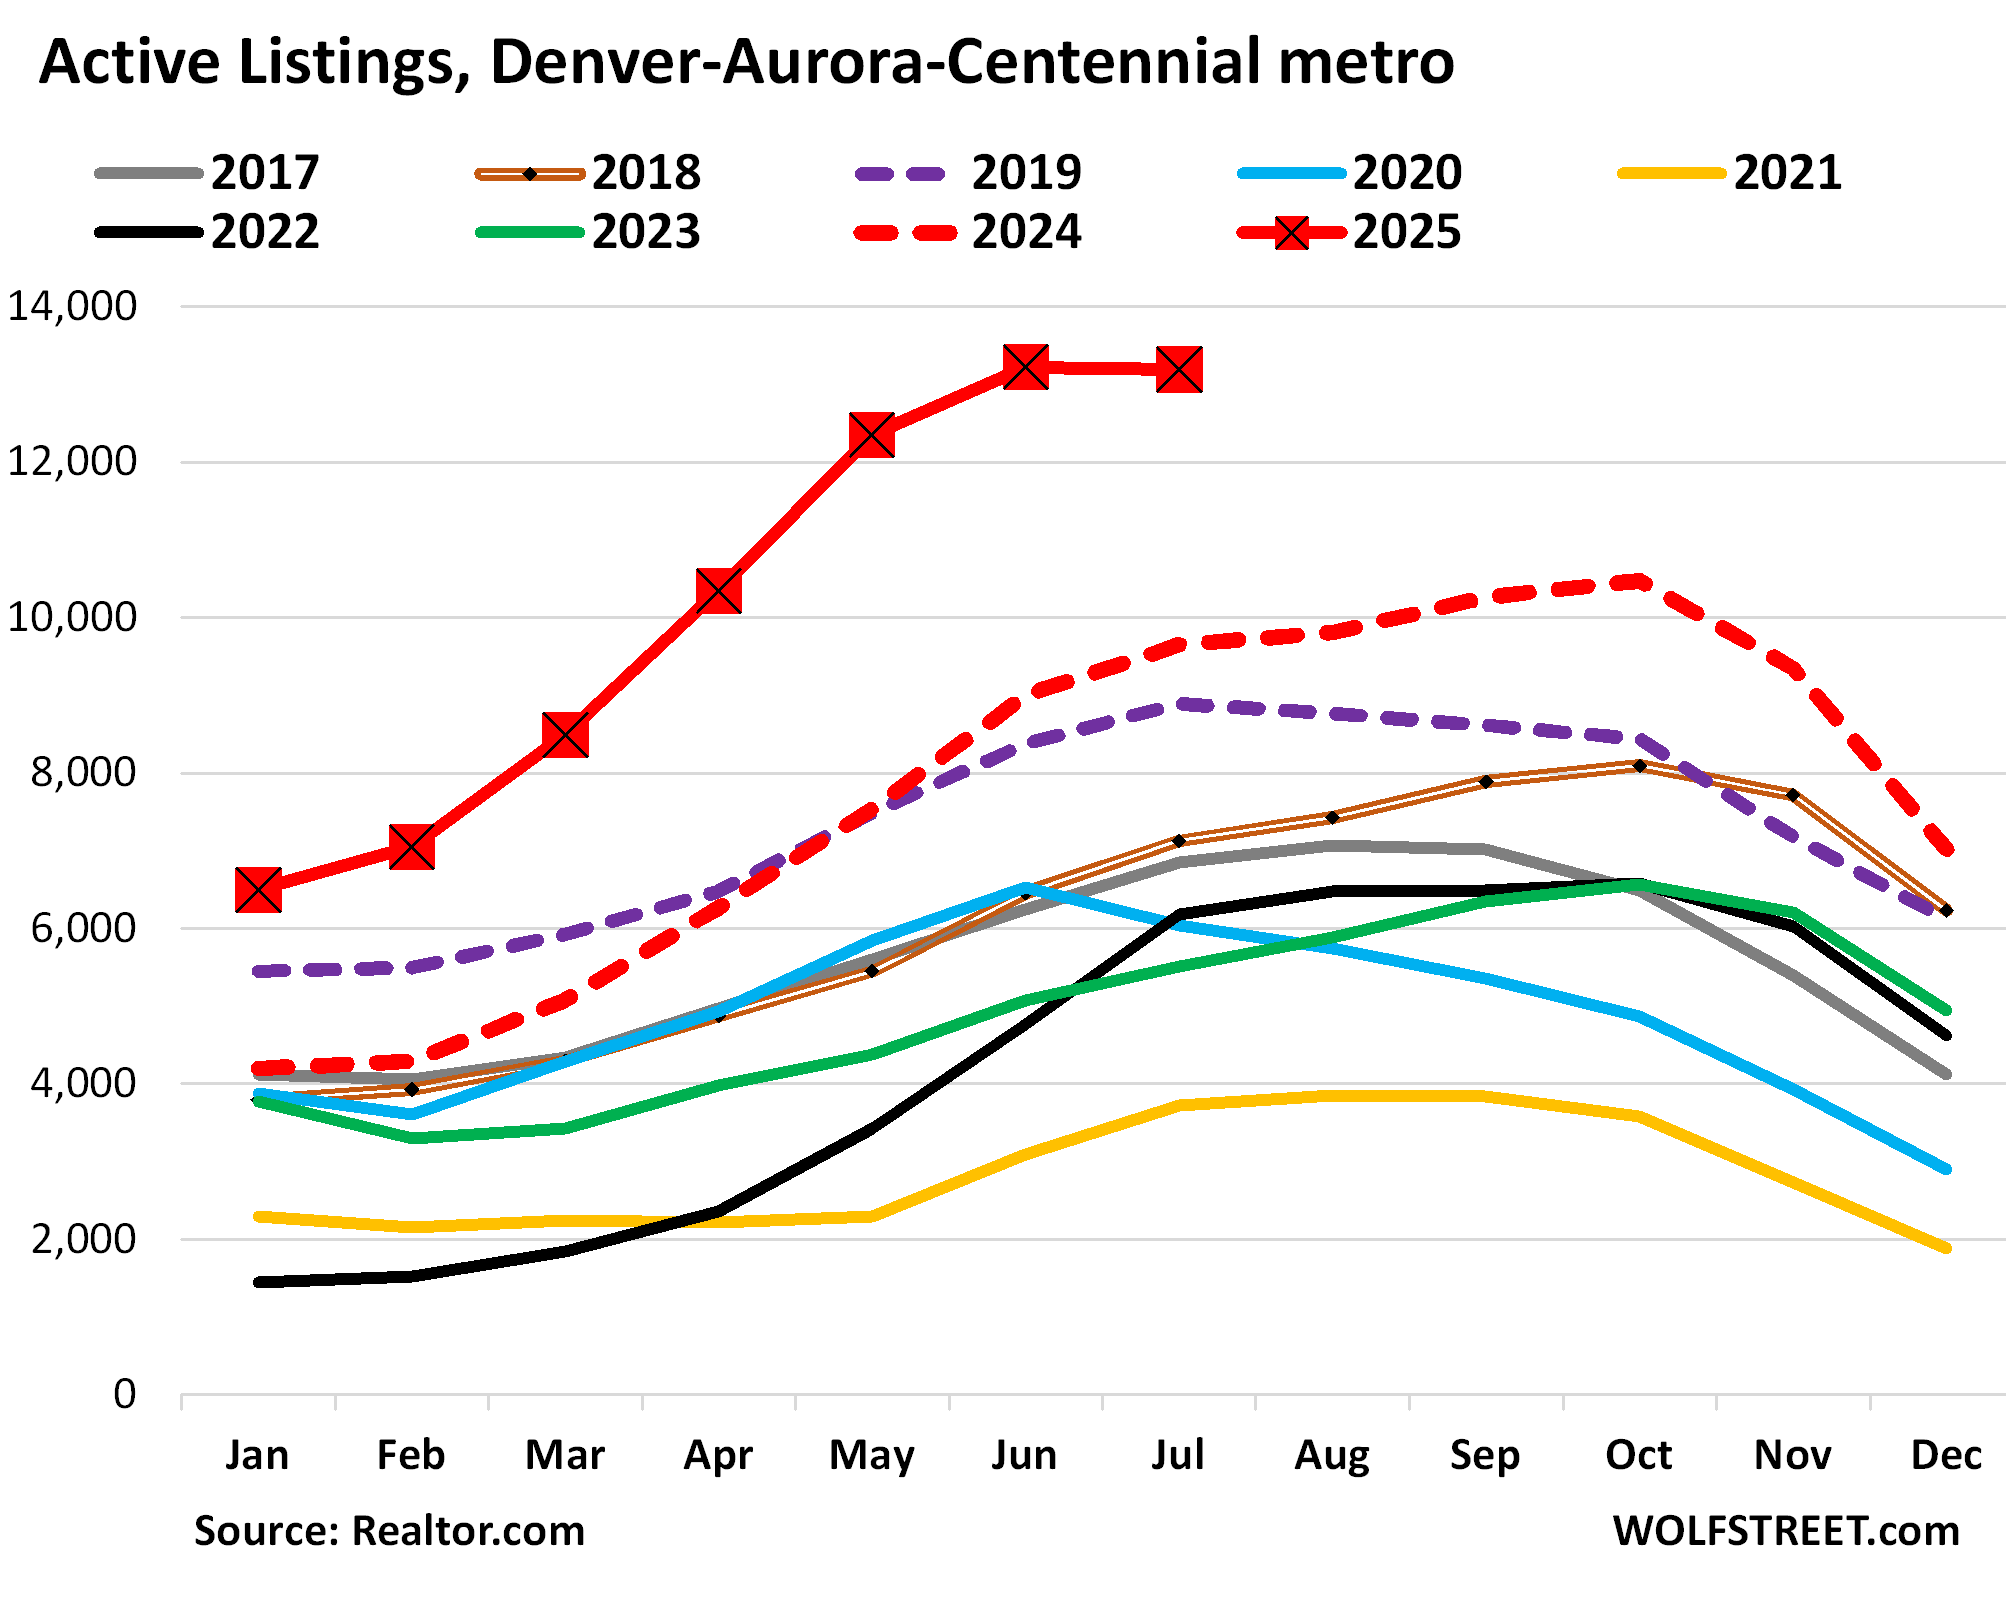
In the Denver-Aurora-Centennial metro, active listings in July jumped by 37% year-over-year and by 139% from July 2023, and by 48% from July 2019 (dotted purple), to 13,197 listings, along with June the most in the decade of data from Realtor.com.
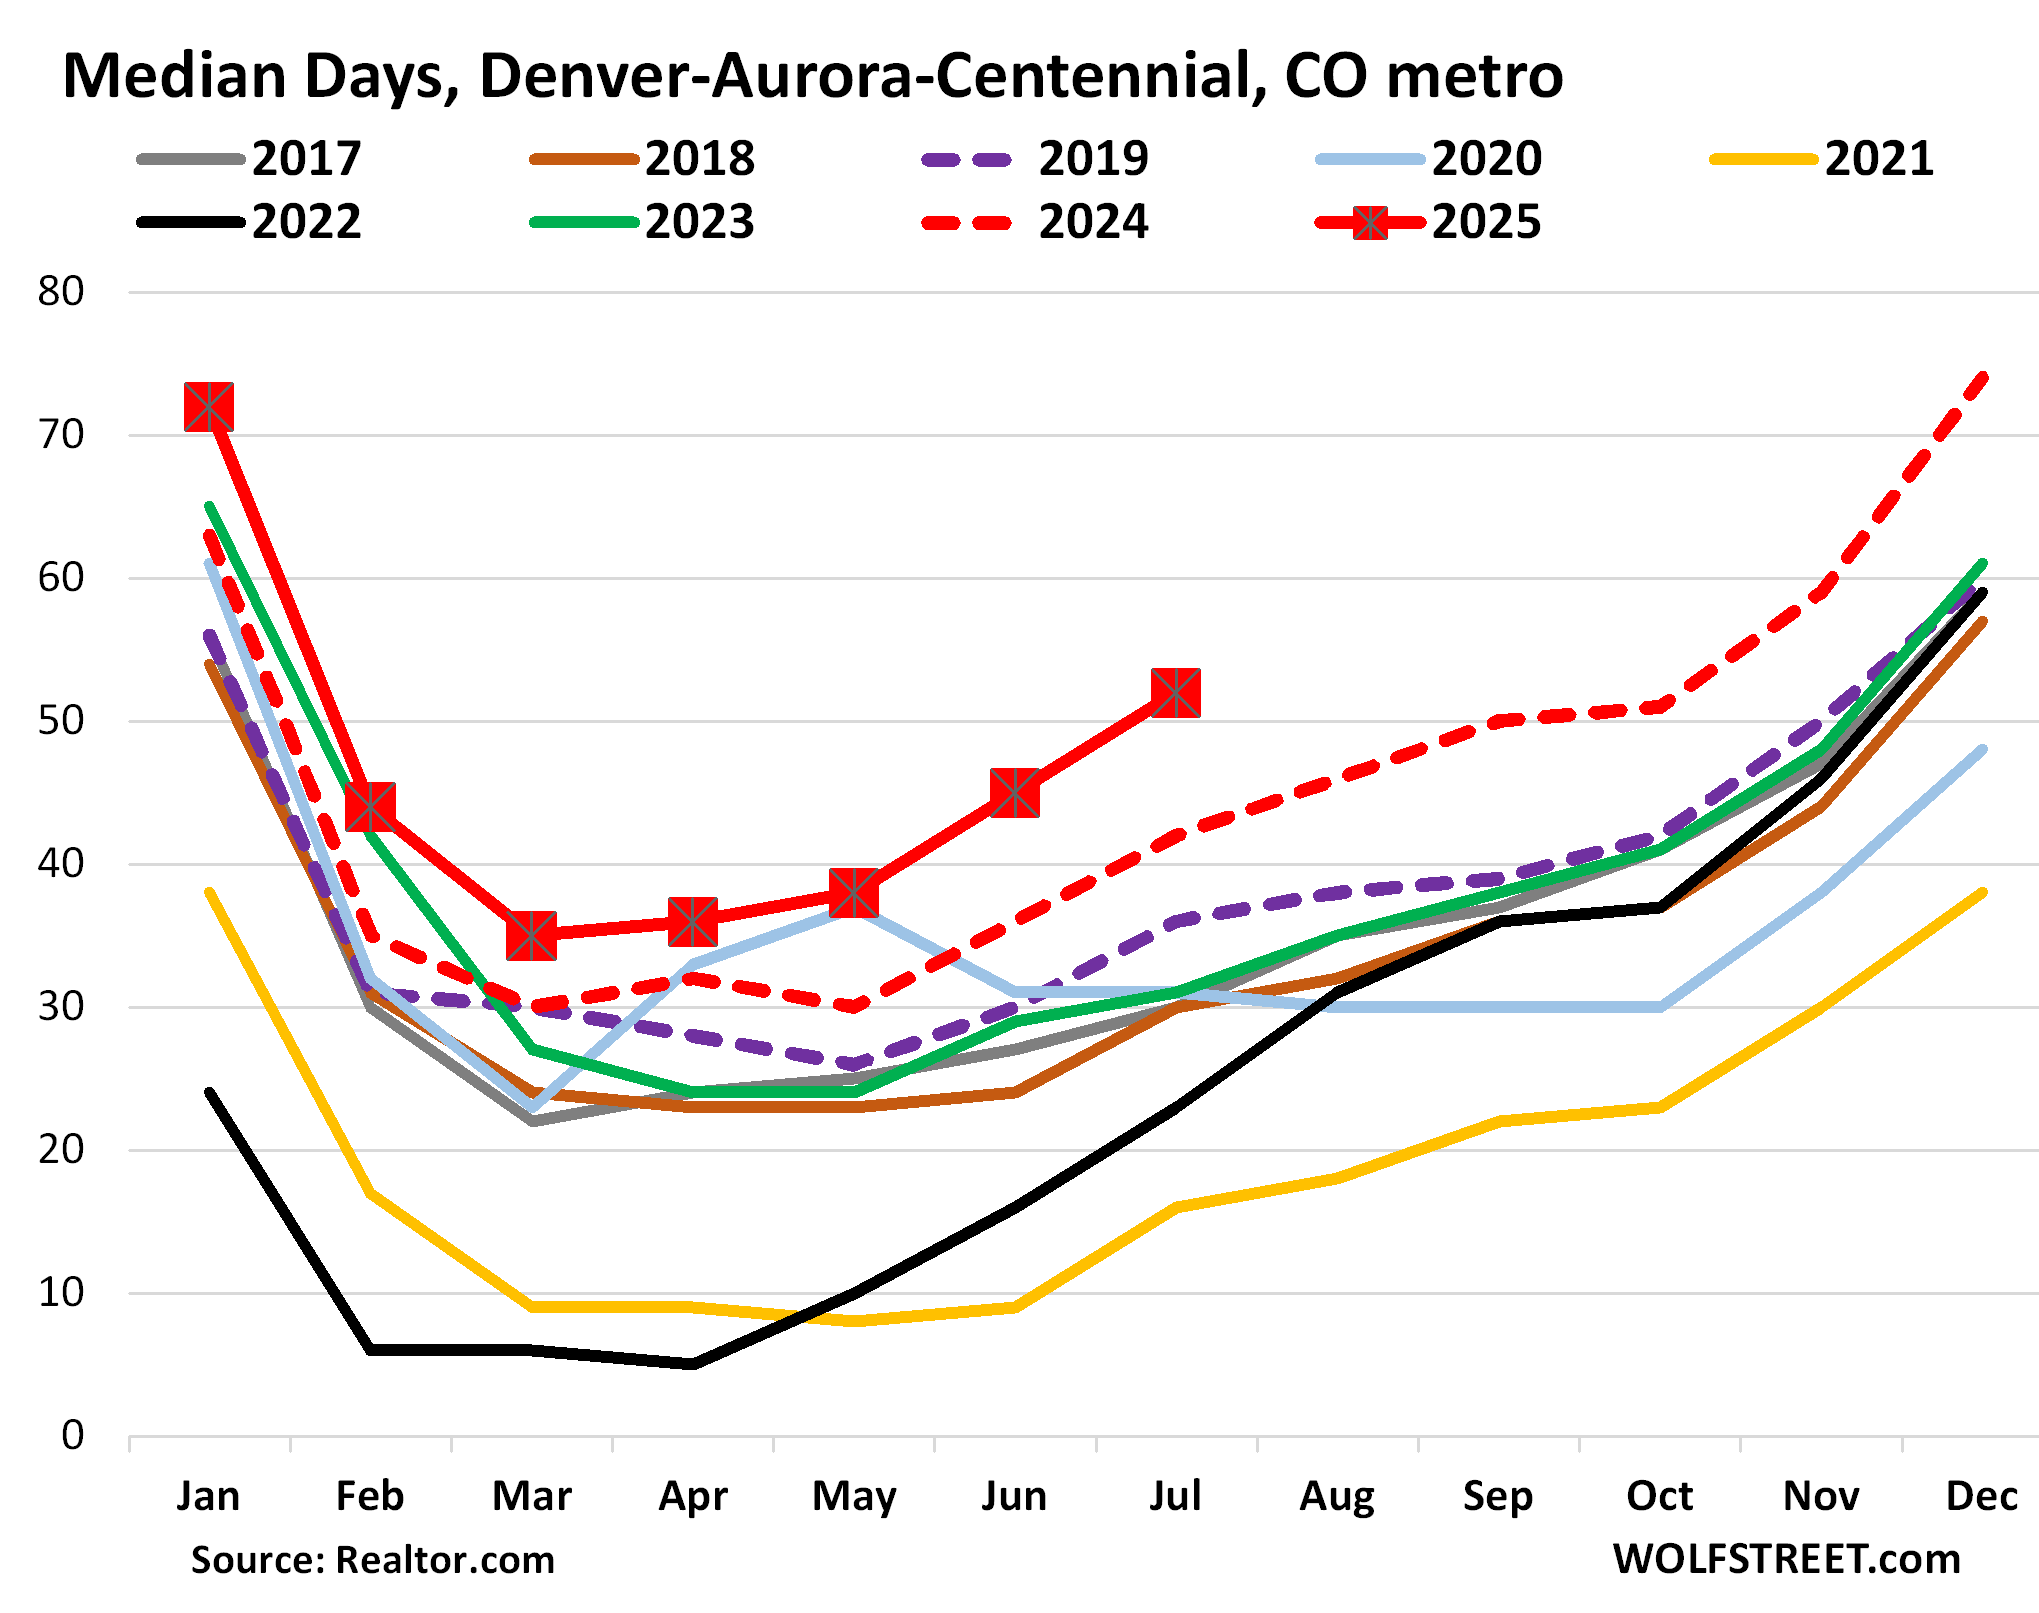
Median days on the market jumped to 52 days before homes were sold or pulled off the market, the longest for any July in the decade of data; up from 42 days a year ago, the second-longest in the data (dotted red); and up from 36 days in July 2019, the third-longest for any July in the data (dotted purple).
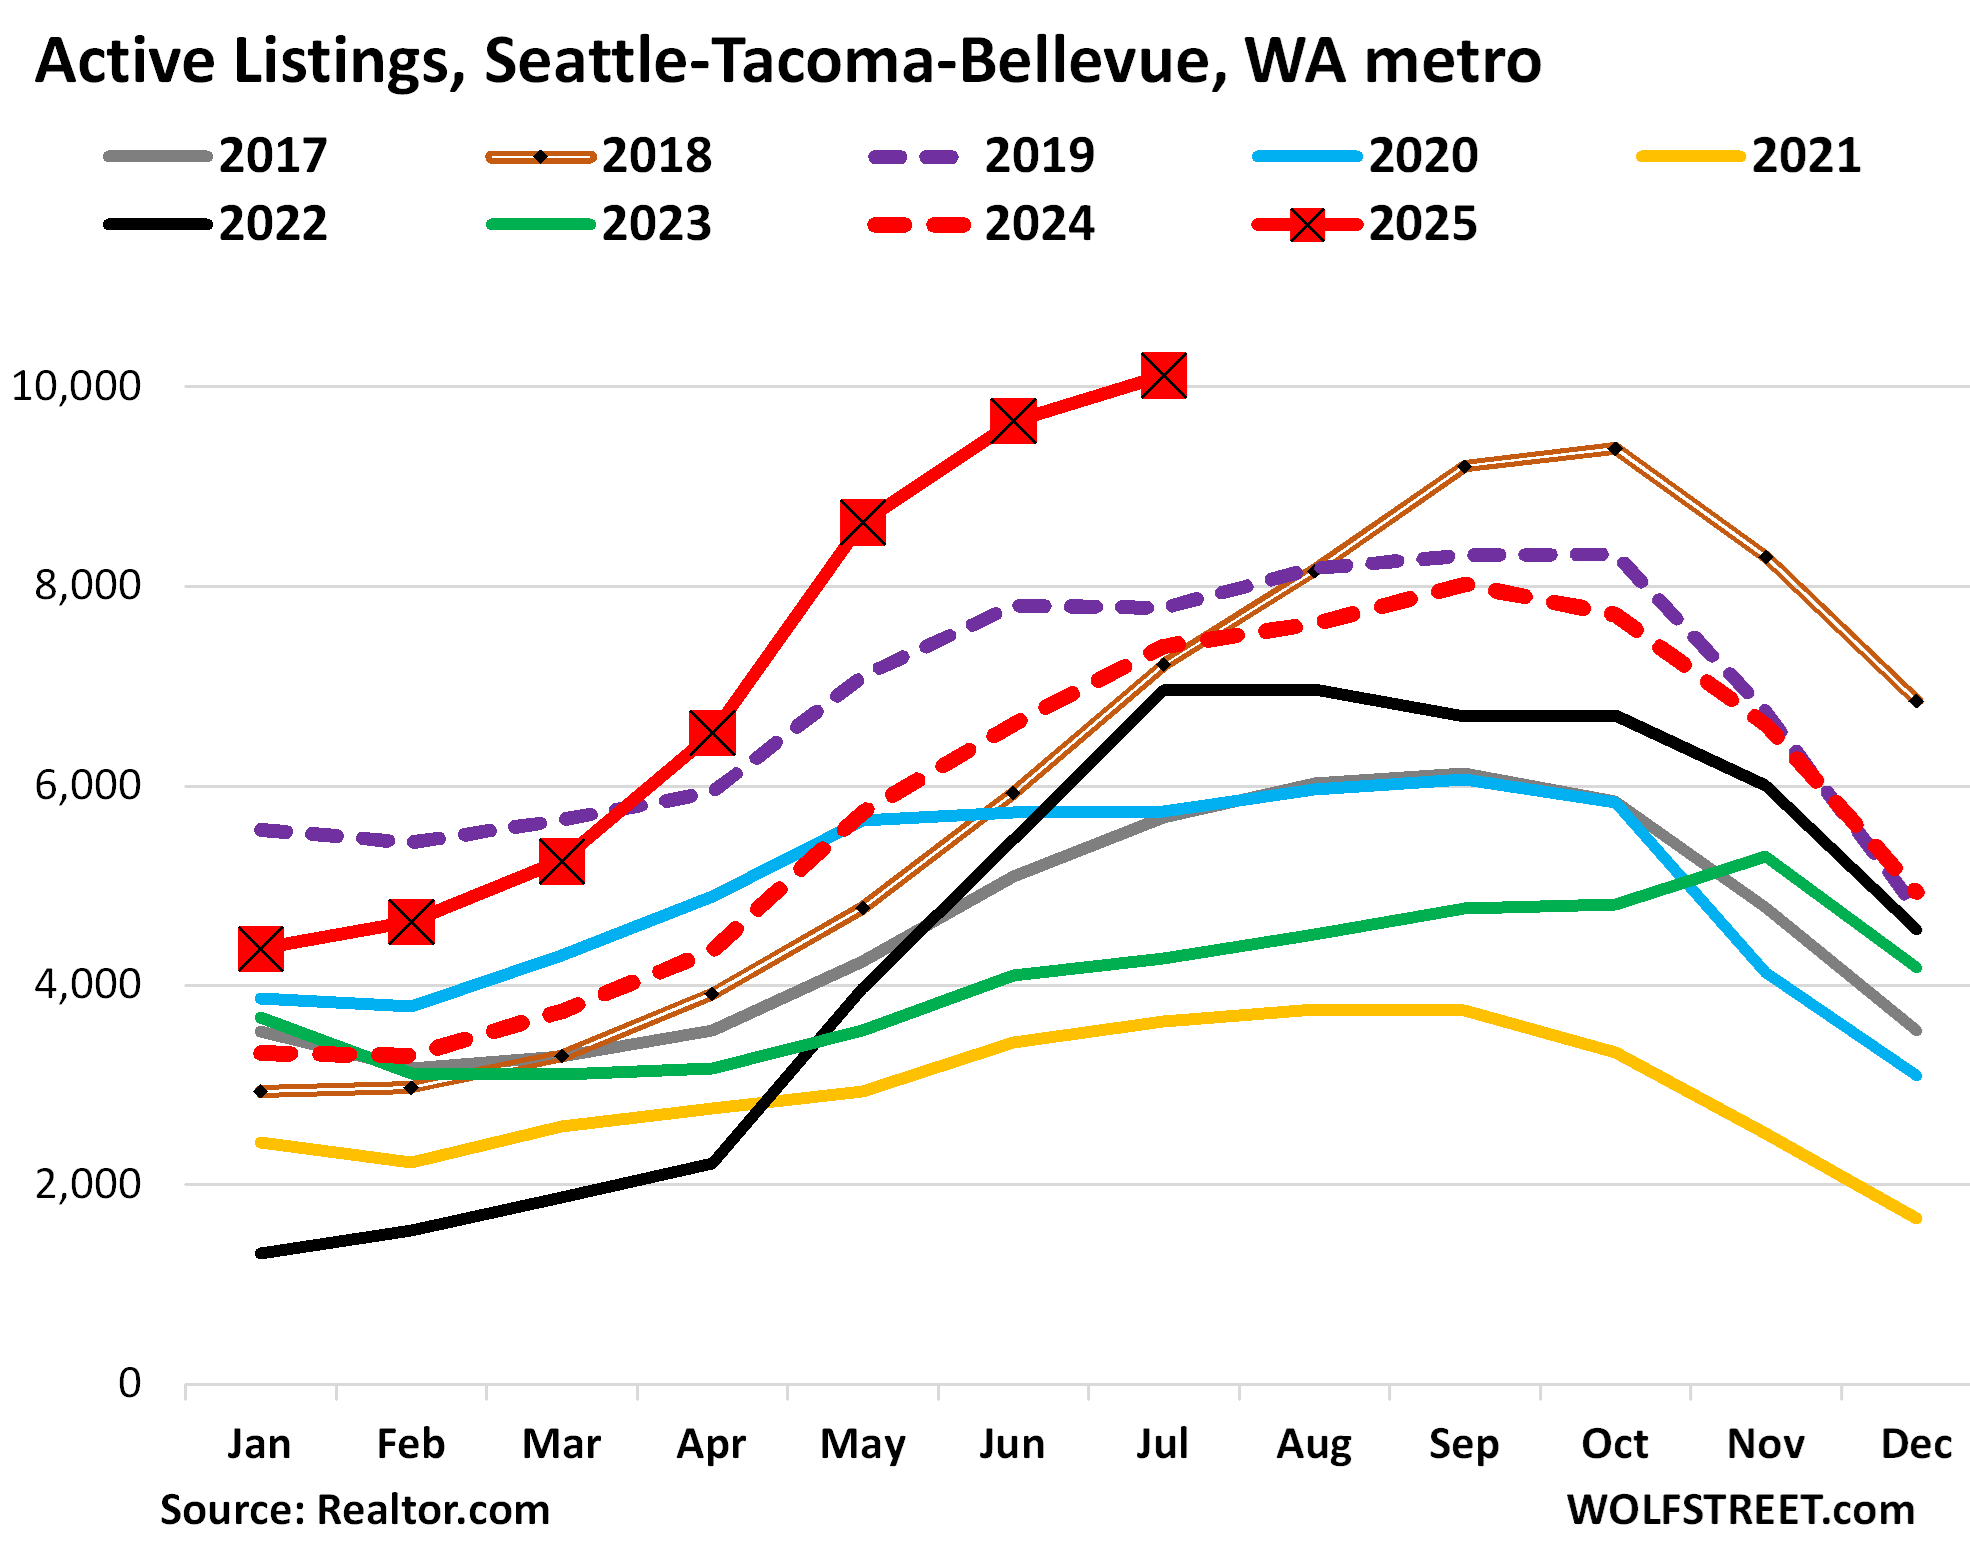
In the Seattle-Tacoma-Bellevue metro, active listings in July spiked by 46% from July 2024 (dotted red line) and by 136% from July 2023, to 9,655 homes for sale, the most in the decade of data from Realtor.com. Compared to July 2019 (dotted purple), the prior high in the data, inventory is up by 24%.
The median number of days that a home sits on the market before it sells or gets pulled off the market rose to 40 days, the highest for any July in the data.
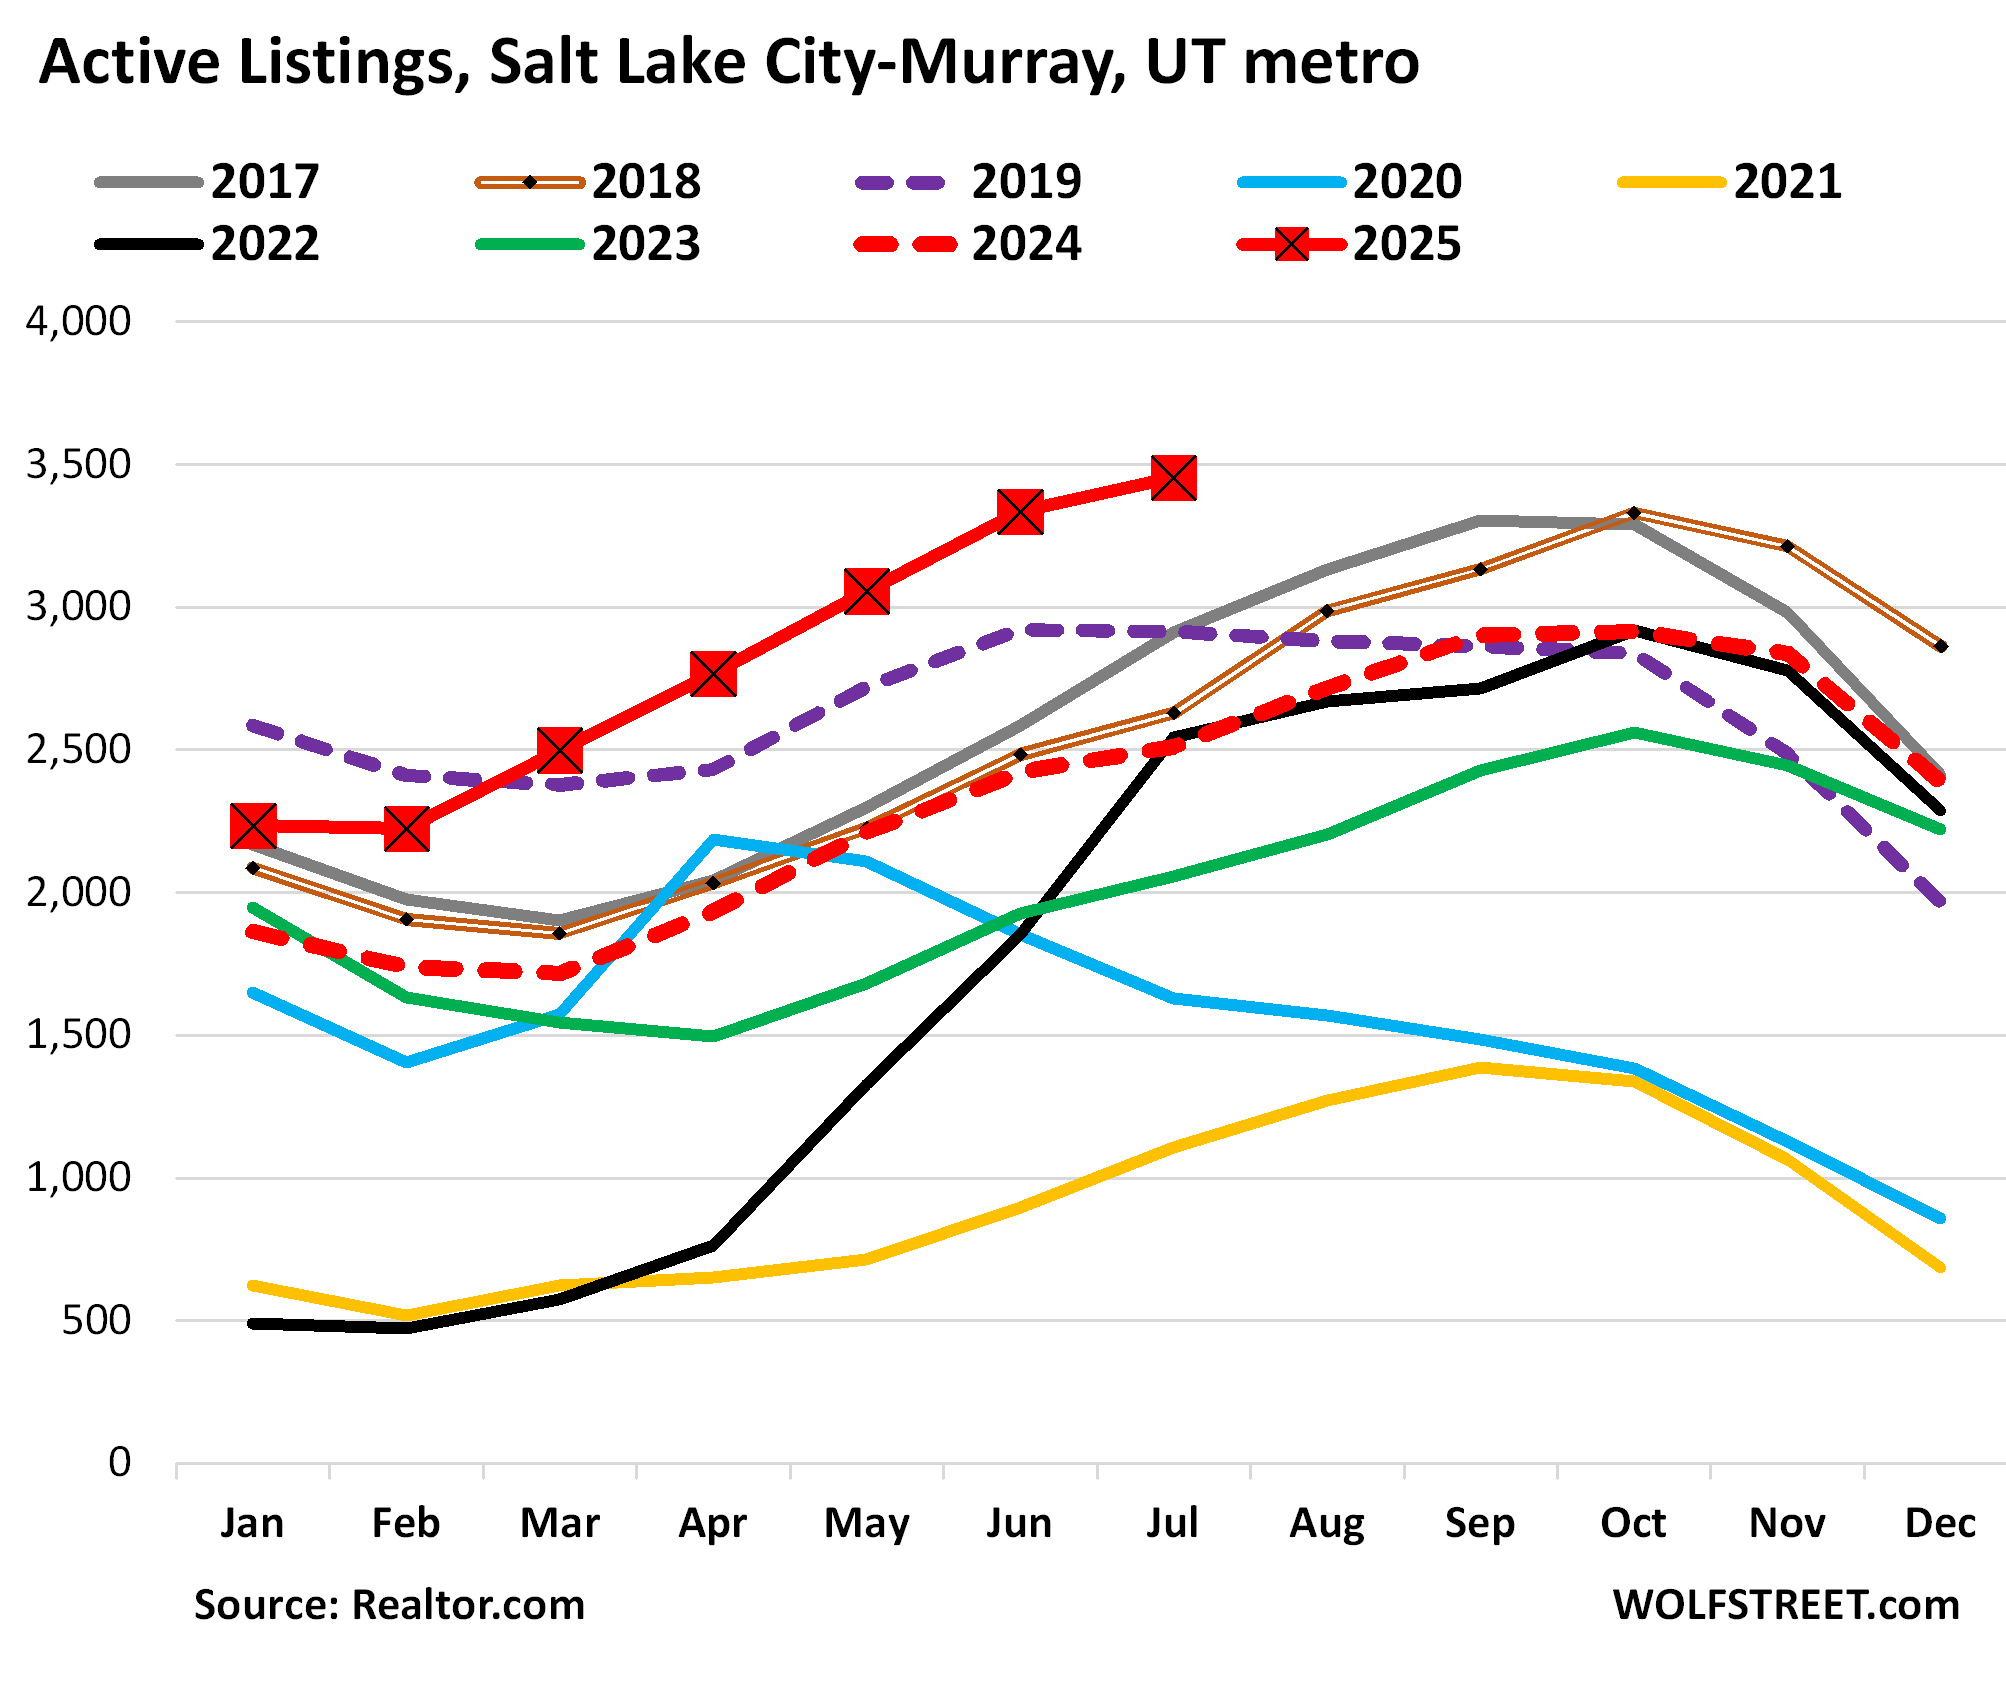
In the Salt Lake City-Murray metro, active listings jumped by 38% year-over-year, by 68% from 2023, and by 19% from July 2019, to 3,454 listings, the highest in the decade of data from Realtor.com. The past five months have all been the highest in the data.
Median days on the market jumped to 52 days in July, the highest for any July in the decade of data, and up from 45 days in July 2024, the second-highest for any July in the data.
In the Phoenix-Mesa-Chandler metro, active listings jumped by 37% year-over-year, by 121% from July 2023, and by 37% from July 2019, to 18,157 homes for sale, the highest for any July in the decade of data from Realtor.com. The past five months have all been the highest in the decade of data.
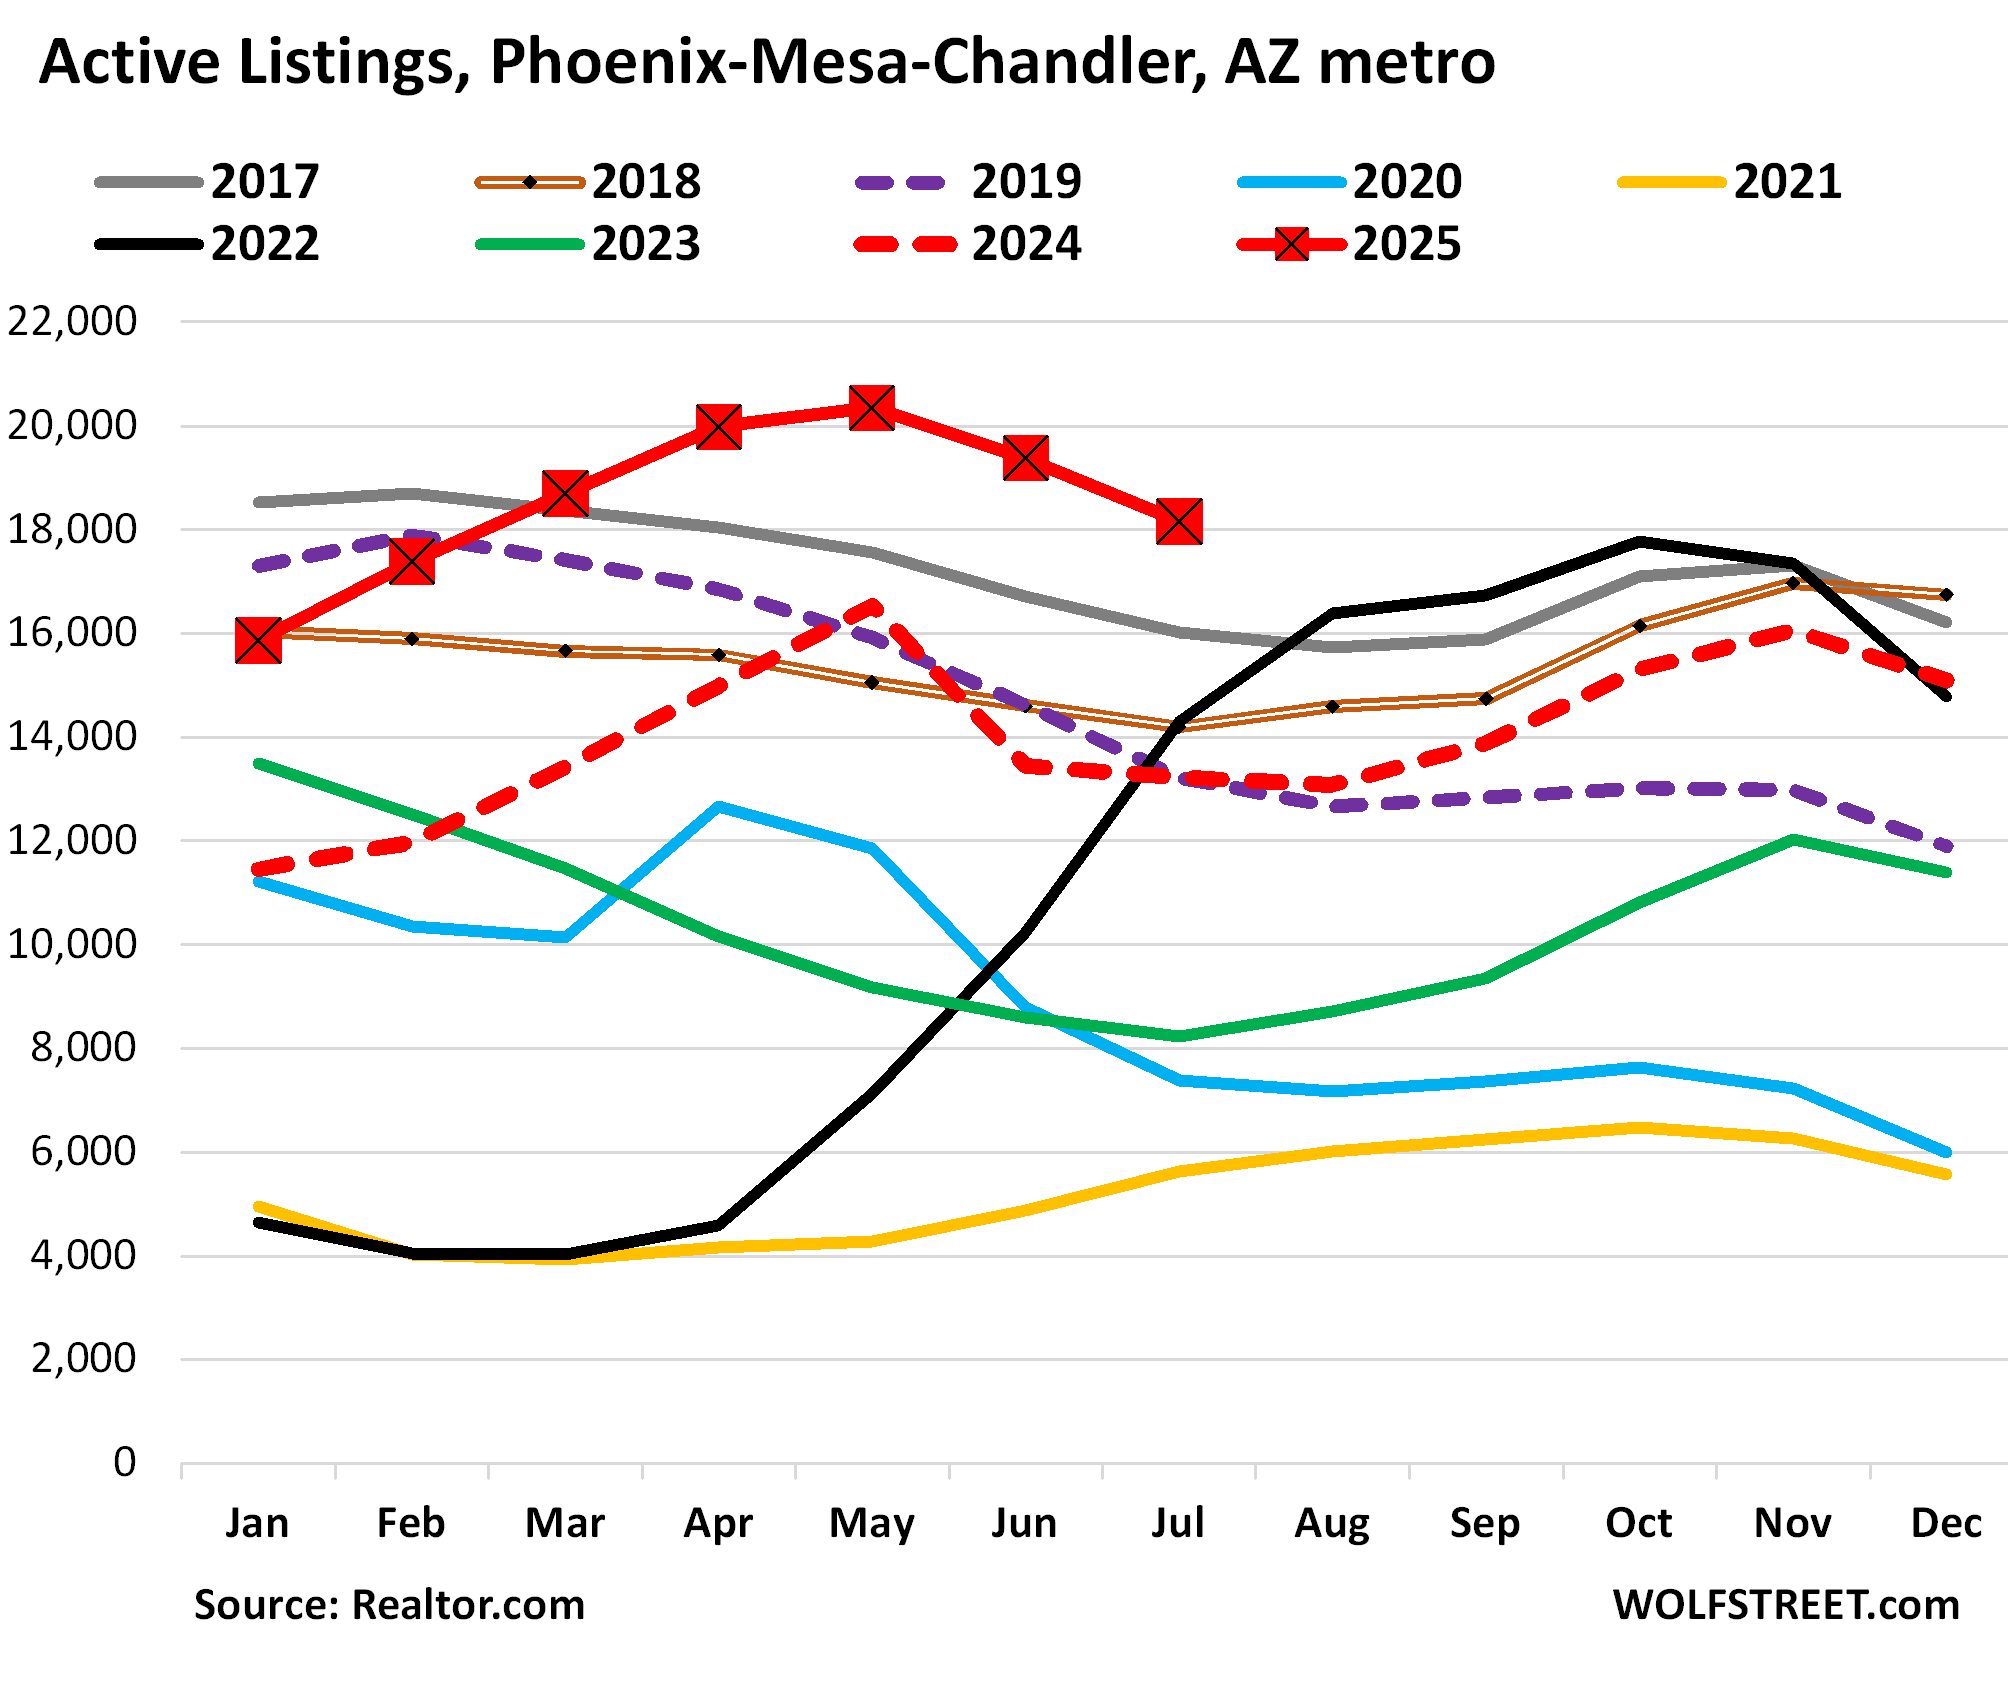
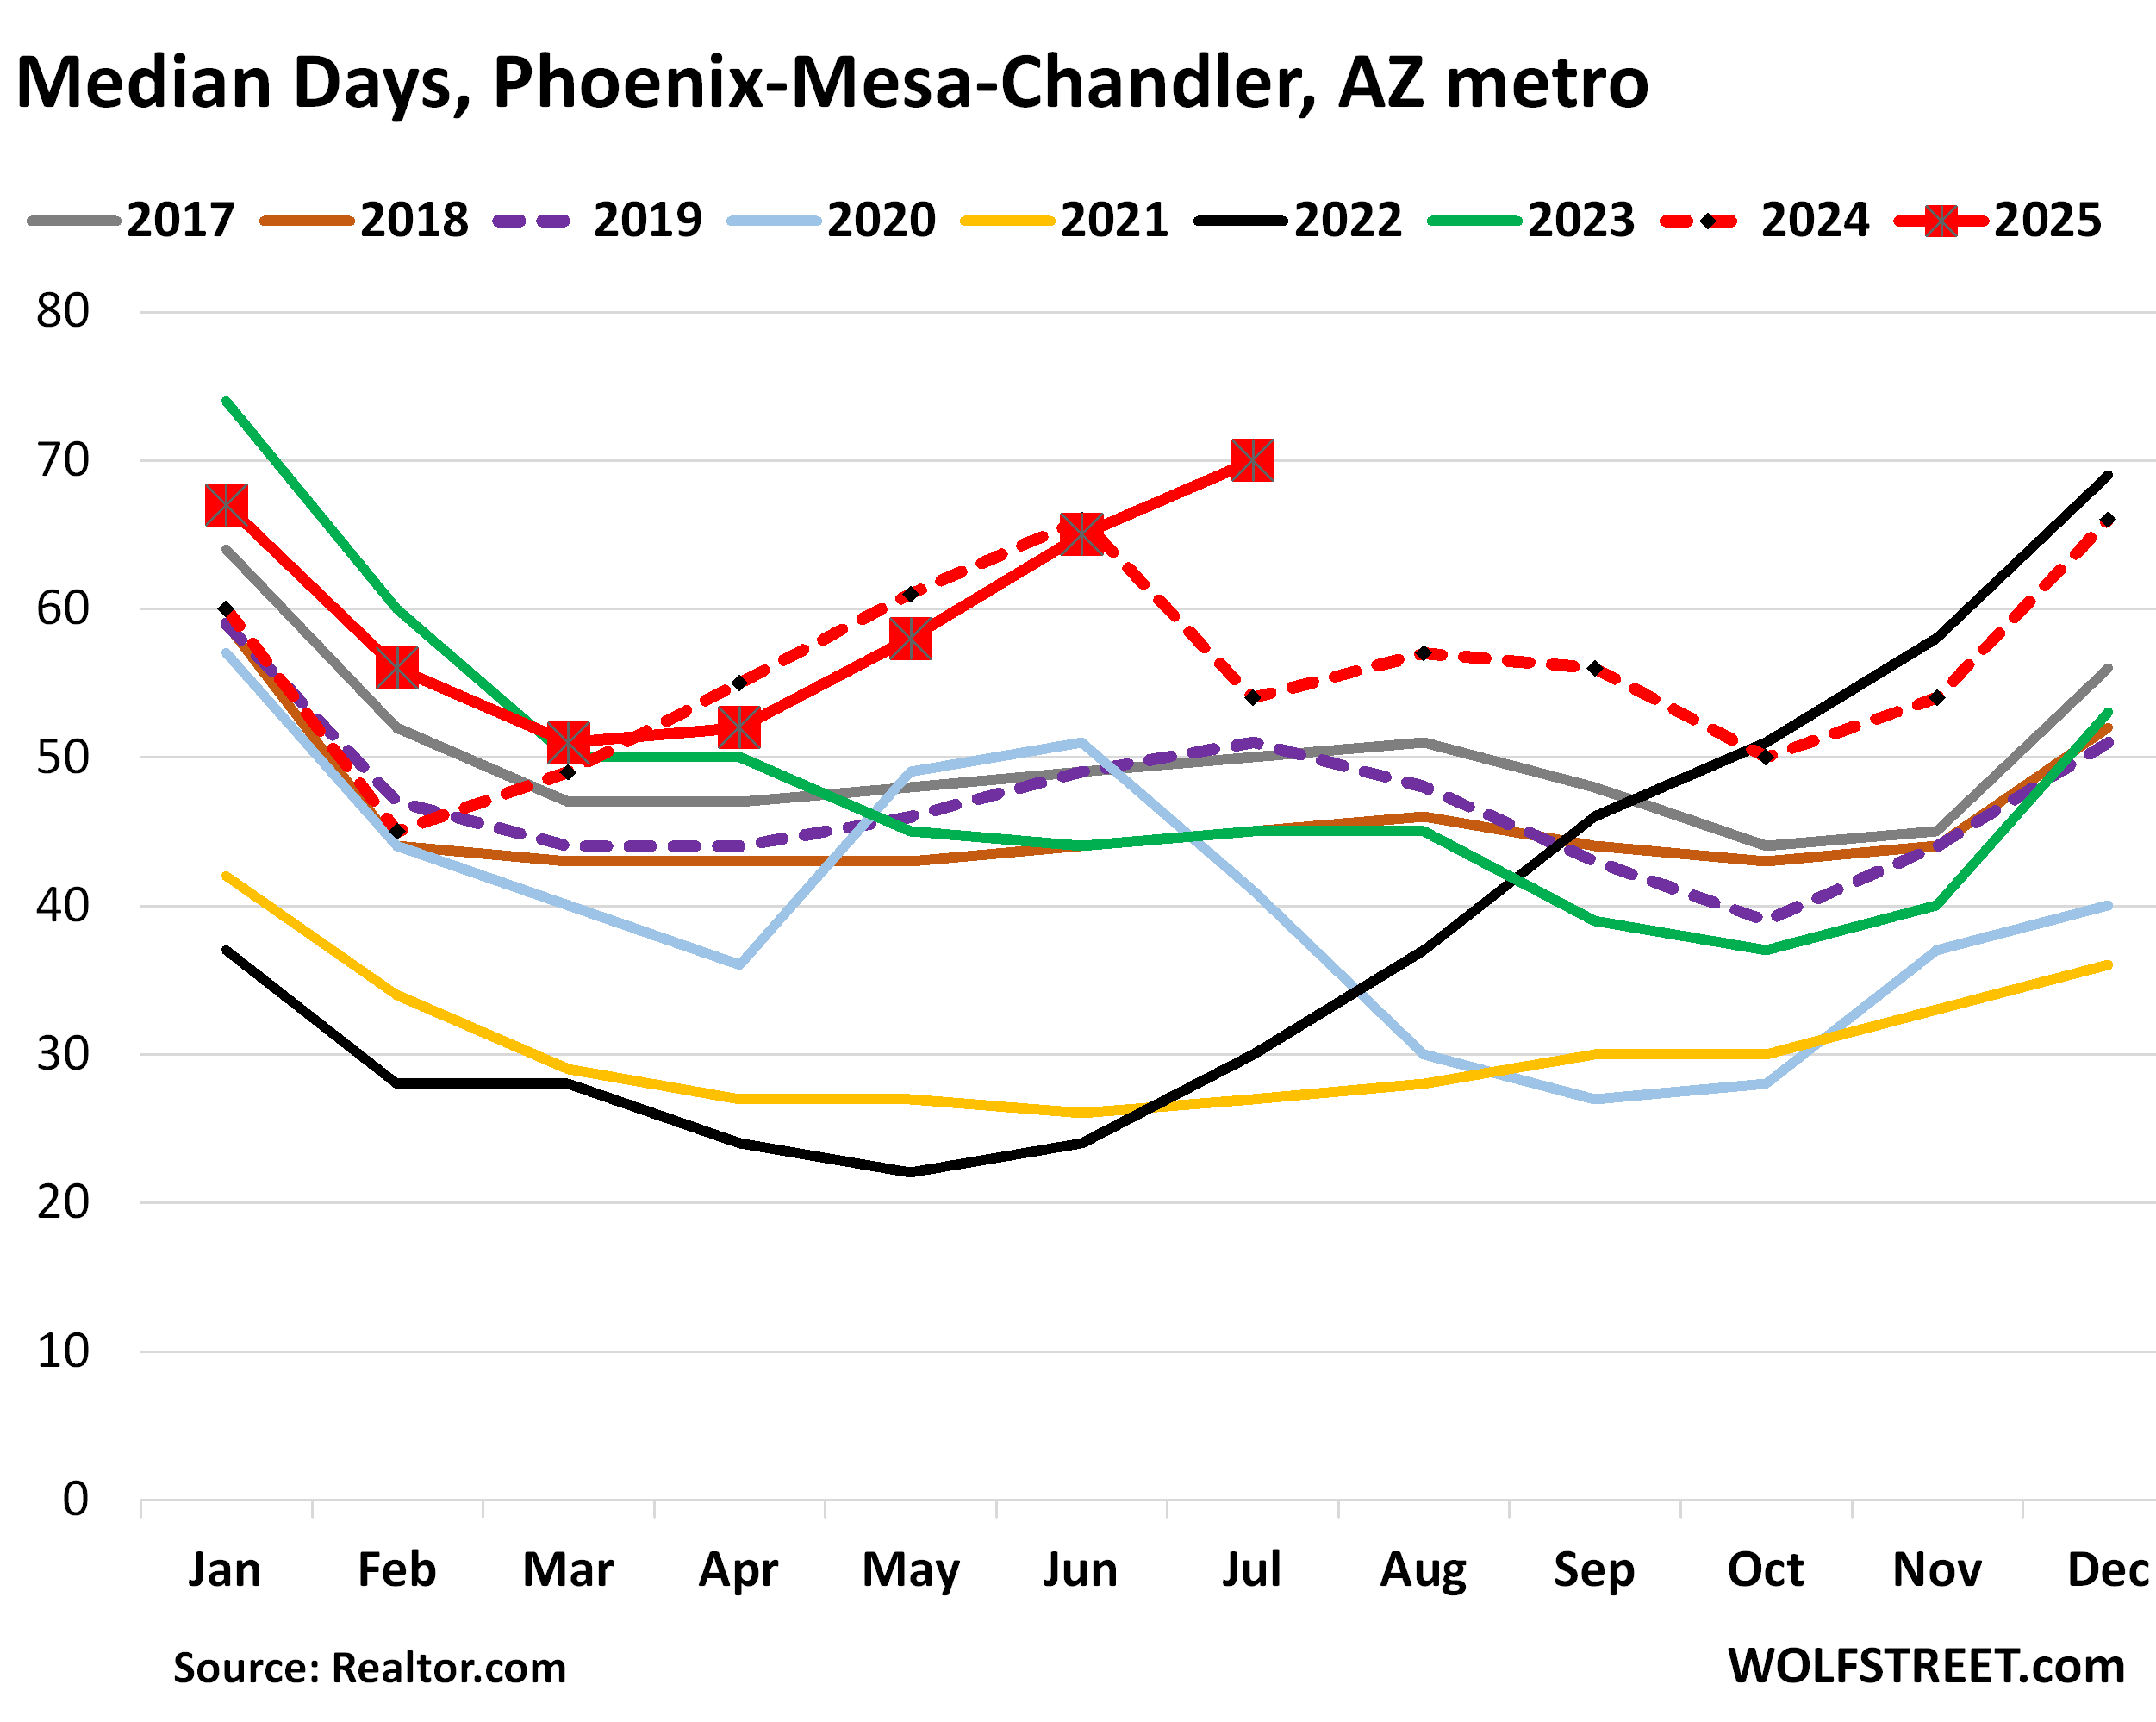
Median days on the market soared to 70 days before homes sold or were delisted, by far the highest for any July in this decade of data, and up from 54 days in July 2024, the second-highest for any July in the data, and up from 51 days in 2019.
And delistings surged in Phoenix, the market in the US with the second-most delistings per new listings (behind only Miami), with 37 delistings per 100 new listings. Delistings have surged this year in many markets across the US as frustrated sellers decide to wait for better times, according to a separate report by Realtor.com last week.
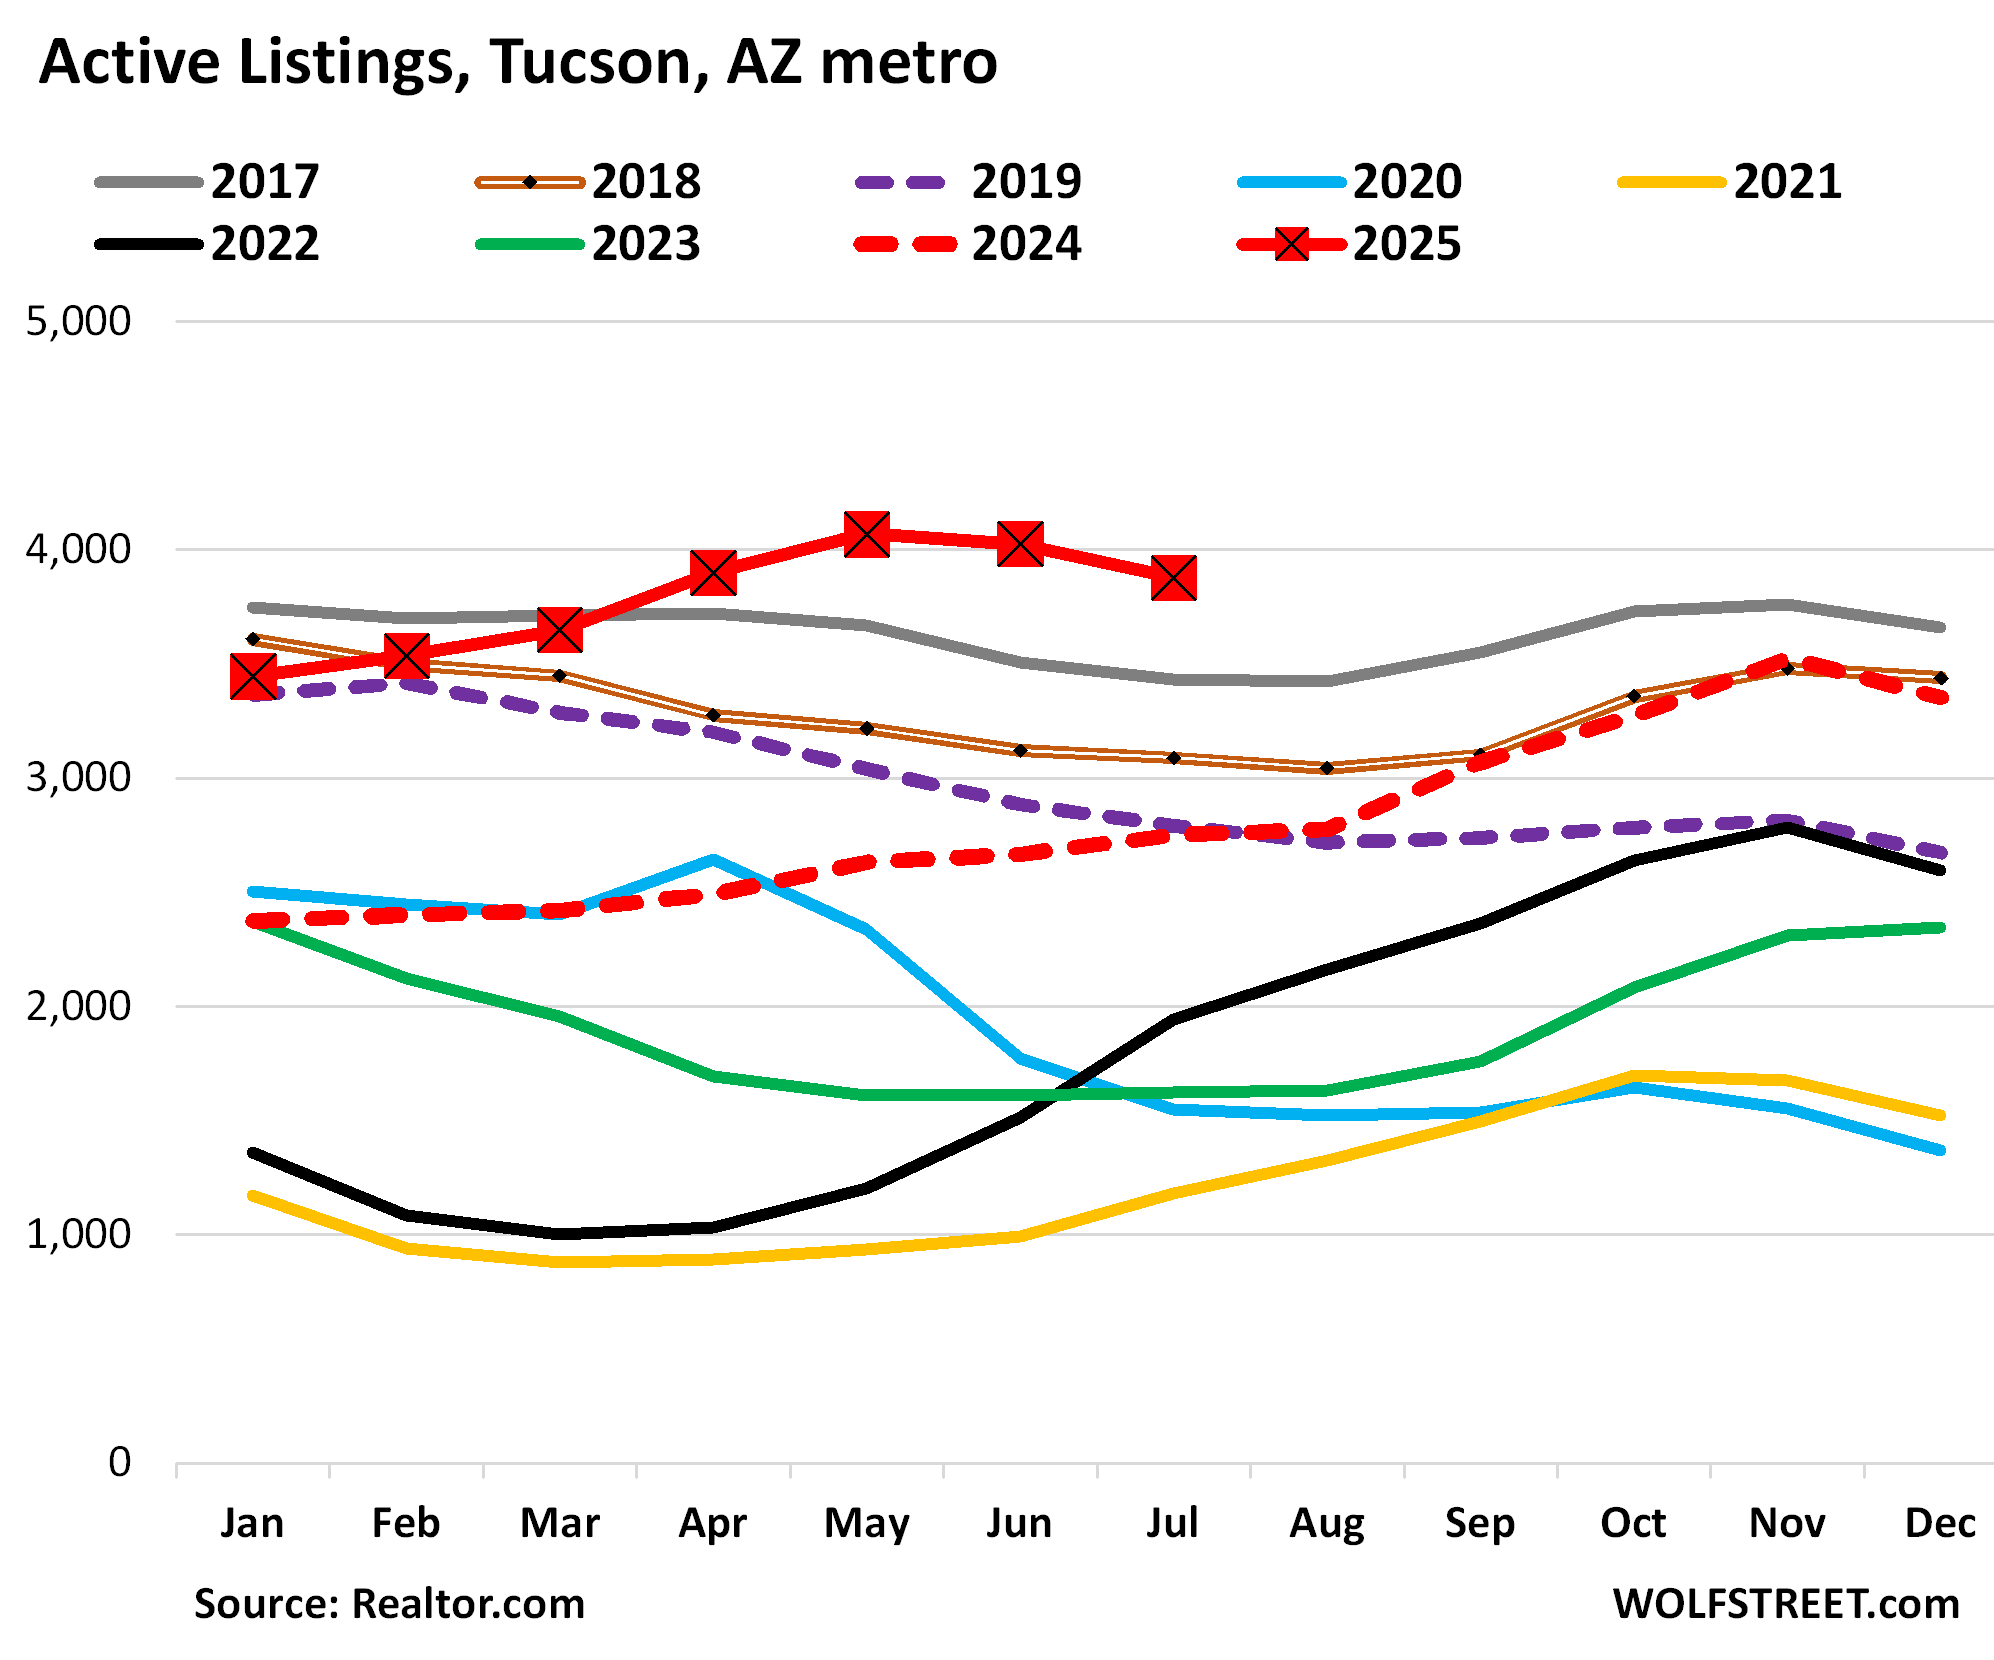
In the Tucson metro, active listings soared by 41% year-over-year, by 139% from July 2023, and by 39% from July 2019, to 3,880 homes for sale, the highest for any July in the decade of data from Realtor.com.
The median number of days that a home spent on the market before it was sold or delisted spiked to 64 days, by far the most for any July in the decade, up from 49 days a year ago, and up from 50 days in July 2019.
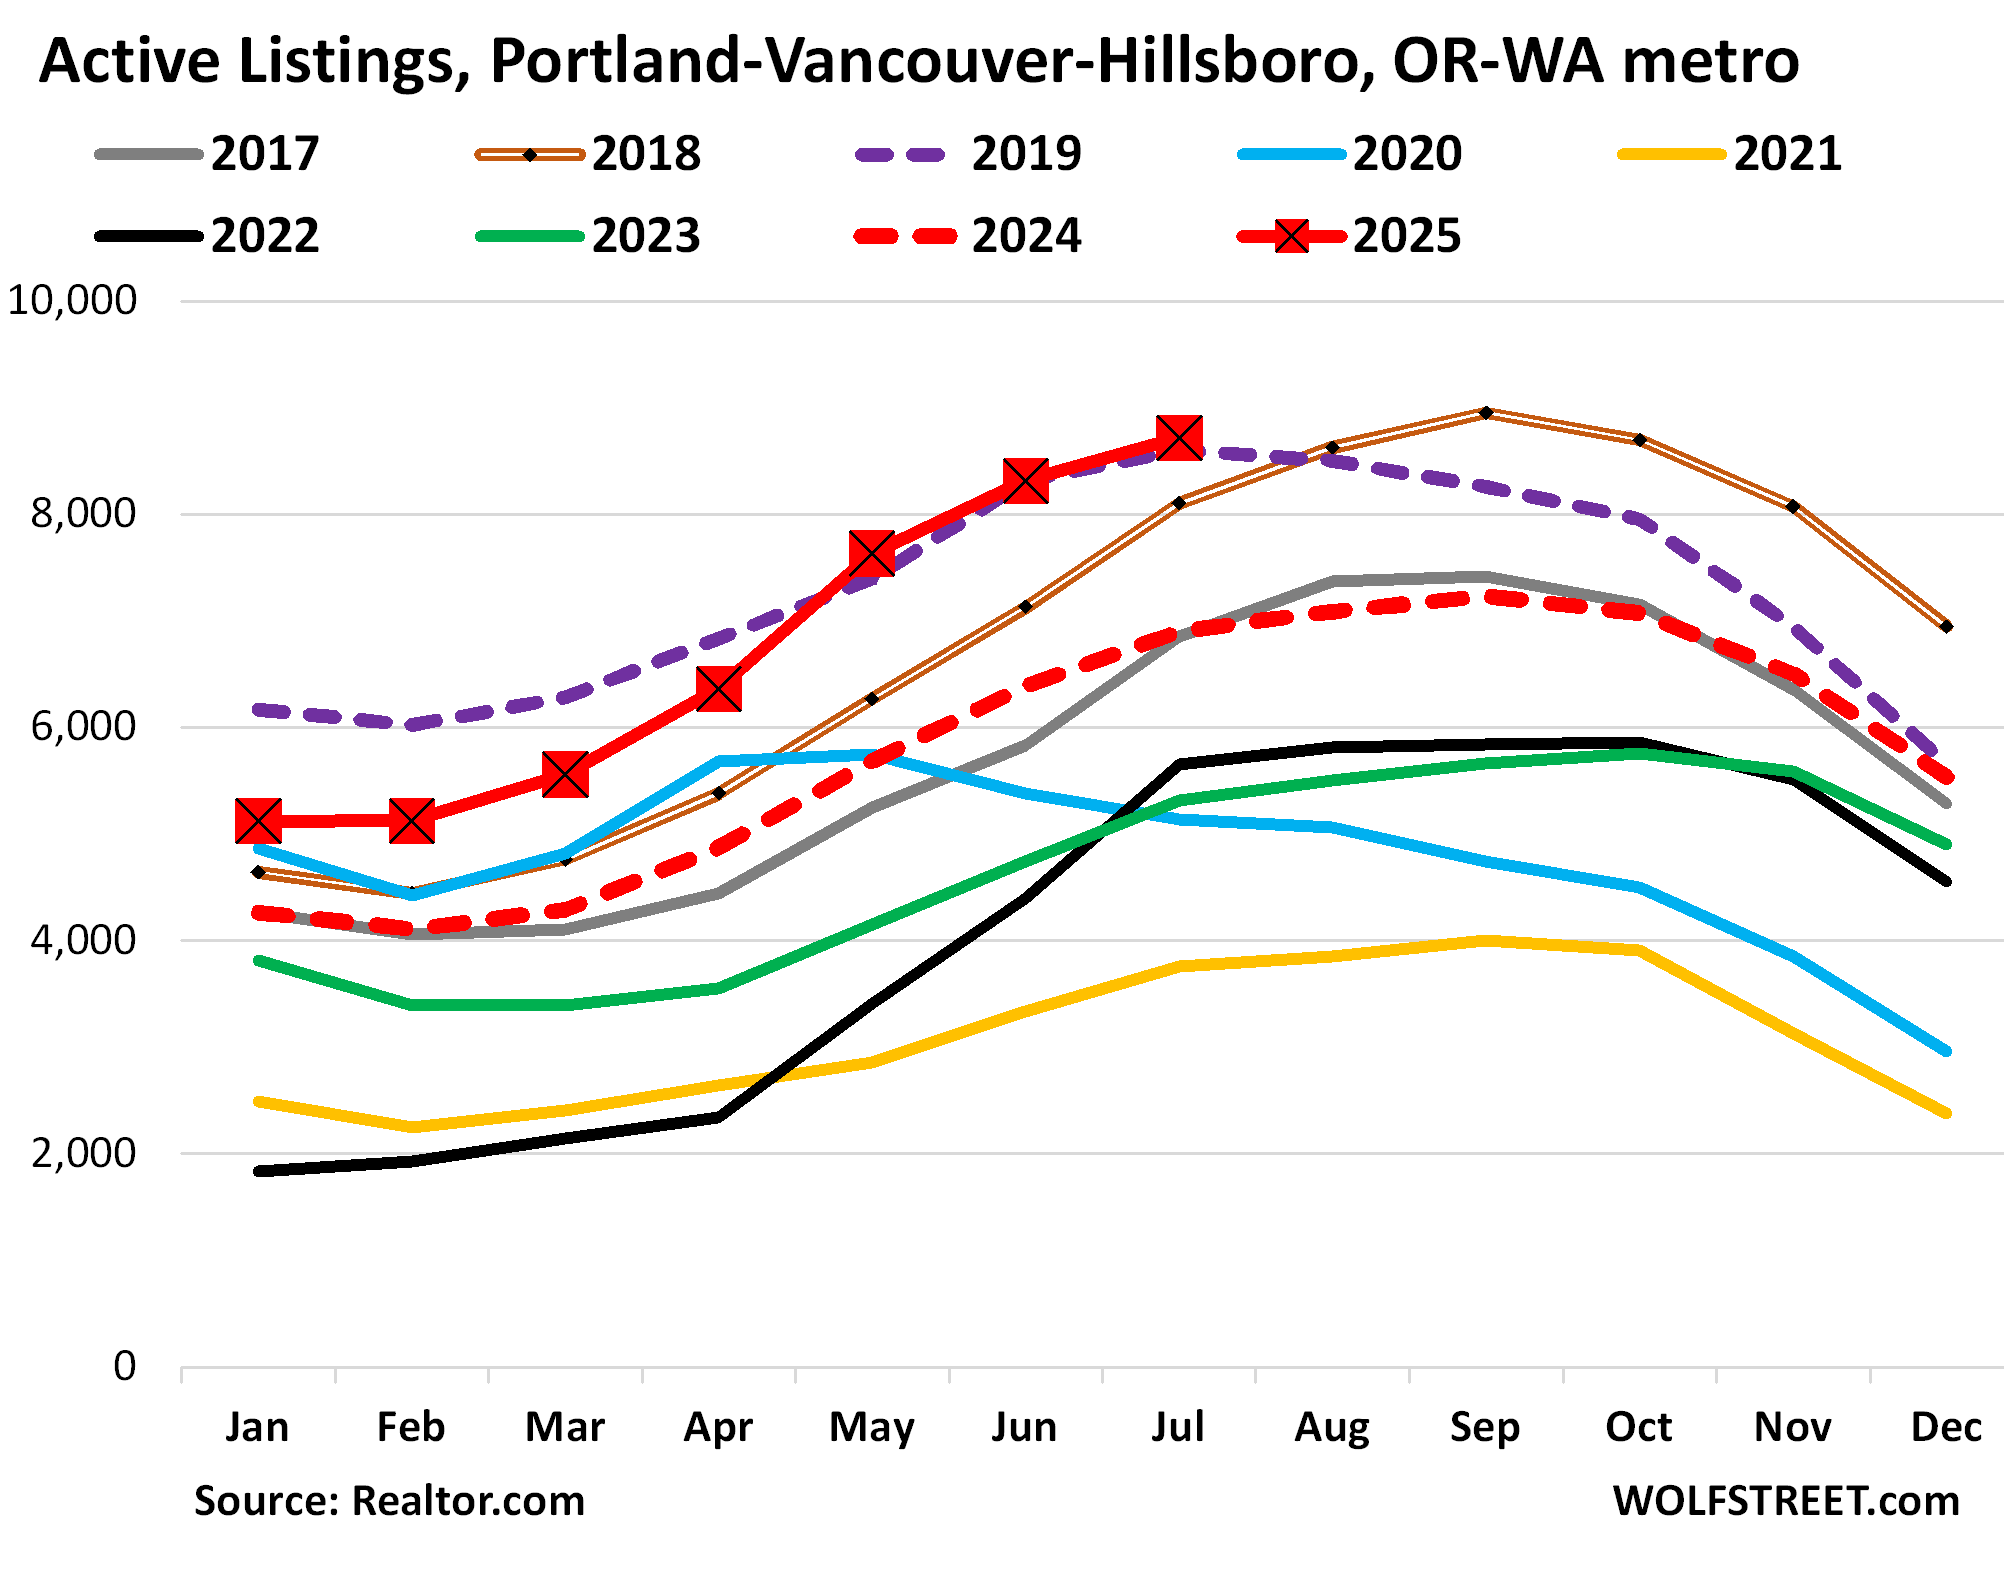
In the Portland-Vancouver-Hillsboro metro, active listings surged by 26% year-over-year, to 8,713 listings, squeaking for the third time in a row past 2019, the prior highs in data going back a decade.
Median days on the market jumped to 55 days, the highest for any July in the data, and up from 47 days in July 2024, the second highest in the data.
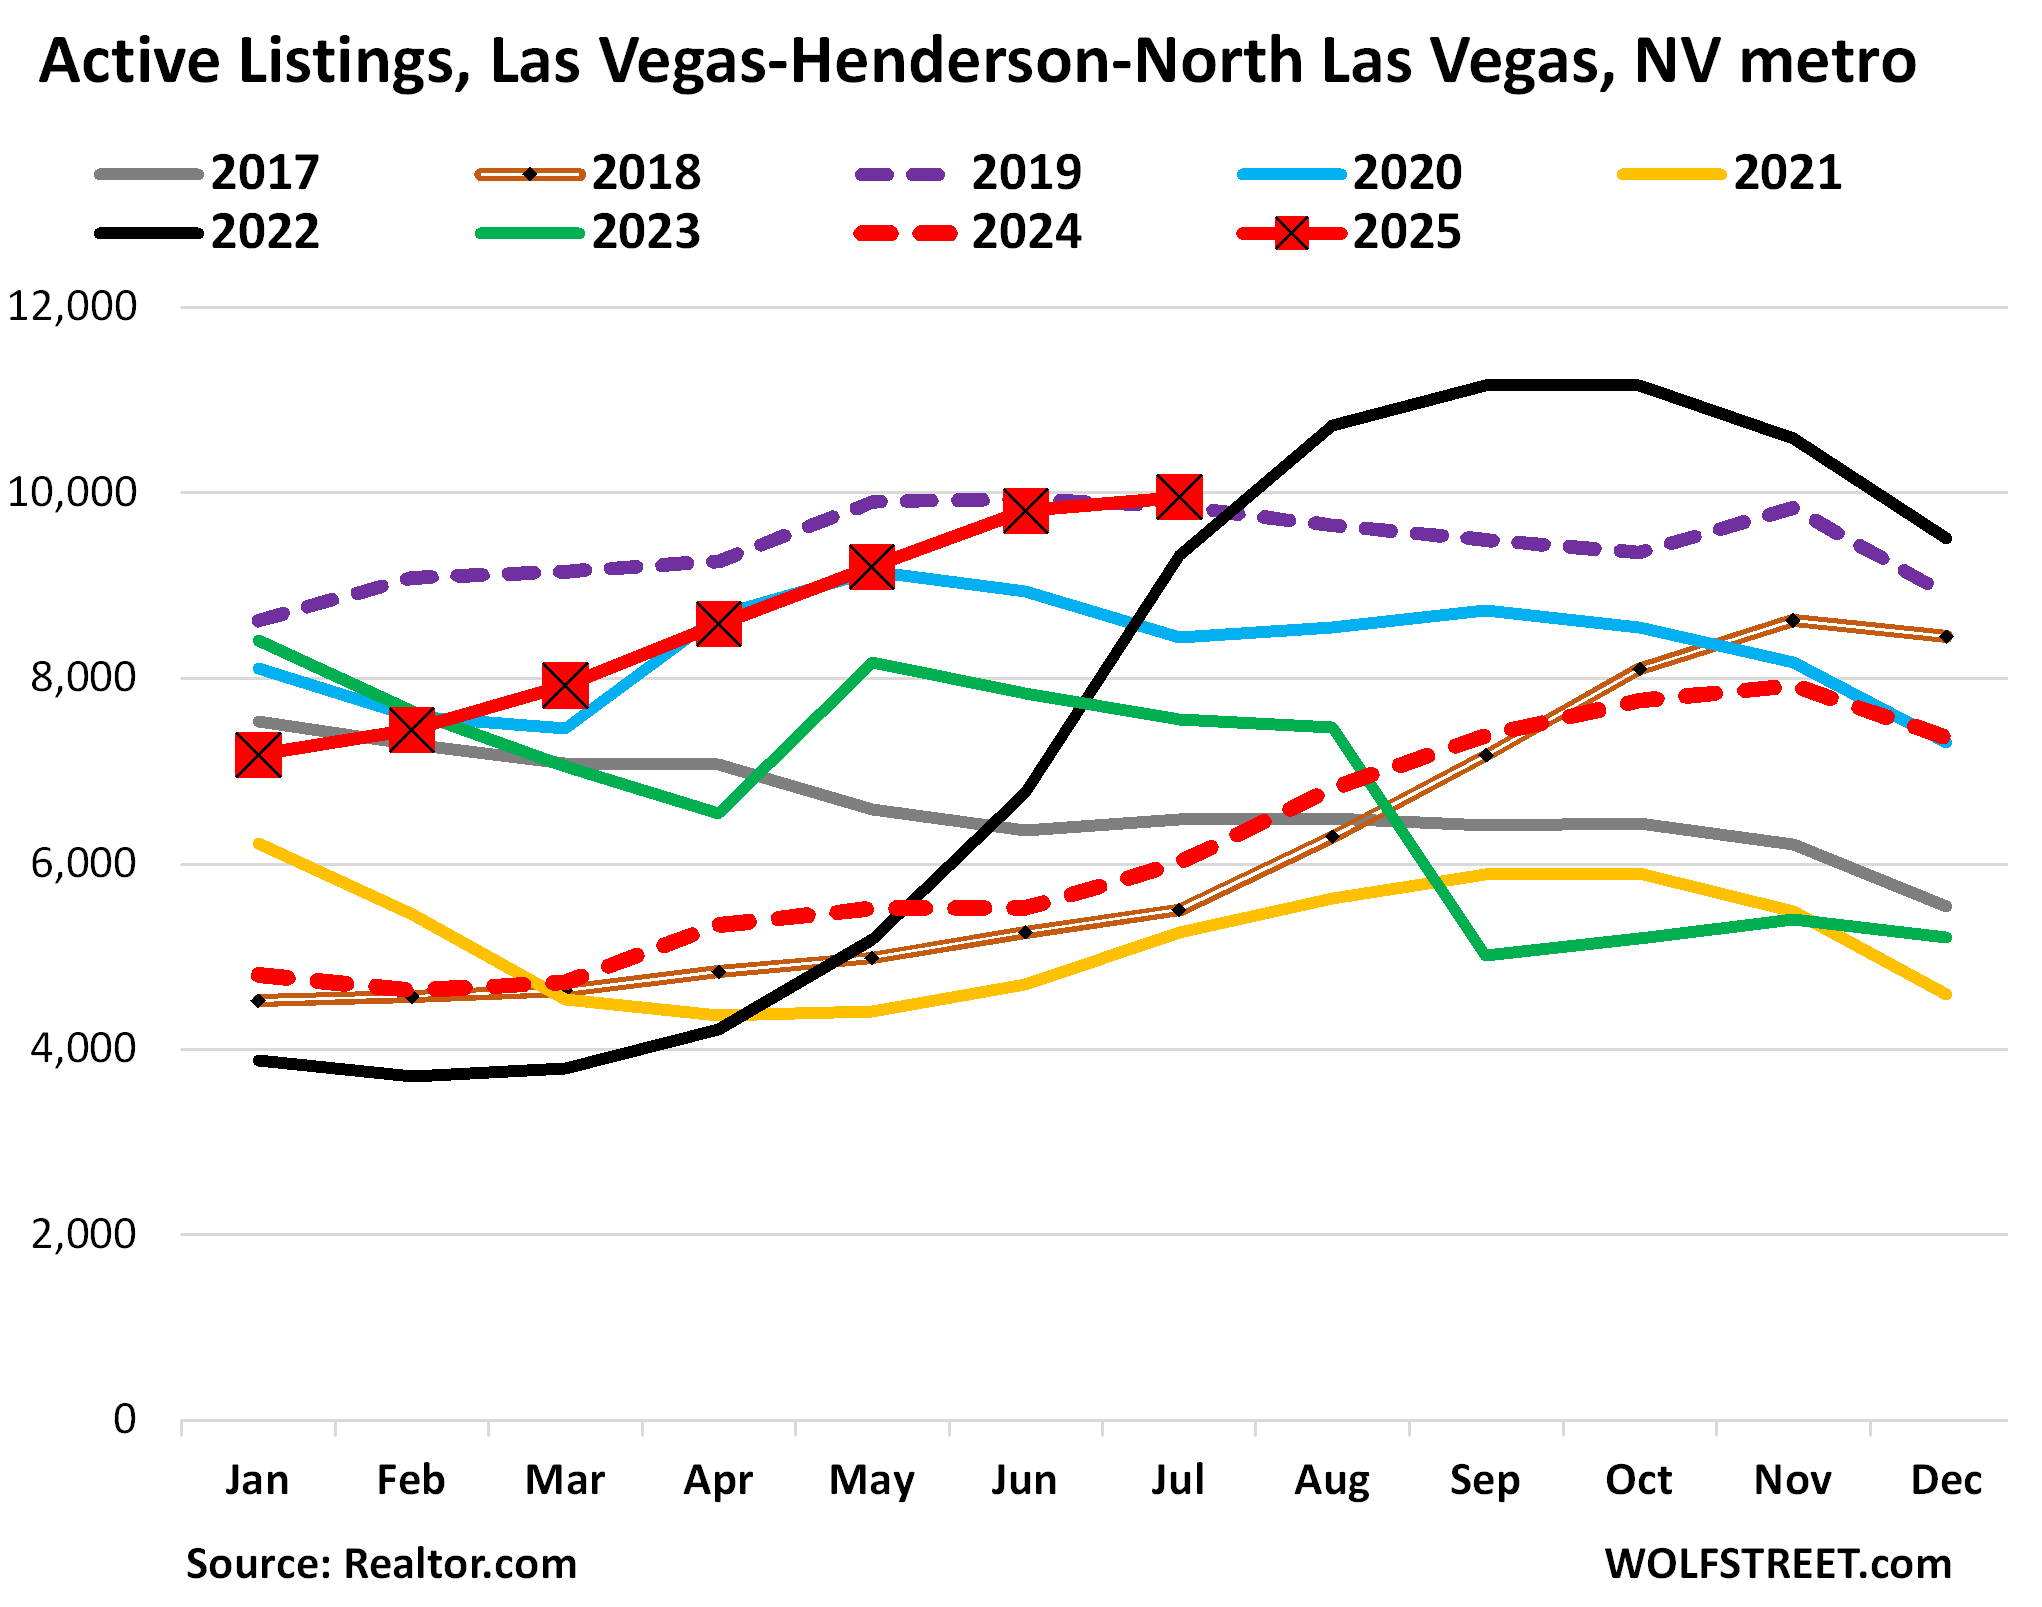
In the Las Vegas-Henderson-North Las Vegas metro, active listings spiked by 66% year-over-year, to 9,954 homes for sale, the highest July in the decade of data, having surpassed 2019 for the first time.
Median days on the market jumped to 50 days before homes were pulled off the market or sold, the second highest for any July, behind July 2020.
The inventory surge got a late start. In the spring of 2024, inventory was still ultra-low. In the 16 months since then, inventory has doubled.
In 2022, a huge surge in inventory occurred, with highs in September and October 2022, then inventory plunged, and it continued to plunge in 2023, and by early 2024, it hit ultra-low levels again. These movements in 2022 were not seasonal, but just crazy, and are better depicted in a line chart, not a stacked chart:
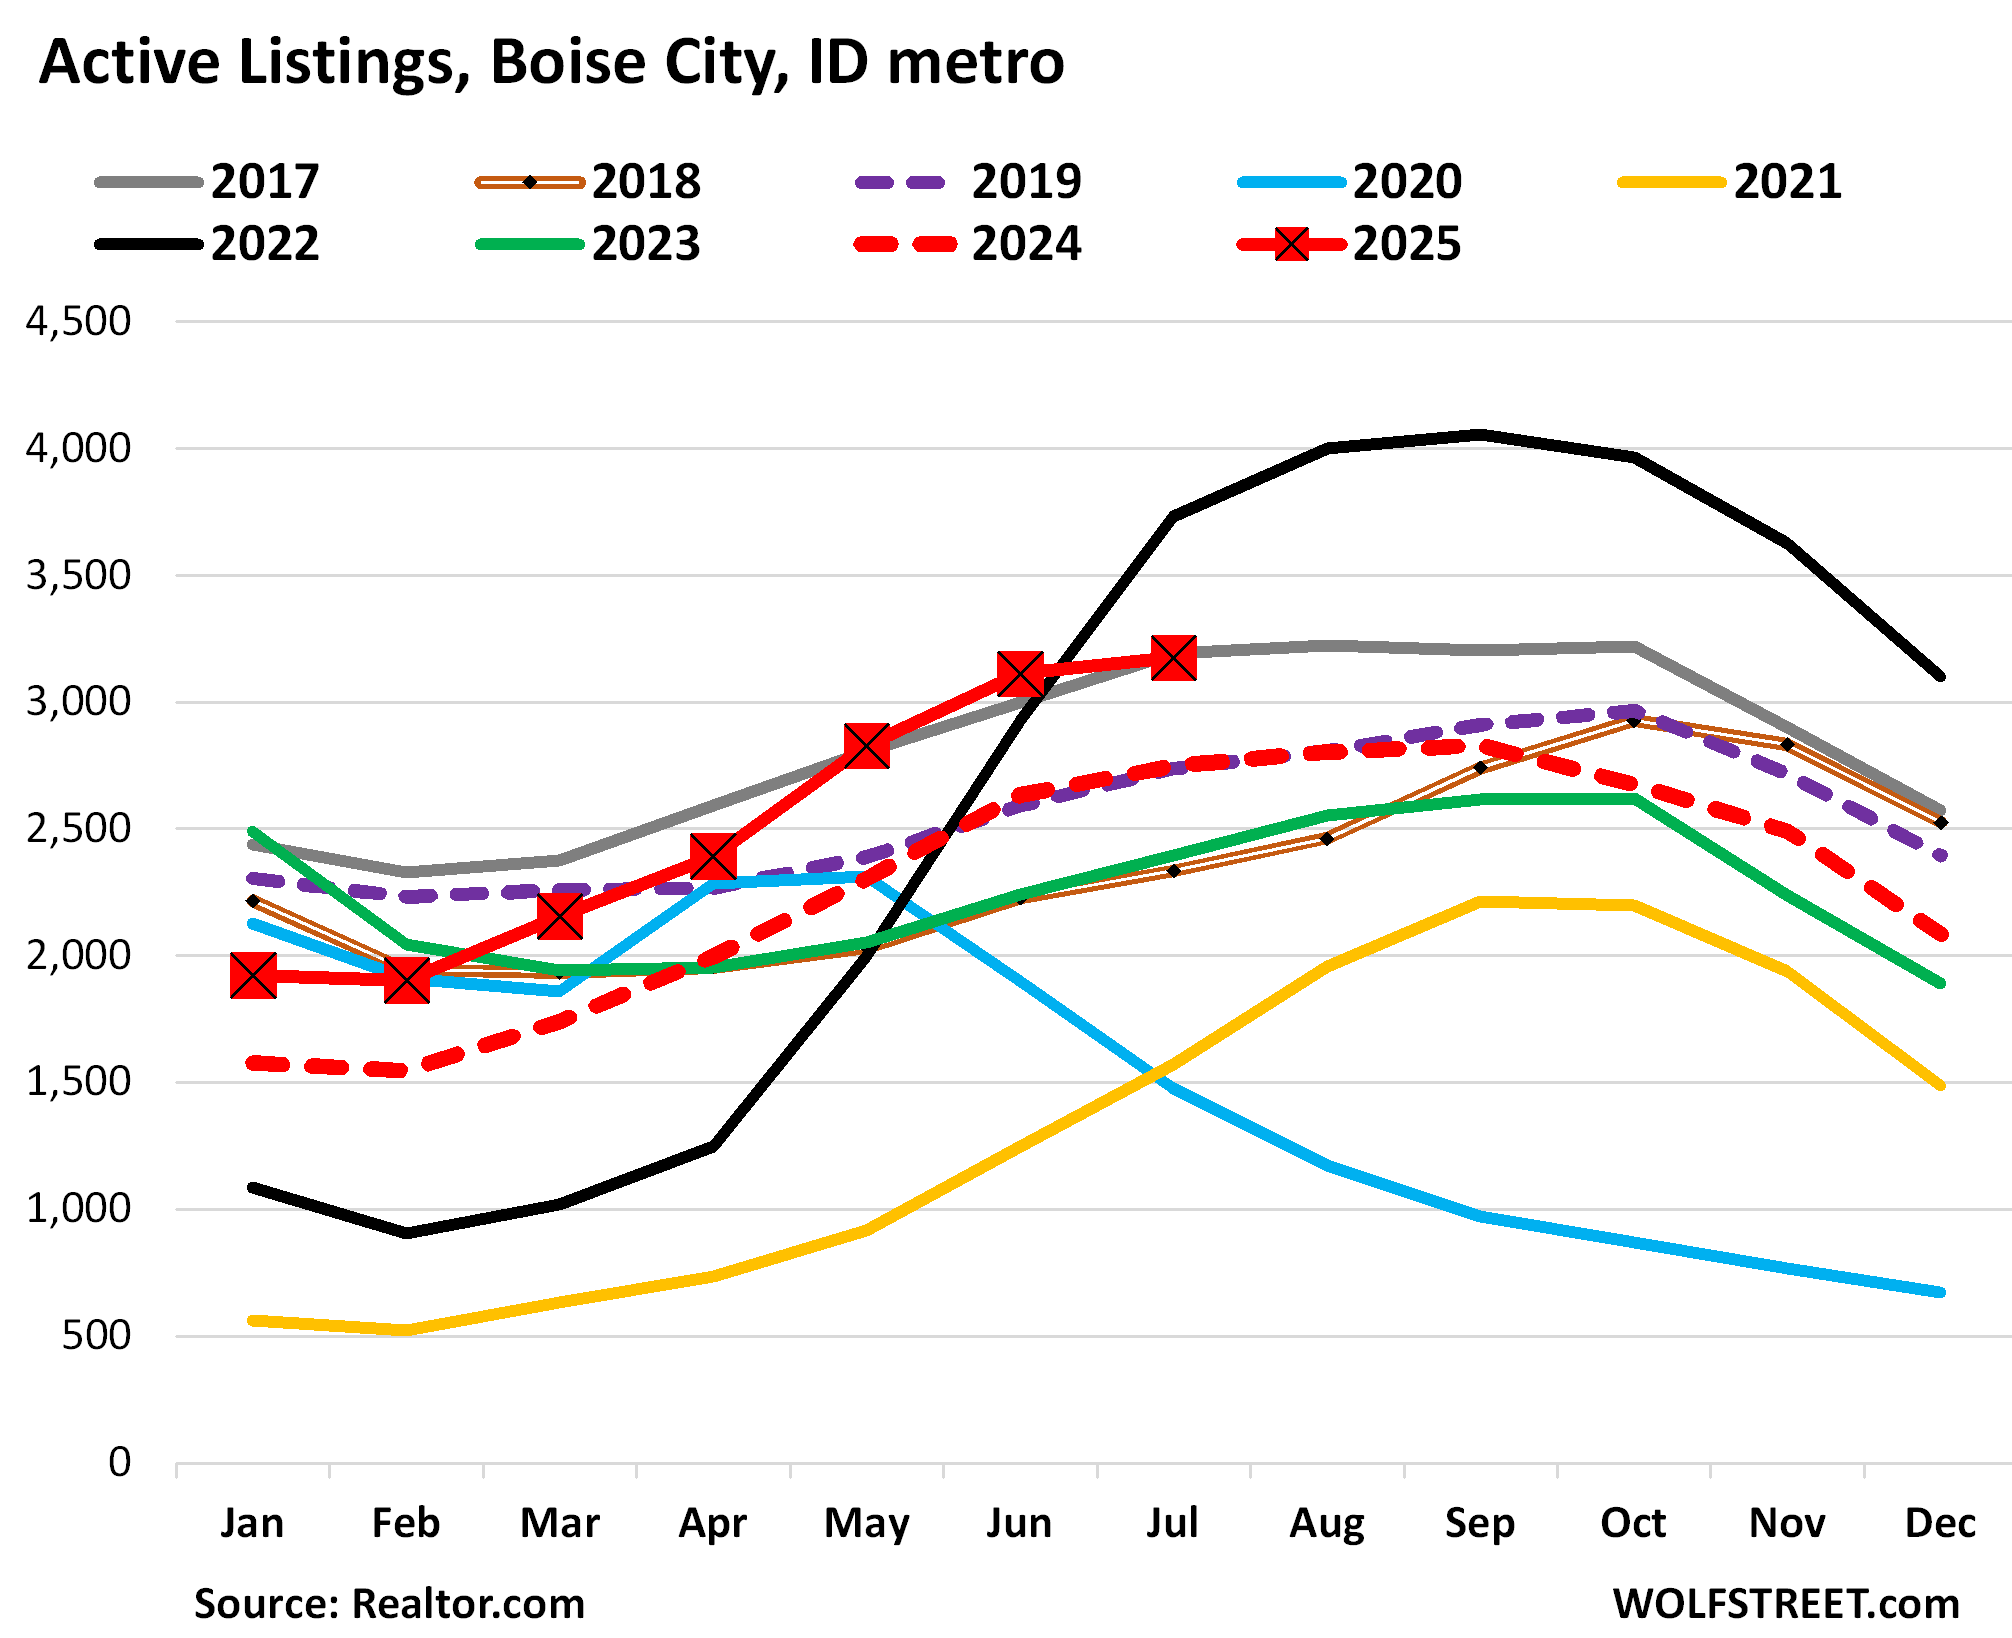
In the Boise City metro, inventories rose by 16% year-over-year, and by 16% from 2019, to 3,174 listings, right where it had been in July 2017 (gray line) and below the July 2022 surge (black line).
Median days on the market rose to 46 days, the second-highest for any July in the decade of the data by Realtor.com.
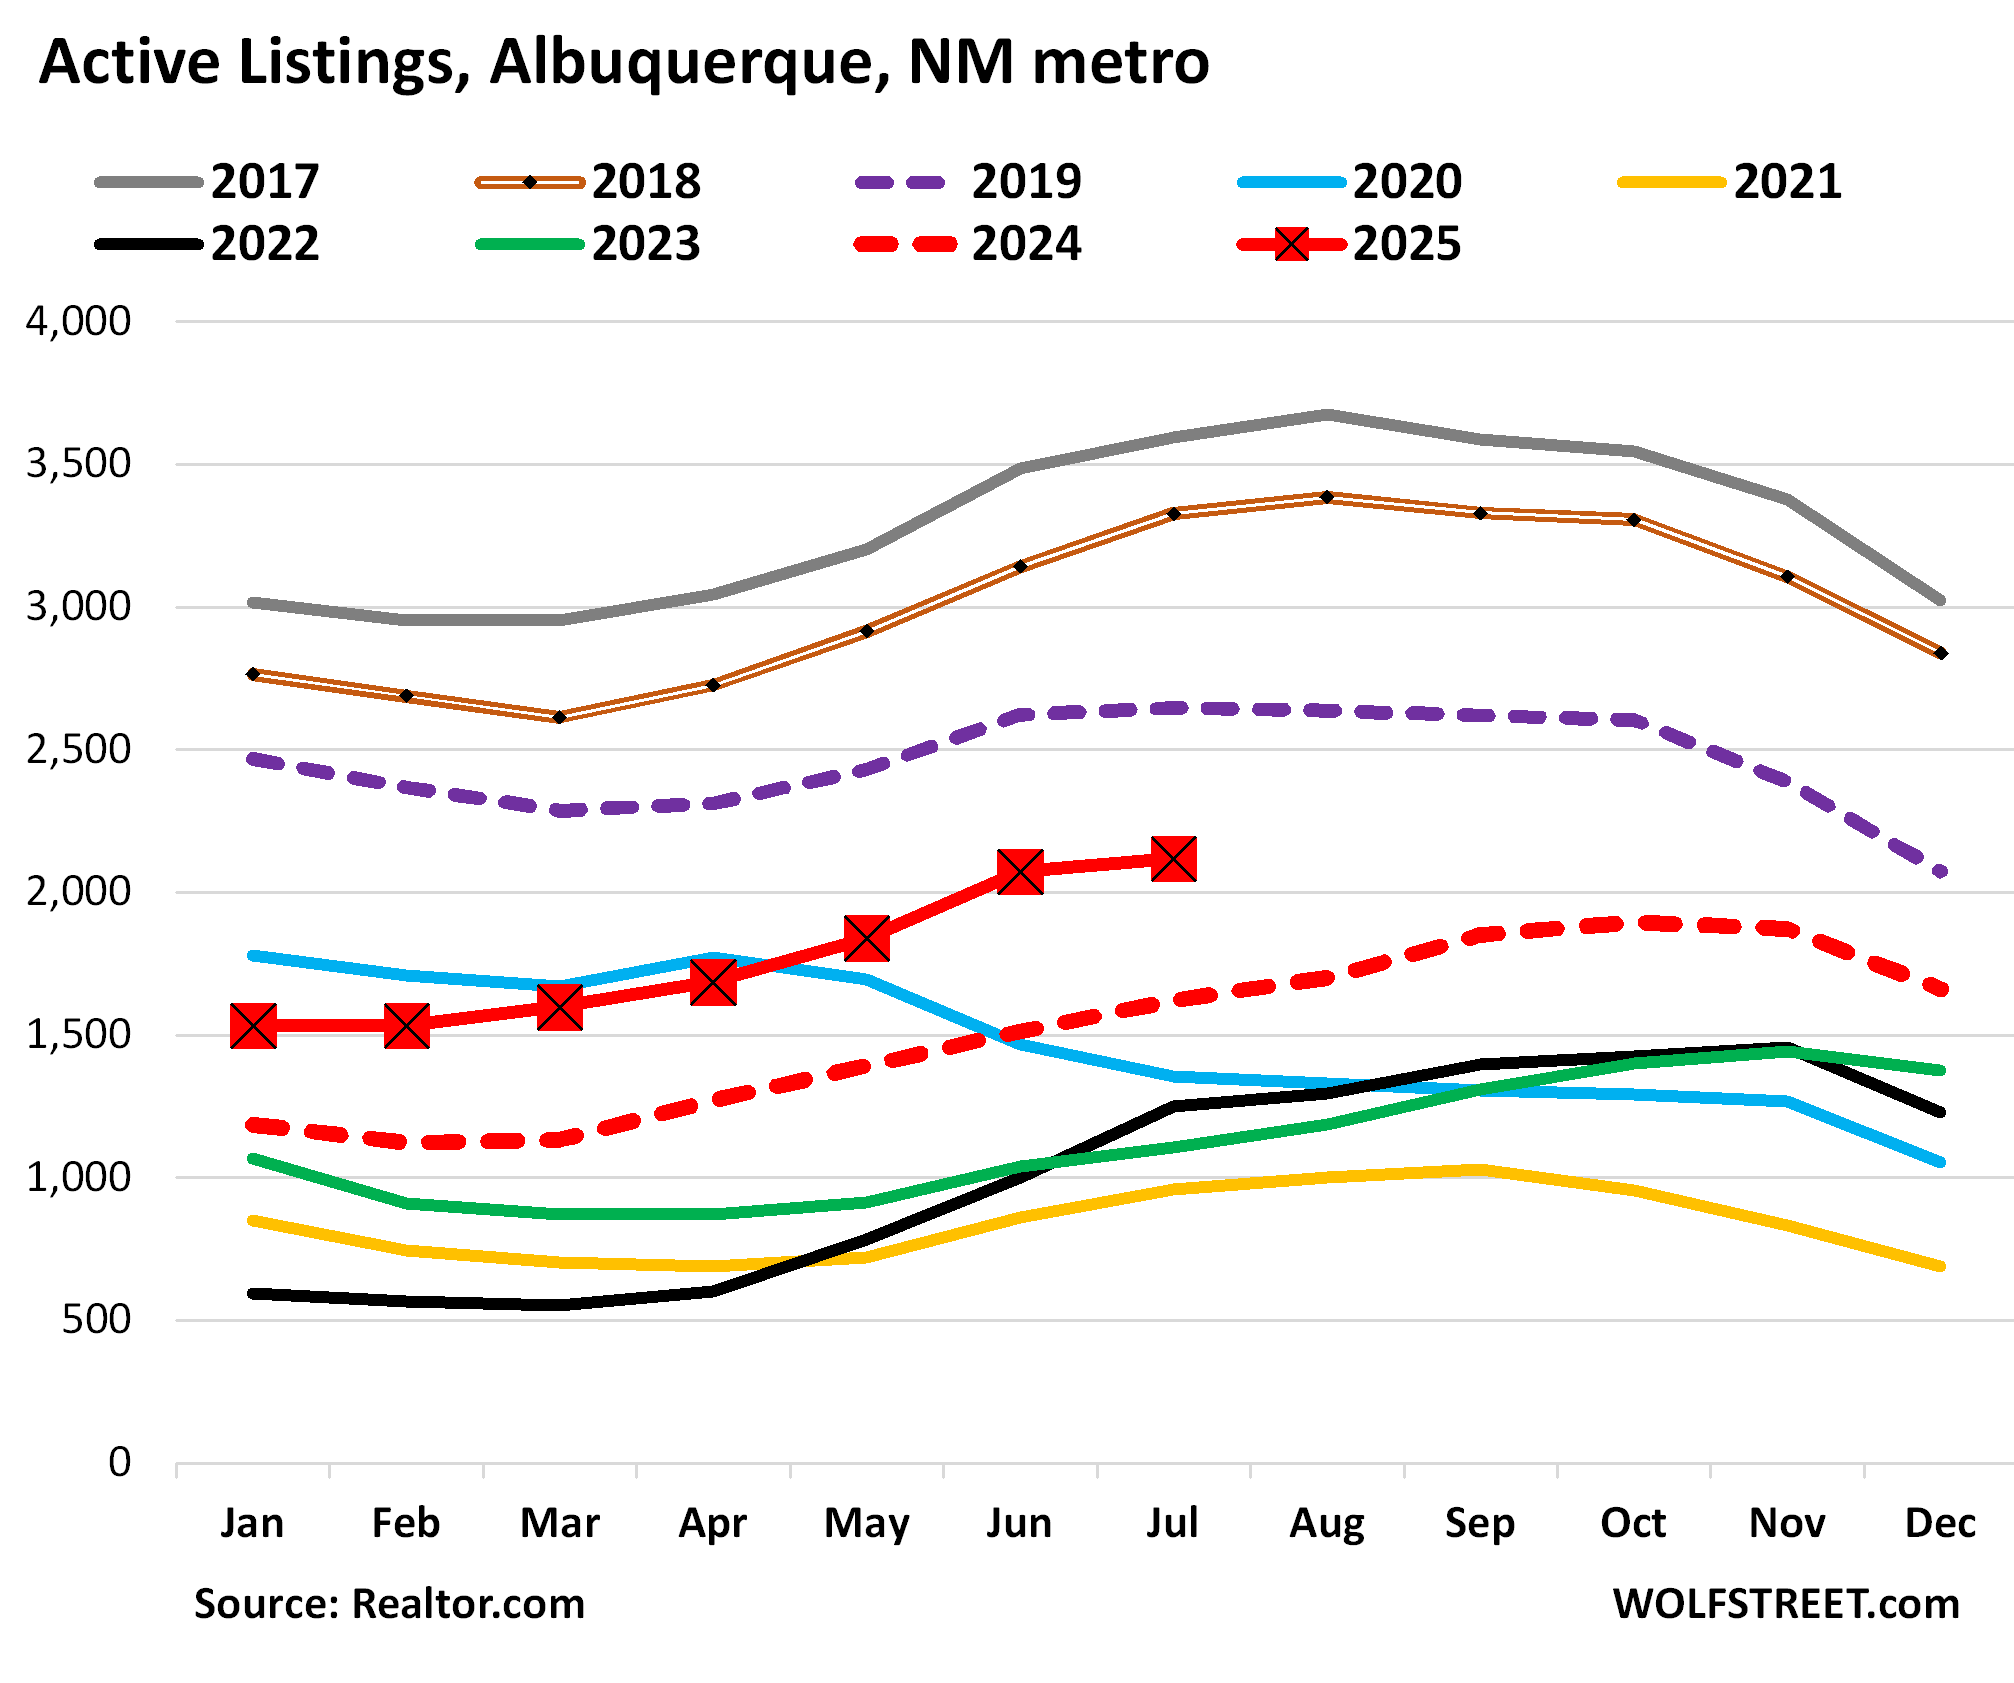
In the Albuquerque metro, active listings rose by 31% from a year ago, to 2,118 homes for sale, but were still substantially below the prepandemic years 2017-2019.
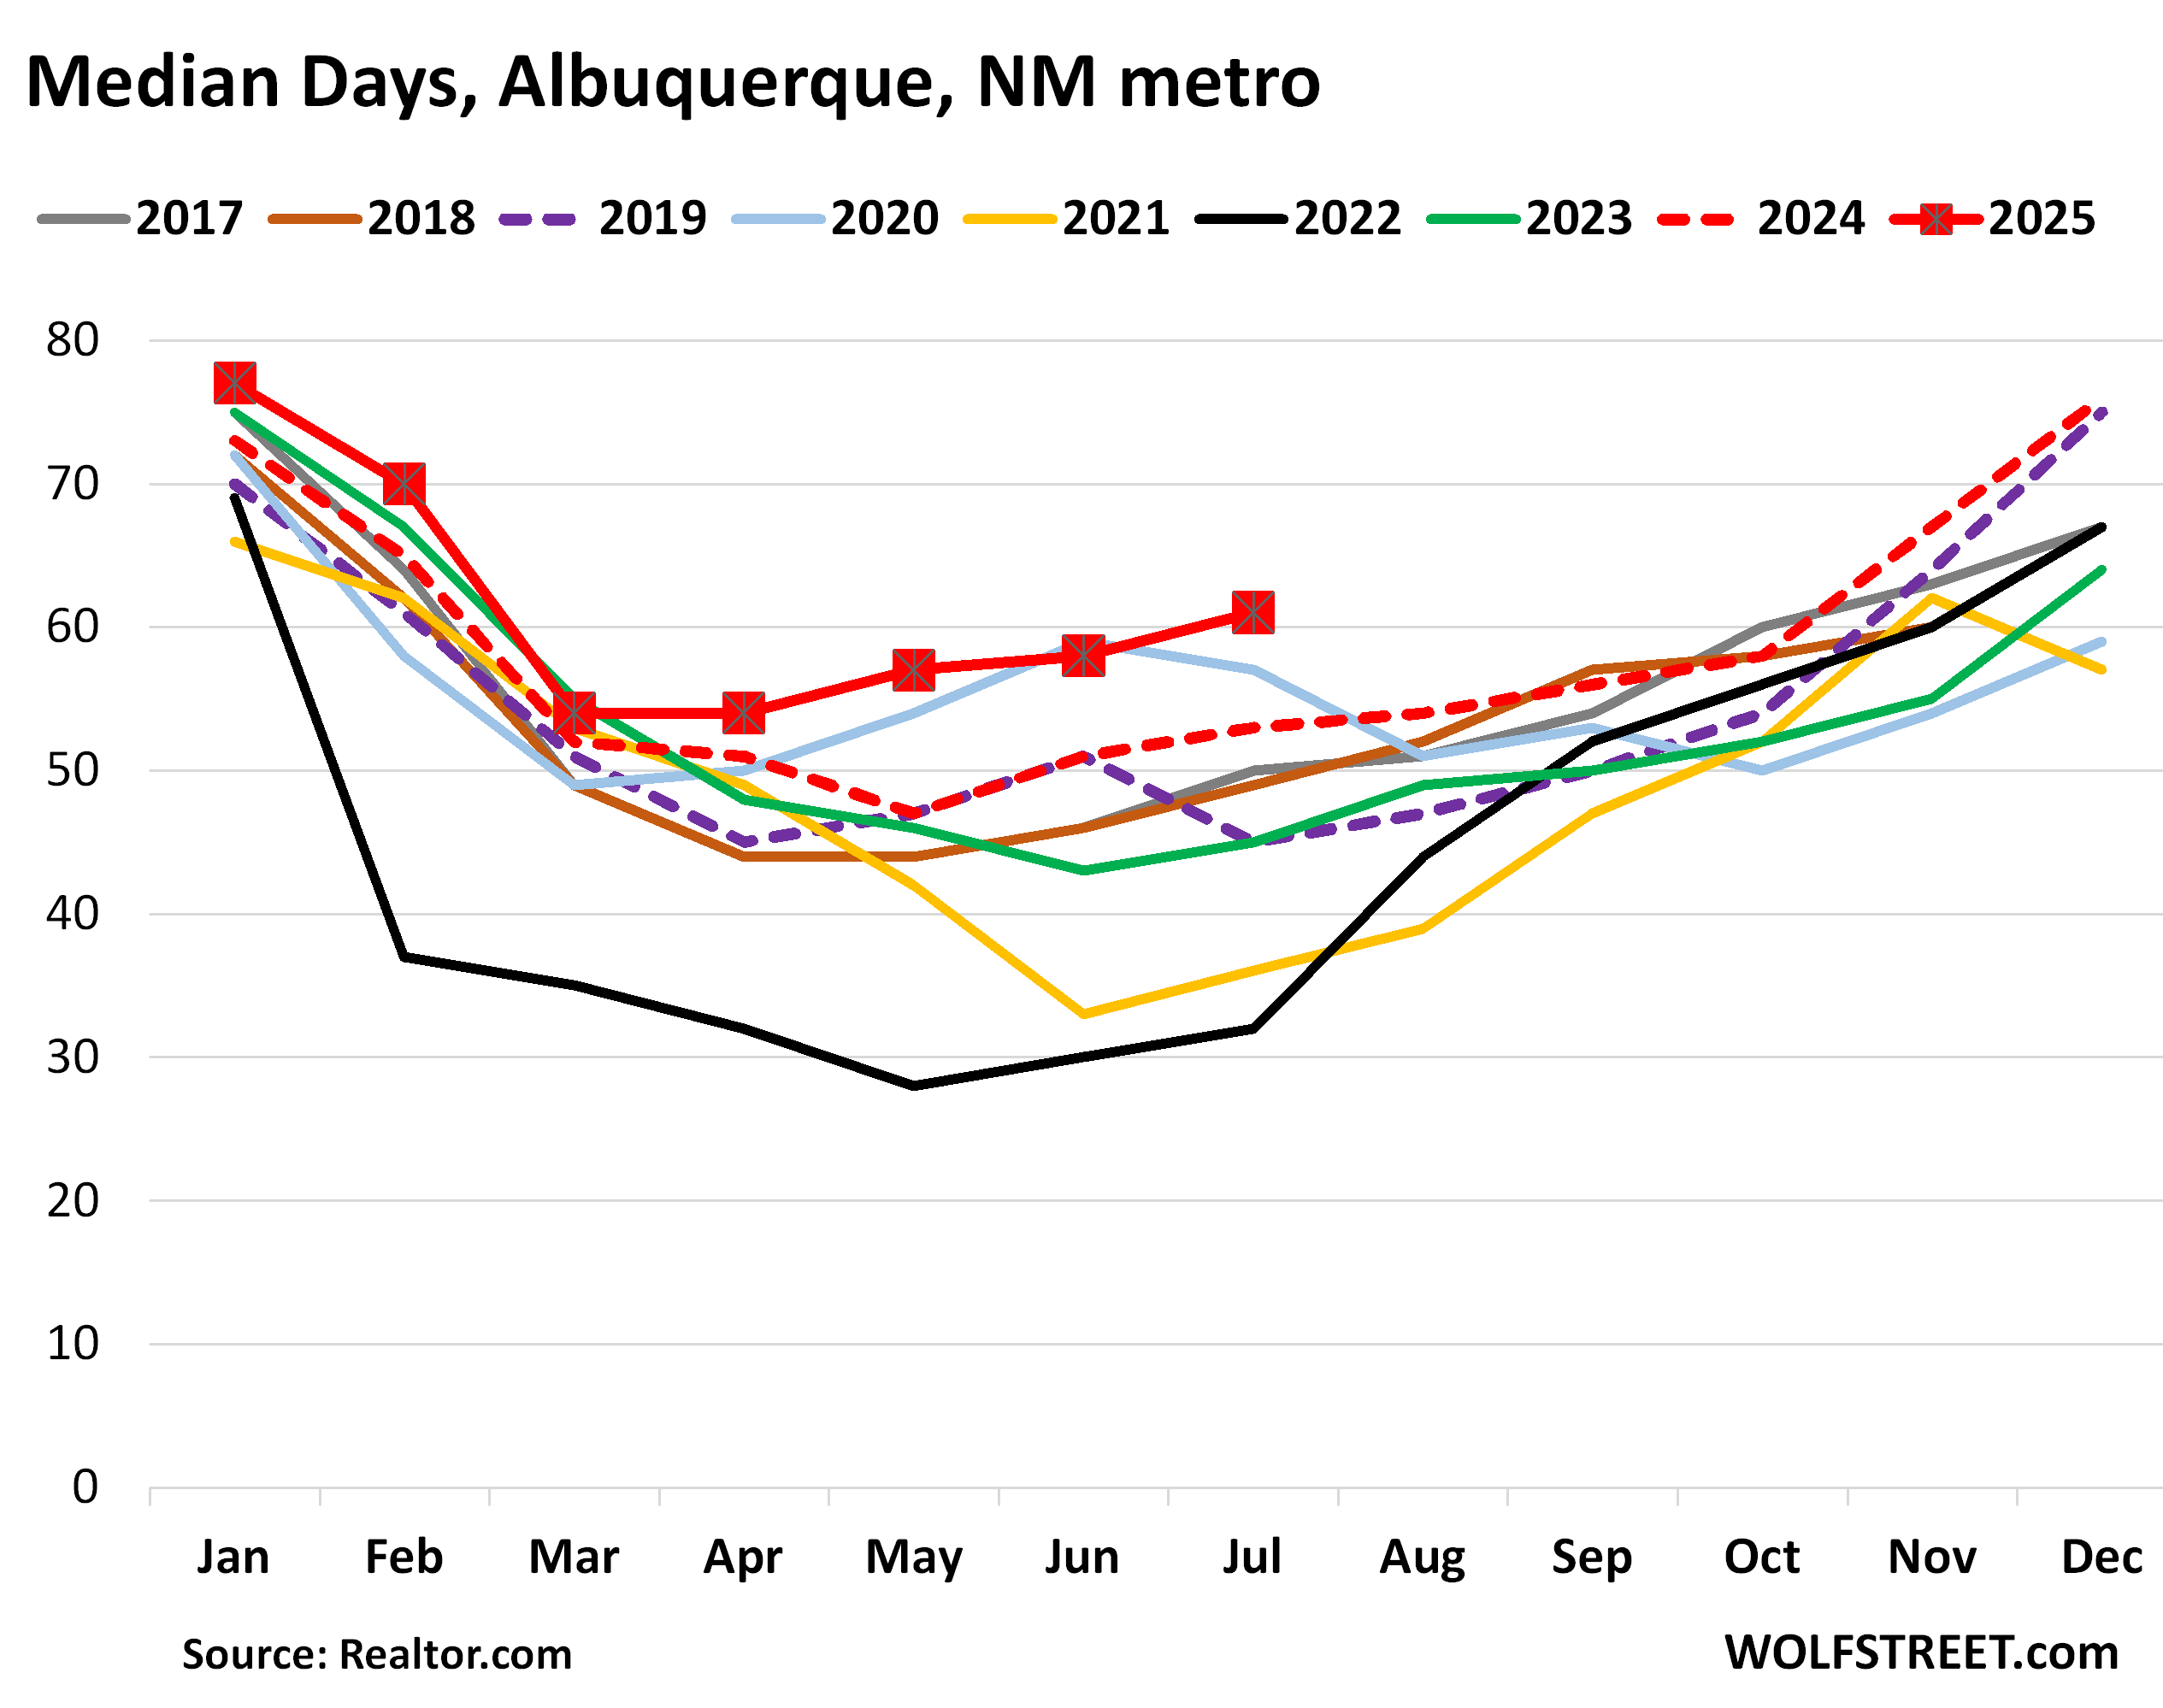
Median days on the market rose to 61 days, the highest for any July in the data, up from 53 days in 2024 and from 51 days in 2019. So not all that much inventory for sale, but so little demand that homes sat for a long time before they sold or got pulled off the market.
Enjoy reading WOLF STREET and want to support it? You can donate. I appreciate it immensely. Click on the mug to find out how:

![]()
a) Sold or b) Pulled off the market
That data point is big enough to hide a bear inside.
If we could find a ratio of this somewhere, and how it has changed throughout the decade, it would add a lot of flavor to the story.
I know that prices are “sticky downwards” but it sure feels like a dam waiting to burst.
We need to know the carrying cost for properties. A house with 2.5% mortgage is not hard to carry, so little downward price pressure.
We’ve never had a housing market where about half of mortgaged properties have rates under 4%, like we have now according to FHFA. About 20% of mortgages are under 3%!
You can hold that house and pay the mortgage with interest from an average checking account, if you have the capital.
My niece is at 2.6 percent in North Carolina and those mortgage free aren’t looking to sell, about 30 percent of all inventory.
So?
They sold their high priced obligations because they paid a premium inside their mortgage to have the option to swap for a lower interest rate.
It’s in all of our mortgages. It’s an options contract.
People act like it’s causing issues, but anyone with a mortgage had the option.
I don’t cry cuz Warren Buffett did a deal with coke, made millions and I was not a party to the deal. I in no way benefited.
Boo Hoo, let me blame my ills on the coke deal.
I also wonder how many people will shift to just renting their houses out. I guess it could change your mortgage rate if you actually tell the bank, but I could rent mine out for about 300-500 higher than my mortgage.
Eric,what about insurance,feel would probably rise higher if a rental/especially long term.
I feel also unless just renting a room or two you now need monies for another place.
That said,I am still on strike.
James 1911 (man you are old, wink)
Yeah I would imagine insurance and homeowner’s would be an issue, but it is just a hypothetical. Even if you don’t get 100% to cover costs it still might be worthwhile.
Just a theory.
The initial rentals could decrease the value of the home by 10-30%. All those little nicks, scratches, and carpet blemishes add up. Individually, they are just small enough to fall under “normal wear”, so landlord gets no compensation, but the accumulation of these blemishes decreases the value of the home tremendously.
That’s why people should only rent out homes that are already in need of cosmetic repair.
Some renters take care of RE property like they would a rental car.
Renting also increases supply of housing as compared to leaving housing vacant.
Anyone who rents a house isn’t buying one.
When the flood of vacant housing goes onto the rental market, it will prove to not be a solution. Sellers/owners will have to take a hit.
In Denver at least a massive supply of new apartments has come online over the last 2 years. Rent fell 5.8% yoy in April. A lot of single family home rentals are sitting empty at least from what I here. A friend just let her landlord know she was moving out, he’s panicking, asking them to stay, now holding an open house. They live in a desirable area and 3 other houses on the same block just went up for rent. In 2021 there would have been no open house, no for rent signs – they would have had 20 applicants within a few hours of posting pictures on Facebook marketplace.
Sure people can always rent if they lower the price enough – just like being stuck to 2021 housing prices, people are often quoting 2021 rent prices.
Property tax goes up every year, Insurance goes up every year (a lot lately). Maintenance ain’t free Mortgage rate is immaterial when the rest of your monthly housing allowance is jumping 10 to 30% a year
40% have no note at all.
we sold 2 homes in Tucson last summer
my wife had her mother’s over priced and I got her to cut price 2 times – 10% each time – it was before others did it so we got buyer in 2 weeks
I got full price because I did owner carry – they put 30% down
more than happy to take it back(they pay on time every month)
Prices falling would create significant downward pressure. If those dominoes start toppling, they’ll be hard to stop.
2.7% here and my costs (prop tax, ins, water, sewer, etc.) have gone up significantly despite the mortgage being the same.
In fact the principal/interest component is less than 50% of my total monthly carrying costs. If inflation keeps up my monthly property taxes will be more than my mortgage in the not-so-distant future…
Inflation has nothing do with property taxes. Your property must be appraising higher. Would you rather the value go lower?
“If inflation keeps up my monthly property taxes will be more than my mortgage in the not-so-distant future…”
Just more evidence that housing and the entire economy has been broken since 2008. Man it must be nice to force all of your losses on non risk takers and savers eh?
In time 2020 will be seen as the point when the tide went out. What is truly scary is the fact they’ve been running 2 trillion in the red every year since 2020 and the economy is still struggling.
The property is apprising higher /because/ of inflation. I haven’t pulled any permits or done anything to improve the property yet my assessment keeps going up.
Personally I’d love to see my assessment go down by 30-50%. My “equity” doesn’t do anything for me. I can’t pay my bills or buy groceries with fake equity; all it does is cost me more money in taxes.
It’s going to take a long, long time for the housing market to heal from the Fed’s MBS meddling. Each buyer and seller makes a painful and frustrating decision on each individual house until this is all sorted out. It could take a decade for incomes to catch up to prices.
I think that’s exactly what’s going to happen. For the last couple of years, I’ve been posting on Wolfstreet that the housing market would likely stall on stagnant prices for several more years, maybe the rest of the decade, while the dollar’s value gradually falls to meet those high nominal prices (this already happened before in the early-mid 1990s).
There’s no debt crisis, and we may not see one pop up for years or decades. A huge number of mortgages are sub 4% or even sub 3% with low carrying costs, so aside from forced sales by deaths, divorces, or job changes, there just aren’t that many sellers motivated to take a lower sales price. At least not yet. Even if the homeowner dies, the kids may not sell, and people moving for their jobs may just hold on to the property and rent it out. If it sits on the market for too long, many sellers can afford to pull it back off market and turn it into a rental as well. And if renters are willing to pay big bucks, then why not accommodate them?
This is just going to take a long time to wash out while the never-ending march of inflation raises nominal incomes to eventually meet prices. And that’s not even figuring in a biggest generational wealth transfer ever (a lot of it in housing), which is still going to take a couple decades as the boomers kick the bucket. That’s a trickle now, but it won’t turn into a deluge large enough to really shake up housing until the 2030s.
People are likely underestimating how much impact demographics will have in the next 5 years. More people have been leaving the workforce than entering it for the last year on a population adjusted basis. The likelihood the federal government is unable to fund its liabilities without massive inflation is increasing and an ever larger chunk of the population is dependent on that same government. Imagine what a house costs when you can’t get a 30 year loan at any price.
Prices will fall to income, not the other way around.
And in any case, wages would have to triple/quadruple with prices staying stagnant. That kind of increase only happens over a lifetime.
No country ever has had wages go up that much in so little a time.
@jack I used to think the market in N Cal would “revert to the mean” of ~3x median household income to median home price, but 35 years later (after the town I grew up in first passed 10x median income) I have decided it is not going to happen anytime soon (The median home price in the town were my parents paid $22K for their first home in 1962 is now over 100x higher and the median home price to median income is ~15x. I would take an even money bet that the median income to median home price will go lower in the next few years, but I would not take a bet that we will see it go under 8x income to home price in the next decade. I just saw something that showed from 1950-1970 about 50% of the 30 year olds in the US were married “and” owned homes. Today that has dropped to about 10% nationwide (and i’m guessing that it is about 1% in the SF Bay Area) . With more people renting people my age are in no rush to sell the home they grew up in when it will rent for $8K/month and has gone up in value every year for most of the past 60 years.
Apartment investor,
There is a reason why investment products come with a “past returns are no guarantee of future performance” disclaimer.
Just because prices have been rising for 60 years does not mean they cannot fall, or that they cannot fall to ~1970 levels of price-to-income.
Especially since we’ve had a bond bull market since early 1980s as interest rates fell. If you’re like me and think that interest rates will be rising for the next 50 years on average, home prices will collapse hard.
Cali in particular is at risk due to policies pretty much designed to drive businesses away. No high paying jobs means no one can live in homes as pricey as California’s are. I don’t think the future for the state is bright economically.
It’s best to remember that just because something has been going on a long time, doesn’t mean it can or will go on forever – or even continue into tomorrow.
ApartmentInv,
I think the median price/median income stat isn’t very useful. Median income is skewed heavily by lots of really low income people (young, unskilled, etc).
I do, however, think the concept of what you’re saying is likely.
I have very large home now rental
will likely do improvement to include Mother in law suite
sell and buy 2 other homes(smaller)
This stalling of house sales reflects four convergent issues that have stalled housing prices:
1. Higher long term rates, than previous boom period.
2. Much higher price/cost structure for everything but with commensurate gains in wages and salaries still working through the system (still lagging in many jobs).
3. Uncertainty on many fronts due to Trump, and including ongoing job cuts/funding cuts at federal level.
4. Boomers still dying or moving to assisted living add to supply (am seeing this impact where I live in NC).
LoL 4hens, the old term alligator just sprang to mind. One has to remember that the market can always outwait your life, or ability to fund a dead asset. Flipper gonna flop and die, and teh “inwestment” class will flee. Nothing new under the sun. The will return with cheaper prices for money and property.
The hardest part about investing is thinking you are a genius when you have been swimming with the tide, and when it turns to a rip tide, riding it out.
Real estate is not the stock market, and the tides go much longer. But if we get a big rip tide in the stock market, the spillover will be nasty.
The long bond is rallying again, and mortgage rate may go down a quarter point, but is that enough relief to bring the markets up in real estate? Nah. It’s going to be a long winter.
Wall Street Journal last week, “With Individual Home Buyers on the Sidelines, Investors Swoop Into the Market: High interest rates and prices aren’t deterring firms from snapping up single-family properties.”
Right now, cash is king. Individual buyers don’t have it, but firms do.
Sounds like a real estate shill article.
Indeed a real estate shill article.
Institutional investors have pulled back big time.
They may buy with high rates and low prices but not at these price levels
4hens
That’s a BS clickbait headline. Clearly you haven’t read the article and haven’t looked at the chart in the article. The metric is based on PERCENTAGES. Sales to investors have PLUNGED nearly as much as to individuals, but not quite, so investors % SHARE of the collapsed sales figure has ticked up from the lows (even as unit sales to investors have plunged).
And even then, this % share only ticked up a little and only for one month and is STILL LOWER THAN IT WAS, according to the data and chart in the article!!!
The article also says that large investors, such as Blackstone’s former unit, Invitation Homes, have been DUMPING the houses they’d bought in 2012 and have become NET SELLERS, which I have said for a year, because Invitation Homes etc. discuss that in their earnings calls.
Go read the article – at least look at the chart — and try to understand what it says before you post BS clickbait manipulative headlines. The WSJ is a billionaire-owned purveyor of manipulative clickbait bullshit, and you fell for it.
If you don’t subscribe to the WSJ (good for you), do NOT quote the clickbait bullshit headlines just because they fit your narrative. Clickbait exists because it works, because people like you fall for it and spread it.
DO NOT QUOTE A HEADLINE WITHOUT HAVING READ AND UNDERSTOOD THE ARTICLE.
4chickadees is clearly a real estate shill.
Those investors are ‘swooping’ in with other people’s money. Because they must. They don’t have another job.
Might have little to do with ‘value’.
I could do a straight cash deal up to say 800 and not sweat it,could go a little higher but then say shop I want to build ect. may have to wait which is unacceptable,that and will not compete on flu pricing levels with homebuyers whether corporate of just a family looking for a home.
You gotta love MSM still trying to drum up FOMO demand…another one from SFGate published today, search for this headline
“Chinese buyers, flush with cash, are swooping in on California homes”
The long bond is rallying, based on the economy slowing, but the buy the dippers have plunged back into stocks, based on the economy slowing.
It’s a very weird economy/market.
What we have here is a shortage of affordable houses for sale. It’s a misallocation of housing; it’s a misallocation of capital due to atrificially low interest rates and .gov policies. There are plenty of houses.
House and stonk prices were directly targeted by the federal .gov, including the Fed, after the 2008-2009 GFC, when Housing Bubble 1.0 (HB 1.0) burst. TPTB then needed to inflate a new bubble via the Fed’s “wealth effect,” since the U.S. exported manufacturing and there was/is real economy left.
16 years later, here we are, as The Everything Bubble (EB), including Housing Bubble 2.0 (HB 2,0), is now deflating.
Asset bubbles always burst. This one (so far) is the largest and the mother of all bubbles (MOAB). Both the dot-com and HB 1.0 bubbles burst. The Fed didn’t prevent it, just blew a larger bubble in the aftermath. It’s not different this time. No one should be surprised by the current outcome.
When the dust settles after the EB bursts:
1) Get .gov out of all markets an make them free markets again. This may take a 4th Turning, including civil unrest, but that’s history folks, and this is why:
“People of privilege will always risk their complete destruction rather than surrender any material part of their advantage.” – John Kenneth Galbraith
2) Make housing shelter again. Limit investor participation in resi. real estate, and especially SFH. Tax 2nd, 3rd, 4th, etc. houses appropriately. No AirBnB/VRBO/STRs. Make housing affordable again. Demographics sucking – aka no one having babies? Make housing and the cost of living affordable again. No need for .gov interventions.
3) End the Fed. The Fed is the agent of wealth transfer from the lower and middle classes to the wealthy via artificially low rates. Replace the Fed with the U.S. Treas. 2 yr. interest rate. Make interest rates based on free markets.
4) Make the FIRE sector subordinate to Main St./private sector/real economy again. Shrink the FIRE sector in proportion to the real economy.
5) Bring manufacturing back to the U.S. This is happening under DJT.
6) Legal immigration only. Skilled workers only. No H-1B visas. Unskilled workers on temporary visas only.
7) Ban lobbies. No stonk trading by Congress.
8) Term limits for all elected officials, and especially Congress. Make Congress represent its constituents again. Clean out the stables.
9) Shrink .gov back to limited .gov. Rahn curve and Laffer curve.
10) Balance the U.S. budget.
Seems reasonable to me! ;)
Good points. But…
“What we have here is a shortage of affordable houses for sale.”
That’s the upside-down version. Here is the right-side-up version:
What we have here is lots of homes for sale that used to be affordable, but because prices have exploded (due to ultra-low Fed-engineered mortgage rates) are no longer affordable.
If prices are allowed to fall for years and incomes come up, at some point, those once affordable homes will be affordable once again.
I’d love to know if the FIRE (financial independence; retire early) movement has been large enough to affect this.
That movement is explicitly about ploughing money into buying homes/apartments, then retiring at 35 and living off the rent.
It is popular with the millennial generation, as an evolution of Dave Ramsey influenced thinking.
FIRE=Finance, Insurance, and Real Estate sectors. Along with .gov involvement, it’s crony capitalism; it’s a cartel.
I like your definition of the acronym better, but achieving this by real estate only works when housing bubbles are inflating. The U.S. housing bubble (HB 2.0) is now deflating. Reference: HB 1.0.
banana republican
That’s the old meaning of “FIRE”
The more recent meaning of FIRE is “Financial Independence, Retire Early.” That was a big thing during the pandemic.
That’s the kind of confusion that we get from throwing around acronyms without spelling them out.
Good luck with that. I’ve known more than a few people who thought that renting houses was easy money.
Spoiler alert: It isn’t.
And here in Tucson, I’m seeing the surge of “for sale” signs firsthand. It’s not as big as it was back during Q3 2005, when the Housing Bubble 1.0 started bursting, but give it time.
I’m also seeing houses that were listed for sale, and then they were listed again as rentals. Methinks that a lot of stuck flippers are going to get a tough lesson in landlording.
I am not sure where you got the idea that FIRE “ is explicitly about ploughing money into buying homes/apartments, then retiring at 35 and living off the rent.”
FIRE has very little to do with becoming a rental landlord. In fact in many ways it is the opposite. Being a rental landlord costs a lot up front, takes a lot of time and major effort, and includes a lot of future costs and aggravation. Not exactly “financially independent and retired early “. It is just a change in careers.
All the proponents of FIRE I know would not touch rental real estate, instead they prefer to pay off their home mortgage so they have no debts. FIRE is definitely about reducing debt because having debts limits your independence.
Arizona Slim, exactly.
The number of people I’m seeing saying things like “I’m not giving up my 3% rate. If it doesn’t sell for what I ‘need,’ I’ll just hold on to it and rent it out.”
As you said, good luck.
A lot of people, especially if they bought at peak pricing in the most bubbled markets, can’t even cover their fixed costs with rent, and that’s not even including unknowns, like repairs, insurance increases, and so forth.
I have some landlord friends. Most of them, this year, have only raised their tenant’s rents by 2-3%, if at all. They know there’s a limit to how much you can go to the well.
Agreed.
Key point: “If prices are allowed to fall for years and incomes come up, at some point, those once affordable homes will be affordable once again.”
Unfortunately, last time, prices weren’t allowed to completely mean revert after the 2008/09 HB 1.0/GFC. The .gov and Fed stepped in and the housing/stonks asset bubble was reflated via QE and MBS purchases. It then got much worse during the pandemic.
According to history and reasonable valuations, mean reversion eventually wins out. That’s going to be inflation-adjusted (real), so at a higher level, but still much lower from here.
Based on the difference in 30 year fixed-rate mortgage rates between artificial pandemic ~2.6% rates and current ~6.6% rates (+400 bps) and a constant P&I monthly payment, house prices are about 40% overvalued now. Inflation in carrying costs not included (property taxes, homeowner’s insurance, HOA fees, maintenance and repairs, etc.).
In my view, free markets can work all of this out, but there are too few opportunities for graft and corruption. Lower rates aren’t going to result in lower prices, and just the opposite, in fact. Shelter-buyers need lower prices, as you say. This will (hopefully) happen, and will likely take several more years to get there.
Call me old fashioned, but I’d like to see a median house price to income ratio of 3:1 and a house price to rent ratio of around 1:1. That used to work pretty well. Right now it’s at least 50% more expensive to own than to rent in most MSAs, so renting is the lower cost option.
Unfortunately, in our debt-based economy, debt needs to continuously increase, else the wheels fall off the bus. Of course not sustainable. We’re nearing the end game now, IMHO. This is global.
Debt isn’t wealth, but only the illusion of wealth. Wealth = (assets – liabilities (e.g. debt)). Make savings and productive investment great again.
“…and a house price to rent ratio of around 1:1.”
Oops! That should be a house P&I mortgage payment to rent payment ratio of around 1:1.
Always run the buy vs. rent calculation and let’s not forget about cap rates! I don’t think housing is “penciling out” for investors or shelter-buyers today.
Also, I wasn’t aware of the new meaning of FIRE. Thanks for the clarification here. I think we all can agree that the housing market certainly isn’t on fire.
Fully agree. I’ve made that argument many times. Wealth is ultimately based on a society’s ability to produce. It’s stored production, in a way. People trading houses, stonks, bitcoin or anything else back and forth at higher and higher prices, while society’s production doesn’t change, isn’t making society wealthier.
overheard at a neighbor’s, recently: “…honey, that’s why we can’t afford any NEW ‘nice things’ unless we give up and get out from under the monthly on some of those OLD ‘nice things’ that we’ve gotten used to having …”.
may we all find a better day.
The upside down version is the version used by all the developers and government officials in Canada at least.
There was one guest on our business news network (BNN) that indicated your right side up version. He figured about 10 years for wages to re-balance with home prices. Never saw him again on BNN.
I like ALL of your points Banana Repub, especially number 2!
@ banana republican:
> Get govt out of markets
> Limit investor participation in resi. real estate,
> and especially SFH. Tax 2nd, 3rd, 4th, etc.
> houses appropriately. No need for .gov
> interventions.
==================
I support the outcomes you want wholeheartedly.
But everything you suggest is for government intervention “in the right way” so the outcomes can be beneficial to the masses, not to the tiny percentage of people who own and/or control the various sectors of the economy.
Where your theses gets contradictory is when you say that the free markets will sort it out but the means you suggest are all government interventions.
@ banana republican:
Btw, this is what happens when ideology conflicts with logic.
‘…one man’s logic is another’s metaphysics…’.
may we all find a better day.
Looks like “@ banana republican” has a genie which is going “Limit investor participation in resi. real estate, and especially SFH. Tax 2nd, 3rd, 4th, etc. houses appropriately”!
No government intervention needed. His/her genie will take care of it…!!
And free markets will prevail according to his wishes.
Eventually this mitigates.
Perhaps then a good number of mortgages held by the Fed will come off the balance sheet. Until that day.
Lower Rates, Increase QT!!
The big problem is… People that overpaid (everyone that bought a house in last 5 years) in those areas with larger inventory (like Colorado) are not lowering their prices. They either refuse or won’t take the financial hit. So, the prices will never lower, regardless of excess inventories.
Let’s face it… inventories have been artificially managed for the last 10 years (really starting in 2008). We allow companies like Black rock and Airbnb to take 30% of the inventory (mostly the best houses of the bunch pick by AI). It shows that Supply & Demand is NOT really the balancing act that economists claim it to be, since it’s artificially constrained by greed.
I agree the people who overpaid will not lower their prices. But will people who didn’t overpay, because they bought in 2019 or before, still refuse to lower prices, or are they committed to getting a 100% return, and won’t sell for a dollar less?
That’s the real question, as they’re the ones who can afford to sell for more reasonable prices, and still at a nominal profit, just not as big of one as they would have had in 2022.
The only group of home buyers who didn’t overpay bought them in 2012.
Sellers will eventually be forced to sell due to life events.
It’s true that existing-home sellers are high as heck and refuse to lower their prices, but this doesn’t change supply and demand.
Even if they never wake up, they will be forced to sell eventually due to life events. Forced selling results in lower prices.
The other part of the deal is that so long as existing-home sellers continue to act like they’re doing drugs, home builders can and will expand construction until prices come down to where they should be. Wolf has this information in other articles. Their business model is based on throughput, so they will keep building regardless of what price level they have to meet.
Furthermore institutional investors are constrained by market reality as much as anyone else is. To make money from real estate, you have to either buy and use it or rent it out. If you leave a house vacant, the capital gains you have will be limited since prices can’t go up forever when wages aren’t.
With the carrying costs of housing going up with prices, leaving houses vacant to enjoy capital gains is quickly becoming a losing proposition. And when they sell, supply goes up.
This idea that real estate prices can stay stagnant forever is as much an industry fiction created to sell more as the idea that prices can go up forever. It’s taking a while because real estate is illiquid, but supply and demand do apply.
what cant go on forever wont or will it. I got my popcorn out.
The thing with real estate valuations is the comps are based on what the last guy paid, and this impacts everything from rental prices to new construction. That’s one reason why the developers have had such high margins for years – why not charge a premium for a new house when folks are willing to overpay for an old house.
At the limit, if you put 1000 people in a circle and each sells their current SFH to the person to their left for 10% more, everyone’s property value goes up. To quote the great Dave Grohl: ‘Don’t yank my crank!’
When real estate doesn’t magically appreciate by 5%+ per year, then the carrying costs become real. It’s just a question of many stagnant seasons the speculators/investors are willing to hold out in the hope that vacant SFHs start to appreciate again without actually doing anything useful.
Most of the value of a residence – especially here in Coastal California – is based on its location and all of the lot have already been developed so there is choice between an older used dwelling and a new dwelling. By the way, dwellings are a depreciating asset which is why anyone who rents one out is allowed to take depreciation write downs.
I think that’s true for people who don’t have to sell, but divorce, switching jobs, losing jobs happen and then people have to sell. They won’t be able to rent for the cost of the mortgage so eventually they’ll have to sell.
And yes I know everyone thinks they can just rent or Airbnb it – but the rent for a small nice house seems to be dropping rapidly since a lot of the remote workers got called back to CA. Also you no longer have a single person willing to pay $3k to rent your place – you instead can have 4 mid 20s males who will trash the place or a family with little kids. Good luck!
Very much lately 2006 vibes.
In our local market in Oregon, there are NOW many recent listings with prices at or below what the owner paid 2021-2024.
Only 3 months ago, there were NONE such listings.
The market is turning folks.
Yeah as friends are moving out of places they rented in 2021 they’re getting relisted for significantly lower rent. My friend who got divorced rented a place for $3500. The new rent it’s listed for is $2800 and it’s sitting… Pre 2020 it would have rented for $2,200 maybe less. It’s cute but not a lot of square footage , not a great yard and in the suburbs and not popular suburb – a only people with children who do nothing but soccer practice suburb. That area most people buy. There’s far more desirable places for $2800 – Boulder or Golden if you want a richer suburb. Or Lakewood, Littleton or Broomfield if you want more for your money. But $3500/mo was what it was worth when boards of people were moving to CO during COVID.
Anyways, anecdotal, but I see the same theme repeating over and over enough so that it feels like a pattern
*hoards of people. Gotta love Android autocorrect
MM1 – totally-with you on auto-ai-whatever, but reckon a little sympathy should be extended to it, as keeping up with the flat-out speed of evolution of human spoken-language usage/meaning into the written word must be hellishly-difficult (…in this instance highlighting the homonym of: ‘hoard’ and ‘horde’, I have noticed these two words and their meanings become slowly, but surely, synonymous when used in print…(…and far from the only example-i daily give thanks to the gawds that I’m a ‘native speaker’…)). Best-
I’m in Colorado, prices have already come down from 2023 level highs, and are dropping like a stone, this is true in the Front Range and even more so in the mountain towns, people are paying well less than asking price and condos are in free fall
Just saw a video that basically said the American dream is dead. It showed a quote by MTG and graph saying that only 12% of 30 years olds are married and own a home. 12%. Let that sink in. Uncle Donnie should prevent large corporations and private equity firms from purchasing homes.
Fewer marriages ❤️ = fewer divorces 💔
Maybe younger people figured something out?
But yes, fewer divorces is BAD news for Realtors.
The main reason that less 30 year olds are not married and own homes is that about 1/3 of “adult” men under 30 still live with a parent and at least another 1/3 are spending more time playing video games than dating. In the past 40 years that I have been in the rental apartment business the percentage of men (and women) who do not appear to have any interest in dating keeps increasing.
Apartment Investor, the quality of women keeps declining. Lots of men do a cost benefit analysis and determine they aren’t worth it.
Apart from financial reasons, one more reason is: Many more ways to be entertained than being in relationship.
We now have AI companionship. In next few years, we’d have life size AI humanoid.
The technology advancement is in many ways making marriages needless.
@Idontneedmuch
If by quality, you mean the fact that:
1. more women than men are graduating with masters degrees and PHDs
2. Less women in their 30s than men live in their parents
3. Women now have financial independence so they can be picky and only date men who add value to their lives
So yeah I guess that could be emasculating or intimidating to some very insecure men and feel like a quality decline. Lol.
MM1, you said it. Oh, and more single women own homes than single men? Their partners live with them, and women especially would be fools to marry someone in debt or possibly just bad with money but otherwide OK.
Such a decline in quality, that financial independence.
@MM1 @Mountaintime
You guys clearly haven’t taken the red pill.
The chickens are coming home to roost.
The roosters are chickening out® ©
The hens are pecked out.
…what will this do to egg futures?
may we all find a better day.
A Tale of Two Cities:
Desired price versus the reality of actual sold price.
“”I am weary, weary, weary–worn down by misery.”
CD
There’s a really interesting behavioral difference, between people in GFC, who rightful, in many cases, realized they screwed up by over extending themselves, by using too much leverage, or simply had no way to make a house payment work. Jingle mail was a huge trend, as people walked away from their financial disasters — now, post pandemic, we have an entitled class, who demand and desire obscene profits from selling — or they delist.
GFC was fear and now we’re blessed with deeply engrained greed. The people crushed with GFC fear, eventually rebuilt lives and moved on, many recovering — but this 2025 group, will probably end up seeing the future recovery pass them by — because buyers will end up moving on from unrealistic prices and find alternative ways to get on with life.
It’s likely that a recovery per say, will take many years and in that time, inventory will grow as prices slowly grind down — this won’t be fast and easy.
Nice to see there is more choice than ever for anyone wanting a house in many areas of the US. Now all we need are some nice bargains starting at a little less than $15,000 like in the 1960s.
MW: Here’s the case against a September rate cut — and why the Fed could stay on hold until 2026
Yeah, Idaho went crazy and priced locals far out of the market for rent and purchases. The ENTIRE state. Ada County area is now seeing rents not rising and even some complexes offering paying rent in installments. They know they done F’d up and how to correct it all? Giant Boom
Gonna be heard one day soon. When locals making even $100k a year went from a good living to basically poverty in 4 years? That is MESSED up. Investors and rich Boomers are literally the ONLY ones I know purchasing right now. Young families rent or work relentlessly. Unsustainable doesn’t even cover what happened to Idaho.
Not much downward price flexibility in historical housing prices. Powell’s error permanently stoked housing prices.
The link that you included led to a chart that was over a year old. Things changed since then.
I’m just a little surprised that Wolf continually covers the various housing markets in the U.S. but he never addresses HOW housing got so extremely overpriced or the very possible scenario of a MASSIVE market correction (meltdown).
It’s as if many people went to the local car dealership and every car was priced at $200K or more. How many people would buy a car at that price? Maybe the wealthy would out of necessity.but few others. The current housing market is like this – the MATH doesn’t add up!
This sluggish pace of a $800K home coming down in price by 50 cents per month is getting old. Something is not right – this much is very obvious. Maybe people will look back in disbelief after the dam breaks?
“but he never addresses HOW housing got so extremely overpriced”
My whole website is full of that stuff 🤣
…at some level, one has to enjoy spending time in the library, at least a little, to benefit from its collections…
may we all find a better day.
Wolf was way ahead of the curve on the Fed inflated bubble, “most reckless Fed ever”was the operating phrase.
Sellers are not desperate. They want to sell but apparently are in no rush to do so. Some bubbles in the past were broken due to job losses resulting in forced sales. This bubble is unique (?) in that sales are apparently voluntary sales. If pulled from the market they hold or rent. Rentals prices are weakening but only from inflated prices, they have not dropped excessively. So renting out homes is still a financially viable option for most.
I agree. At this point sellers are not desperate and holding on for higher prices/lower rates. But I doubt that’d come any time soon.
It takes one or two house in a neighborhood to bring the whole comps down and the general direction of prices are nothing but down only.
Those who panics first panics the best!!
There looks to be some hefty price declines here in FL so some sellers must have to sell. This is all happening while economic indicators look quite healthy. What happens when unemployment returns to normalcy around 5.5%?
Still a lot of downside risk for home values.
A wise man once said he who panics first panics best.
If unemployment ticks up, this will get ugly fast. People are living like they will always have their current job, and an entire generation has no memory of 2008.
Thank you! Anyone buying should see these numbers.
As for investors, there would be few active foreclosure listings in some of these states if investing were so hot at the moment. They are all over the public auctions when they see fit, which is not right now.
Funny. San Jose Spotlight (a local news site) just published an article discussing skyrocketing rents in the San Jose/Silicon Valley causing displacement of government employees. According to author Annalise Freimarck.
Manipulative rental-landlord-paid clickbait. Asking rents are up 3.3%, about in line with local inflation. That increase has come down from half a year ago and is a LOT smaller than it was a few years ago. Did they blame the tariffs too, for good measure 🤣
Say it ain’t so: a reporter writes an article not based on facts and verifiable data? Color me surprised. 😉