December, prior months revised higher. Goods prices jump month-to-month by most since August 2023, turn positive for first time in a year.
By Wolf Richter for WOLF STREET.
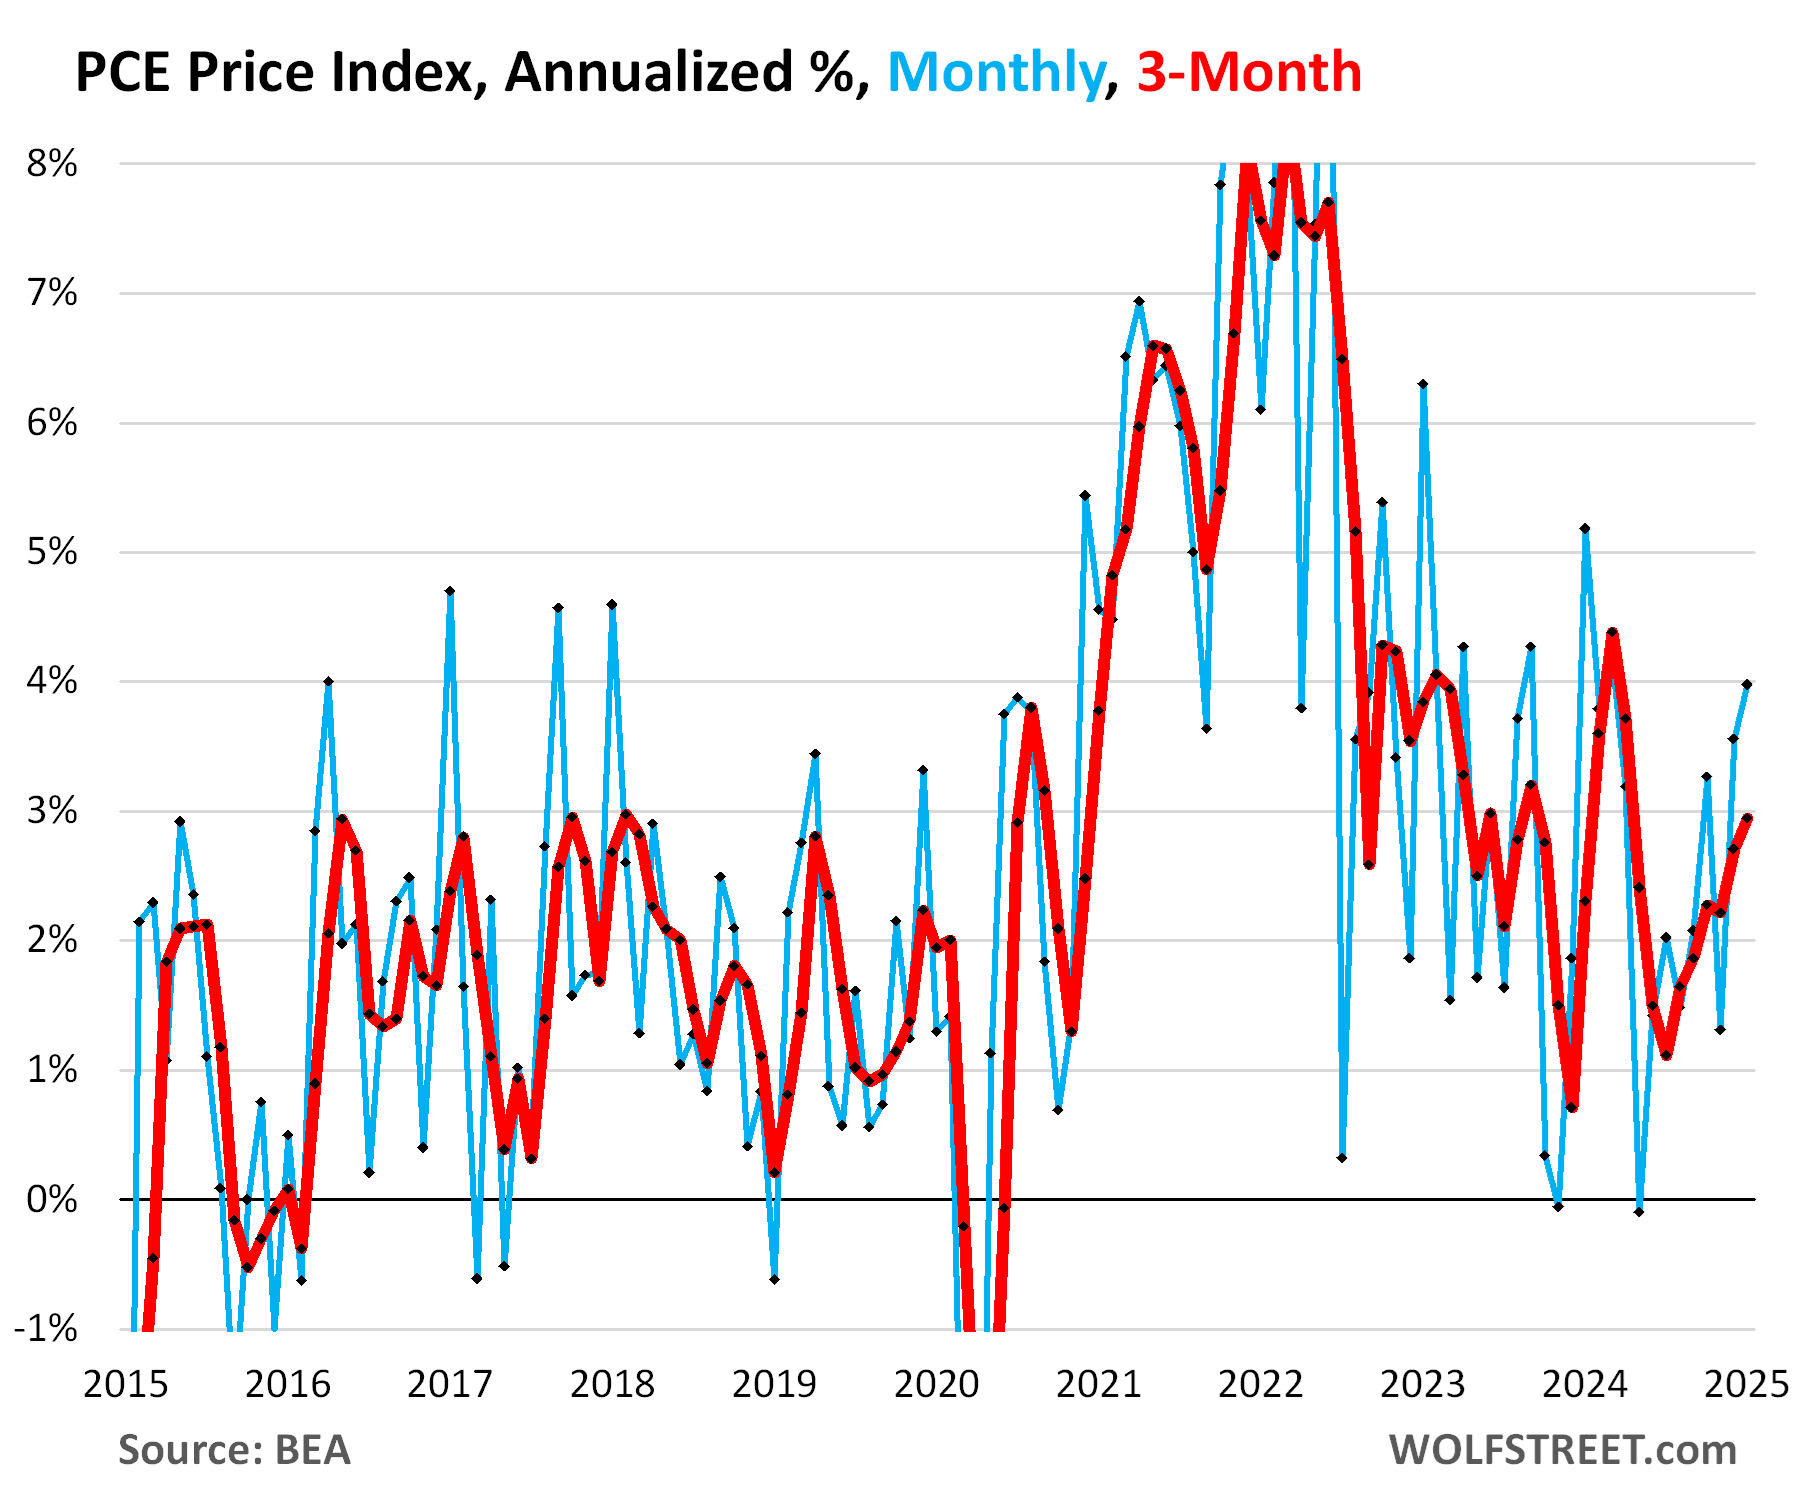
The inflation measure released today – the PCE price index favored by the Fed as yardstick for its inflation target – jumped by 0.33% in January from December, or by 4.0% annualized, the worst month-to-month increase since March 2024. And this was on top of the upwardly revised December increase.
So, the 3-month PCE price index accelerated to +2.94% annualized, the worst increase since April 2024. The low point of the three-month index was in July (+1.6% annualized), and it has been accelerating ever since. The chart shows the month-to-month changes (blue) and the three-month changes (red), all annualized.
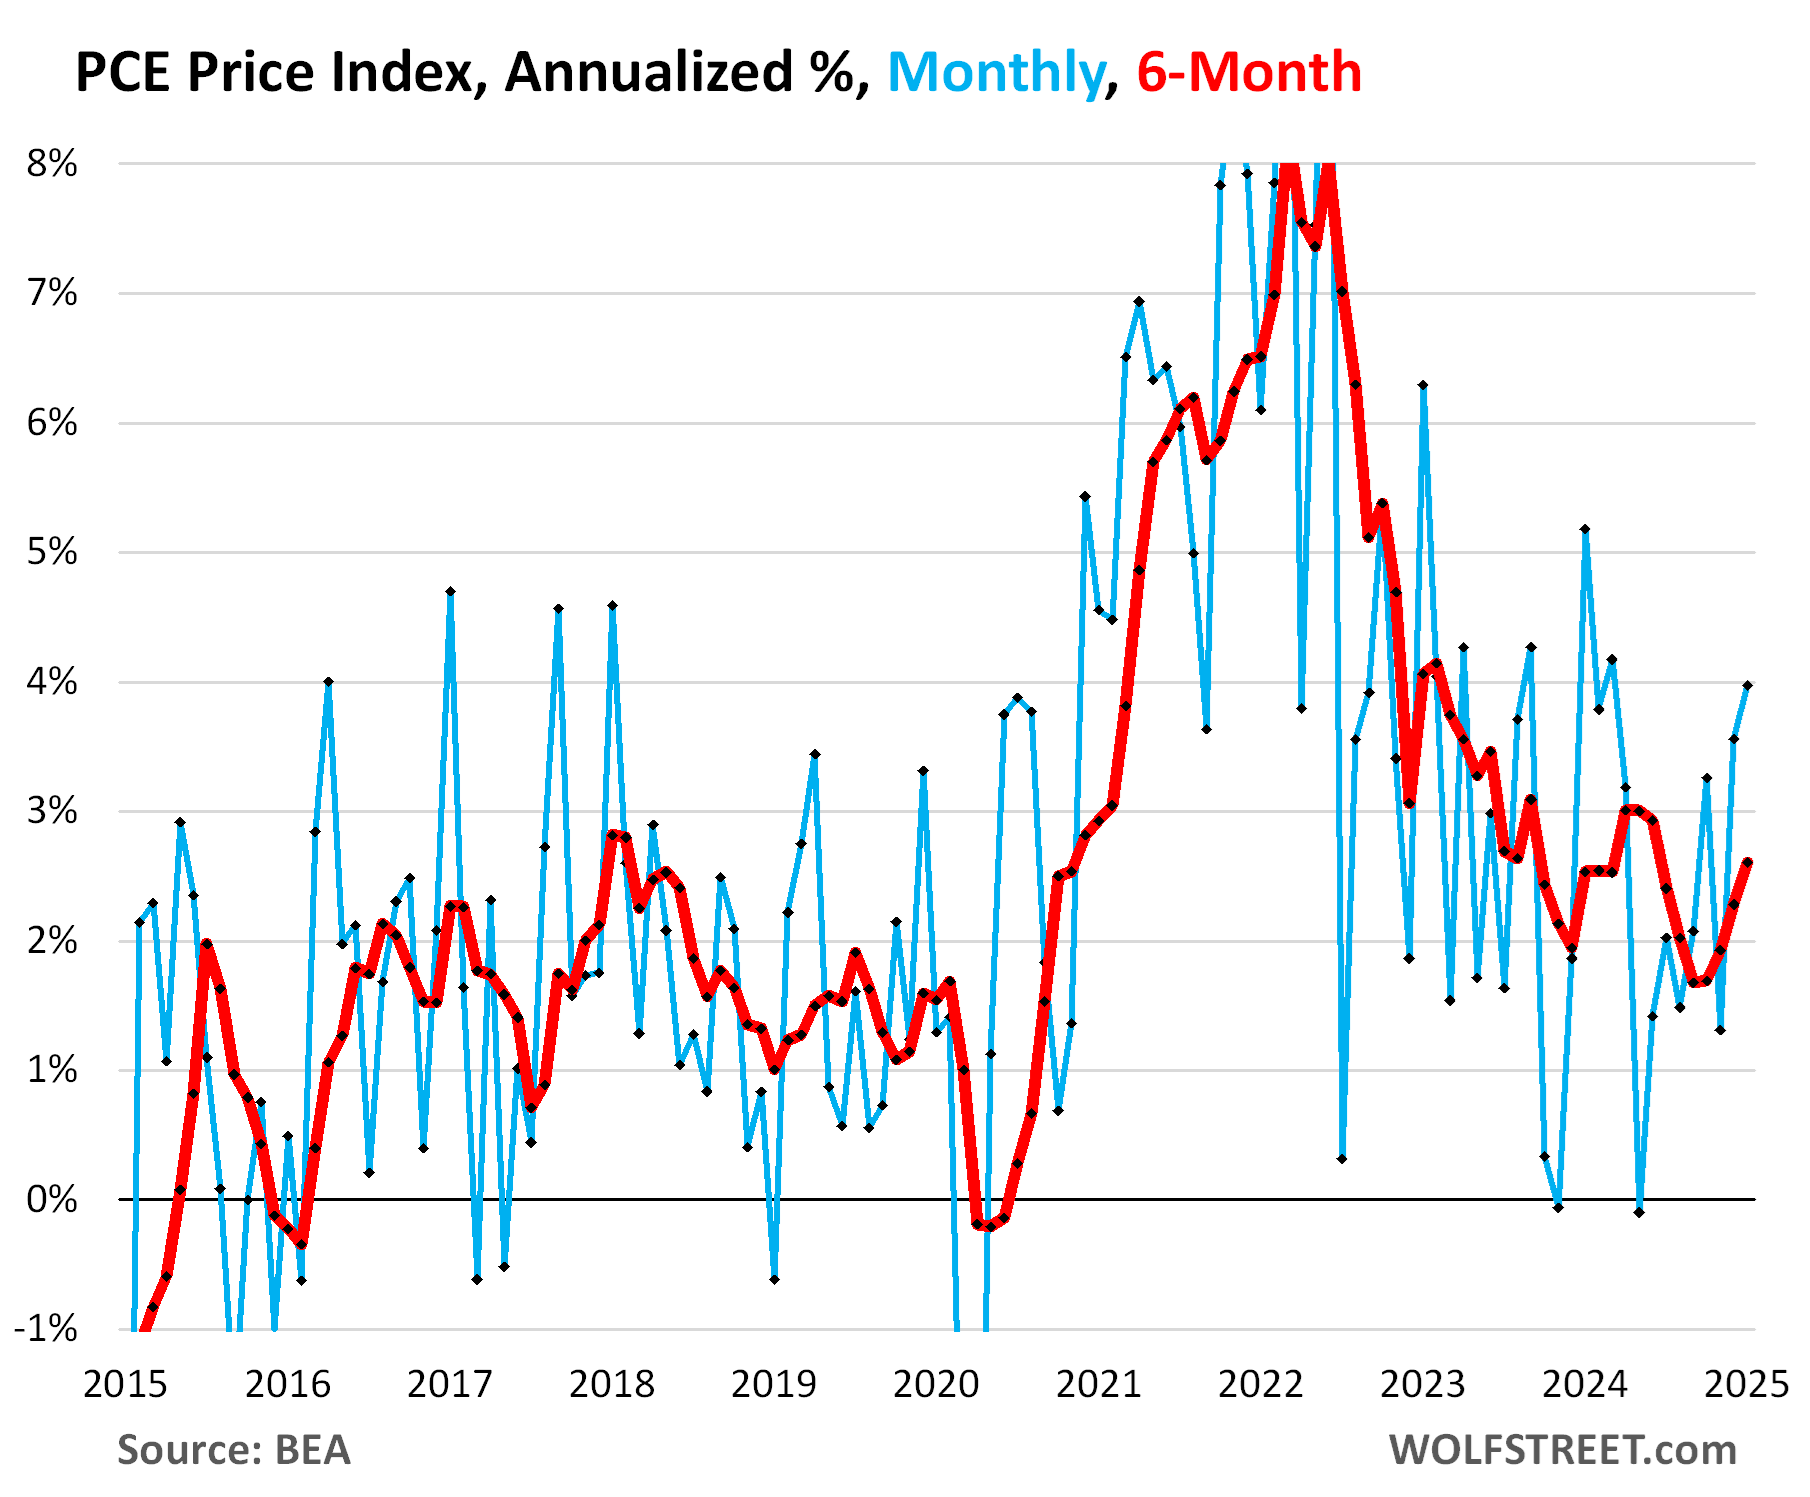
The 6-month PCE price index accelerated to +2.6% annualized, the worst increase since June 2024.
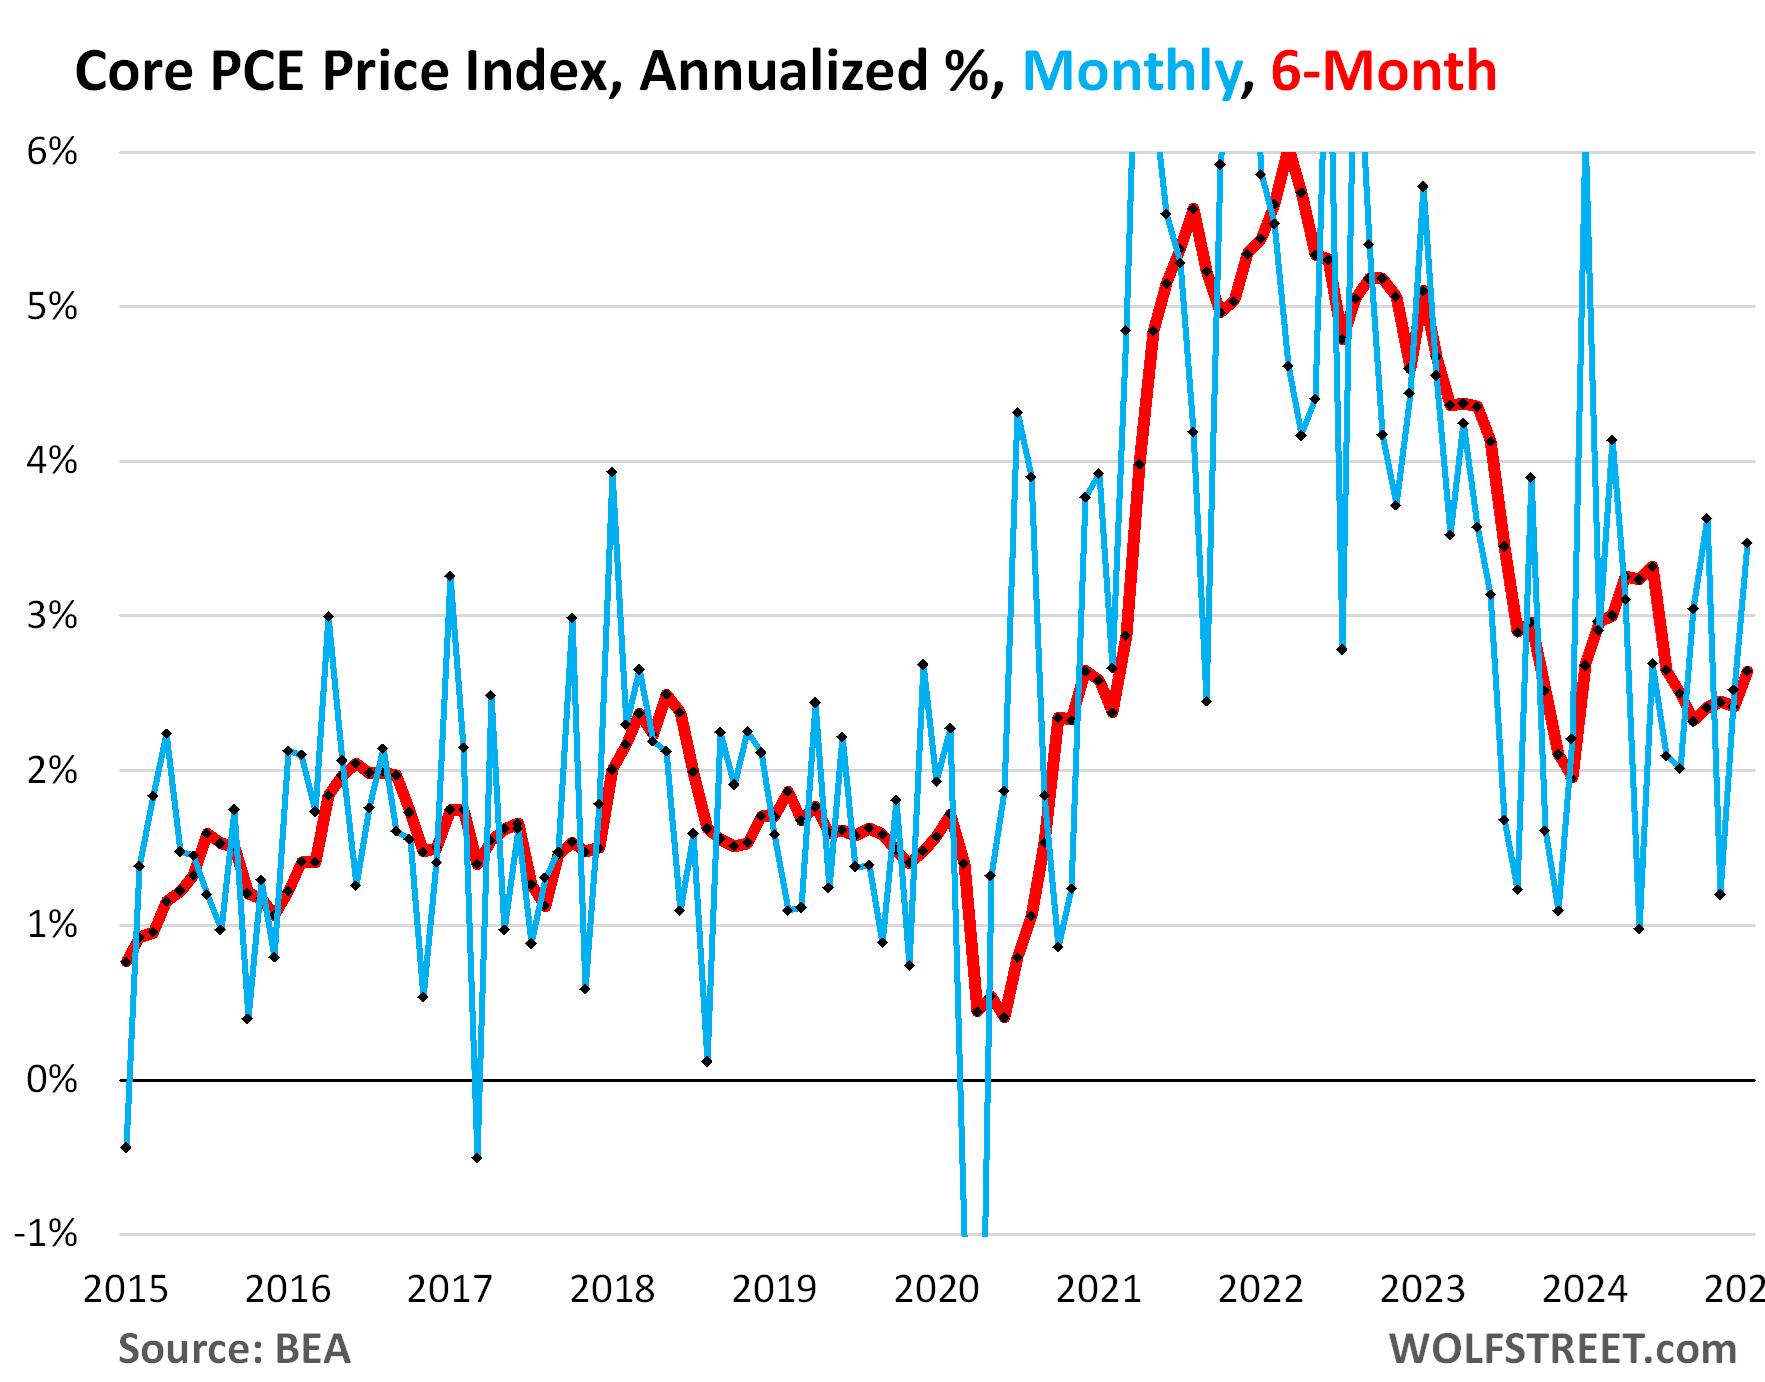
The core PCE price index, which excludes food and energy items, accelerated to +0.28% in January from December, or 3.5% annualized, the worst increase since October, and before then since March 2024.
The 6-month core PCE price index accelerated to +2.6%, the biggest increase since July 2024.
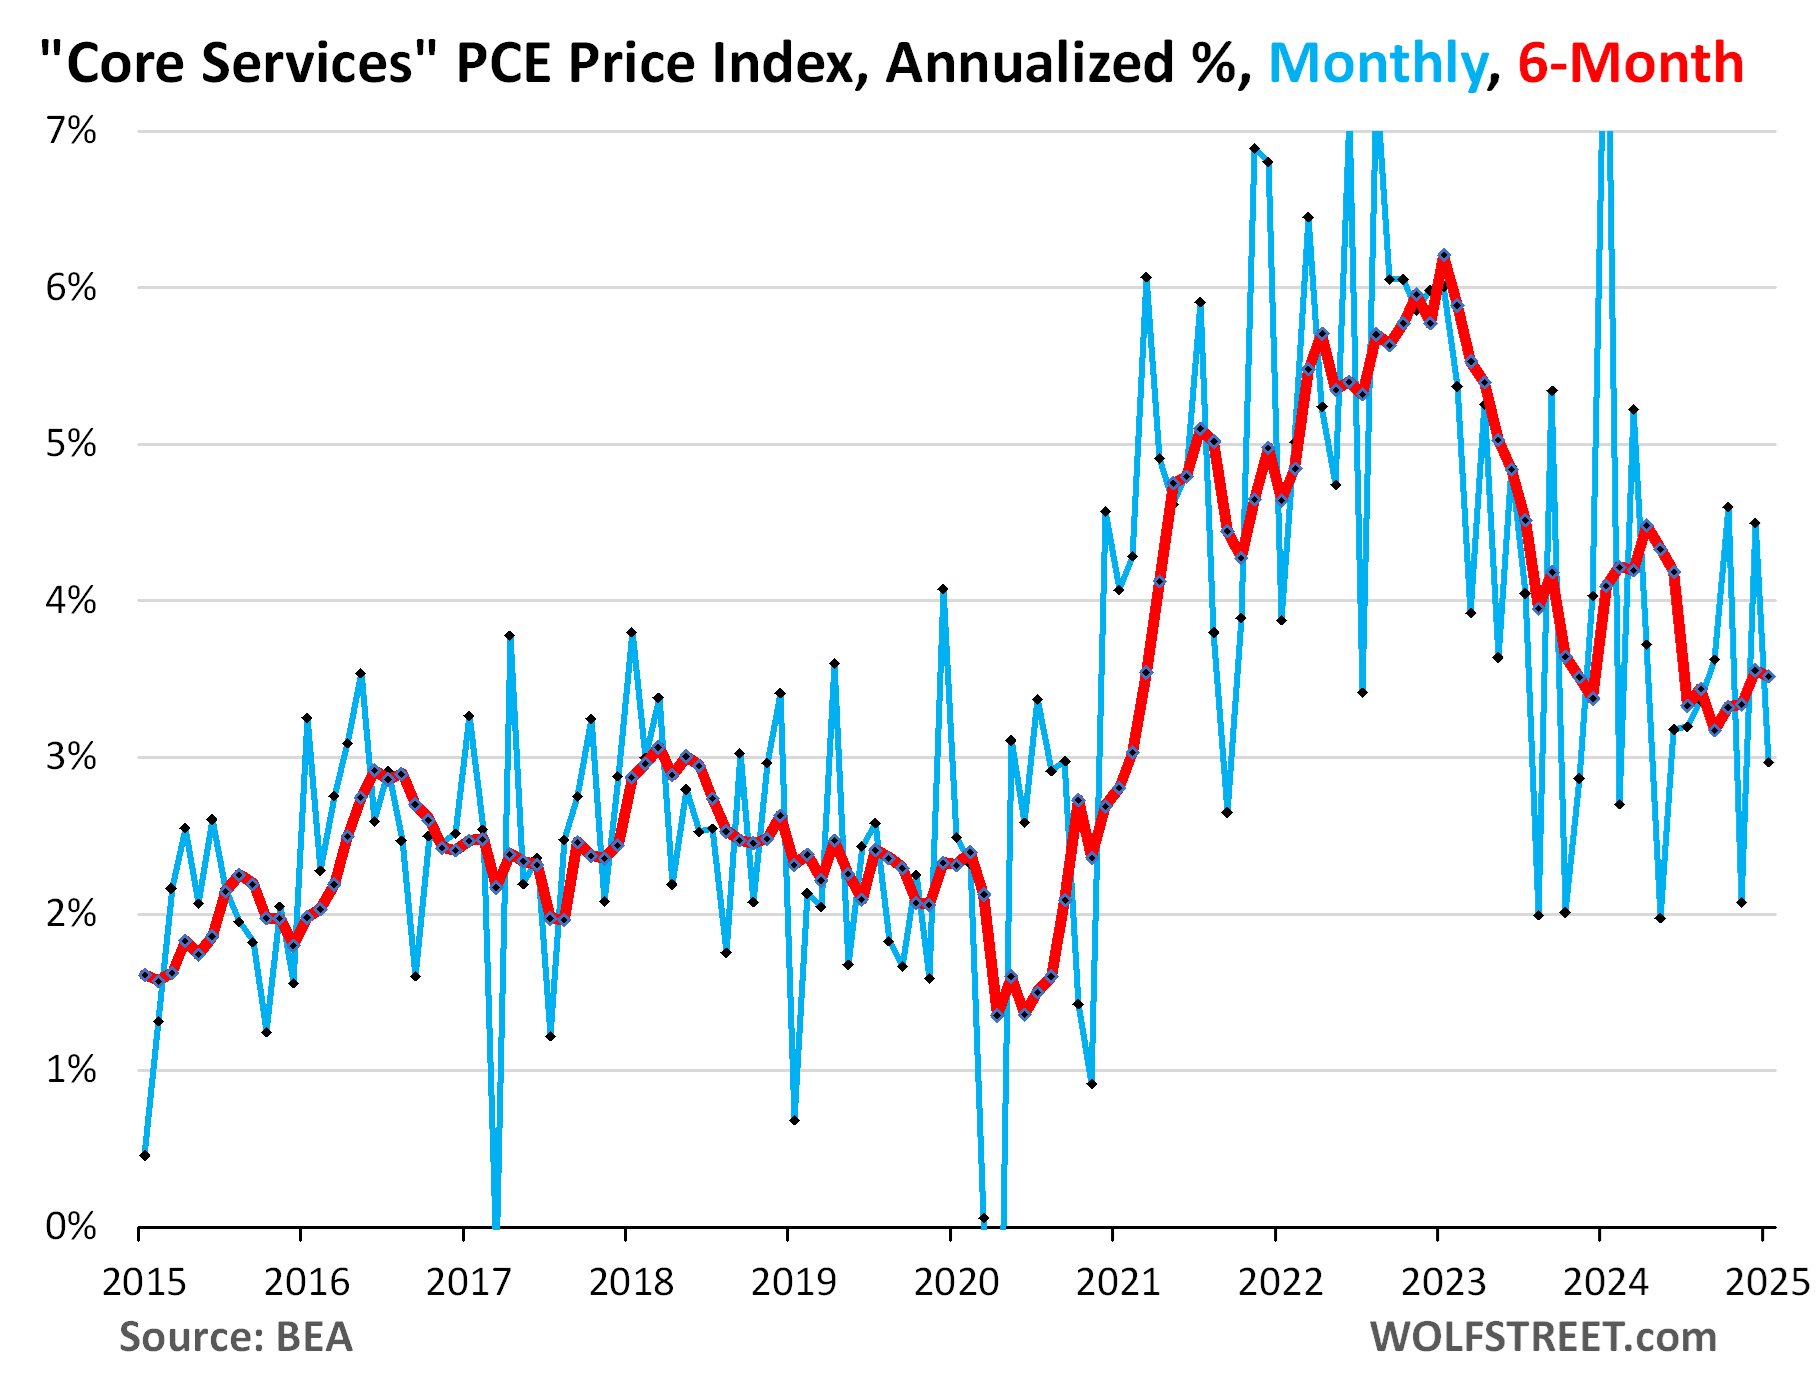
The core services PCE Price Index, which excludes energy services, decelerated in January, pushed down by three sub-indices that had month-to-month declines (negative readings).
On a month-to-month basis, this is very volatile data, except for the housing index. And these individual month-to-month changes tend to spike and plunge. So these are the changes in January from December, annualized:
Three subindices of services had negative readings:
- Healthcare services (-1.5% annualized)
- Transportation services (-4.9% annualized)
- Insurance (-5.1% annualized)
Four subindices of services accelerated:
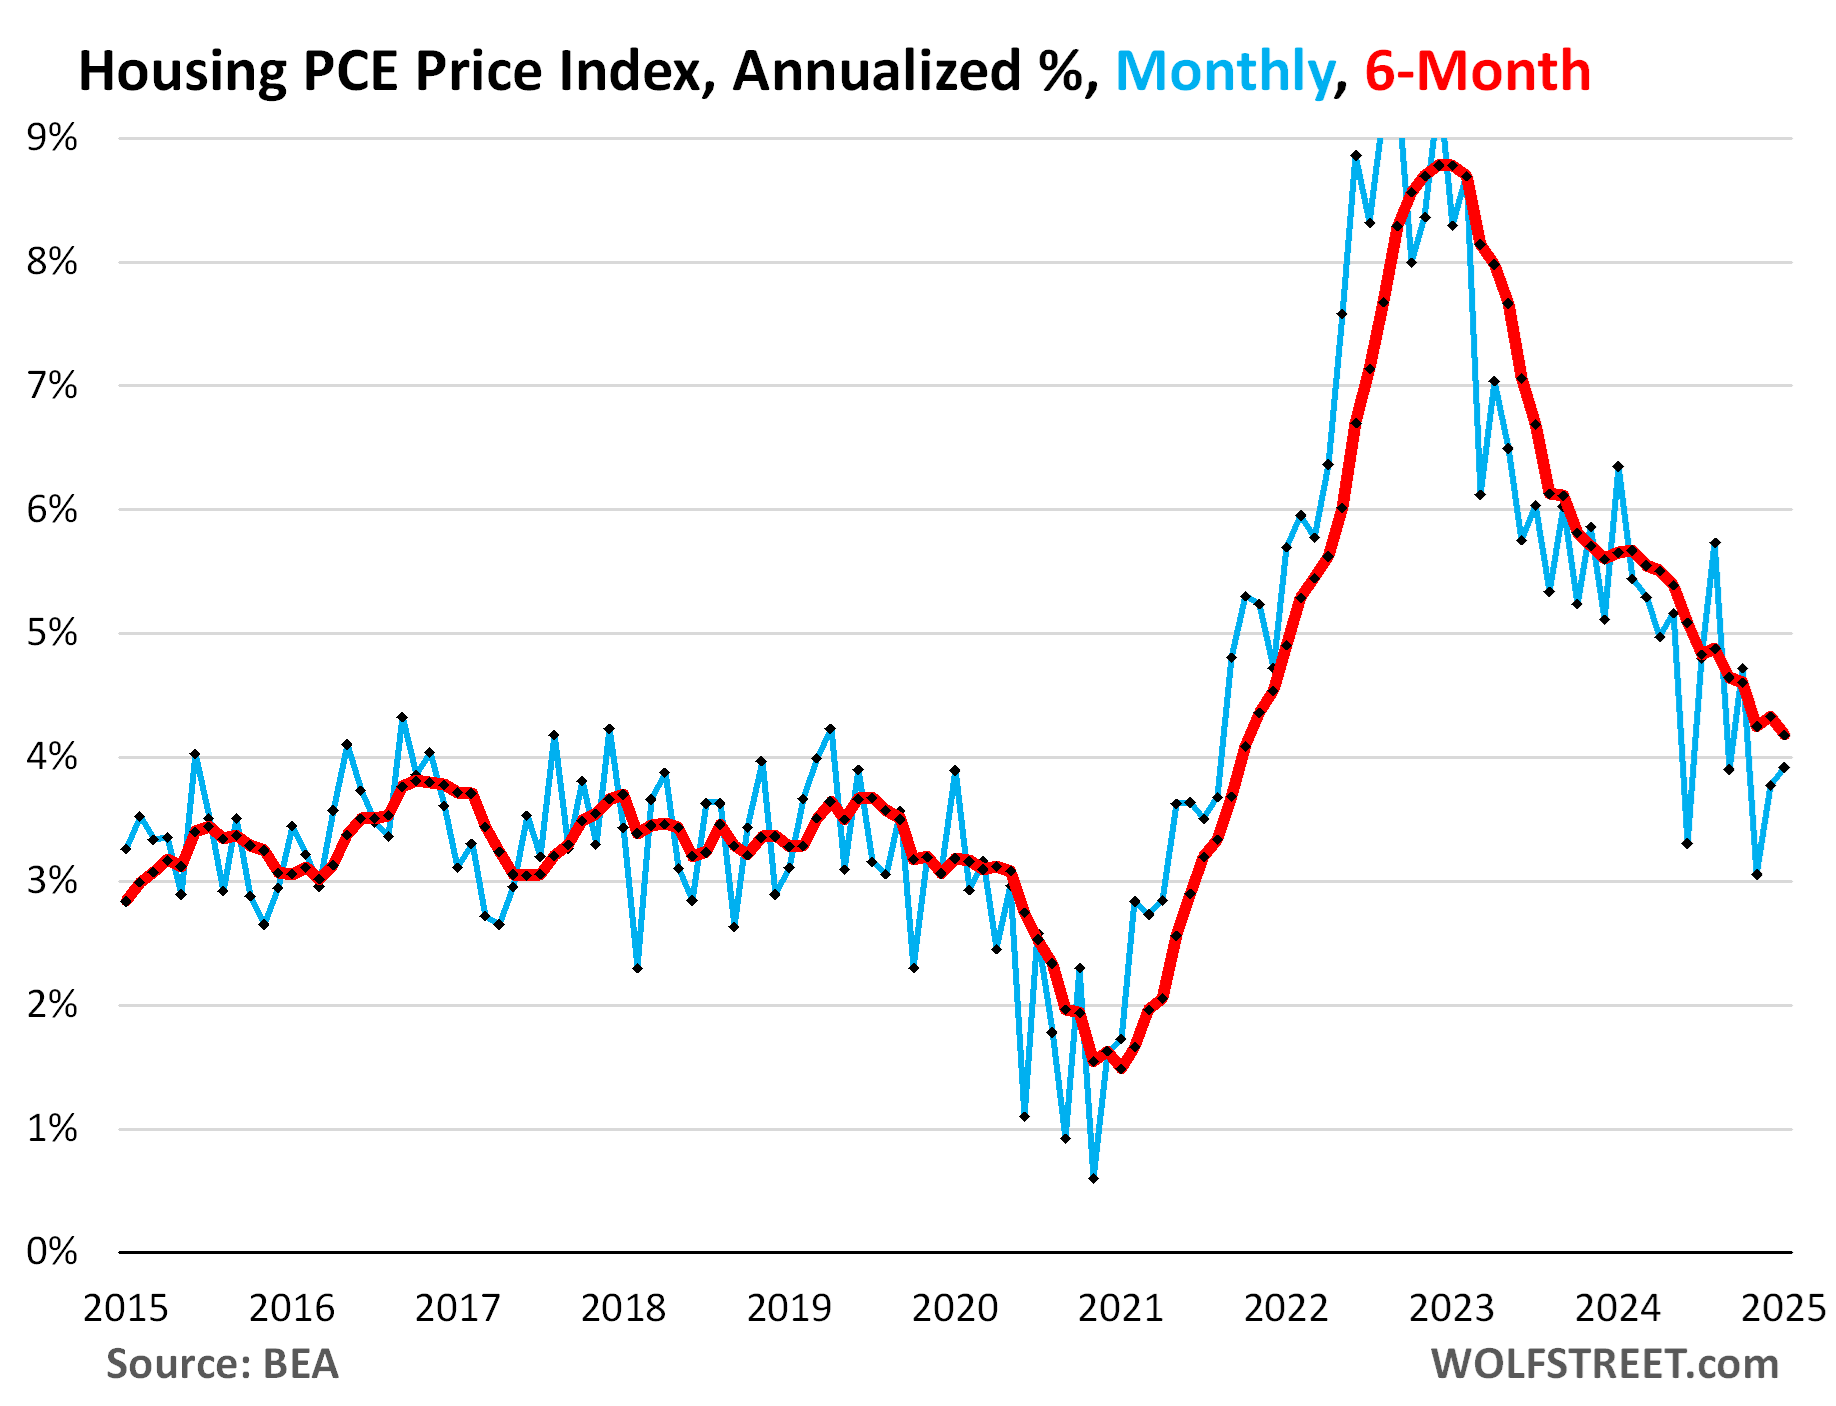
- Housing index (+3.9% annualized).
- Food services index (+4.8% annualized)
- Non-energy utilities (+8.0% annualized)
- Recreation services (+14.6%)
Two subindices decelerated:
- Financial Services (+7.3% annualized).
- Other services (+1.9% annualized)
The PCE price index for housing, which is part of core services, rose by 3.9% in January from December, the second month of acceleration. The six-month index decelerated to 4.2%
The base effect, as always, but this time it was big.
The year-over-year change in January was the sum of the 12 month-to-month changes of February 2024 through January 2025. The December year-over-year increase was the sum of changes from January 2024 through December 2024.
In January 2024, the services PCE price index had spiked month-to-month by 0.68% (the off-the-chart 8.5% annualized). This high reading of 0.68% fell out of the 12-month time frame of the year-over-year change in January 2025, and was replaced by the January 2025 reading of 0.24%. And this caused the year-over-year change to decelerate to 3.4%.
This is the infamous “base effect.” It happens with all year-over-year measures every month. And it’s usually not big. But this time in services, it was big and deserves this special mention (yellow in the chart below).
Because the services index weighs so heavily, it caused the year-over-year readings of the core PCE price index (blue) and of the overall PCE price index (red) to decelerate as well. Details below the chart:
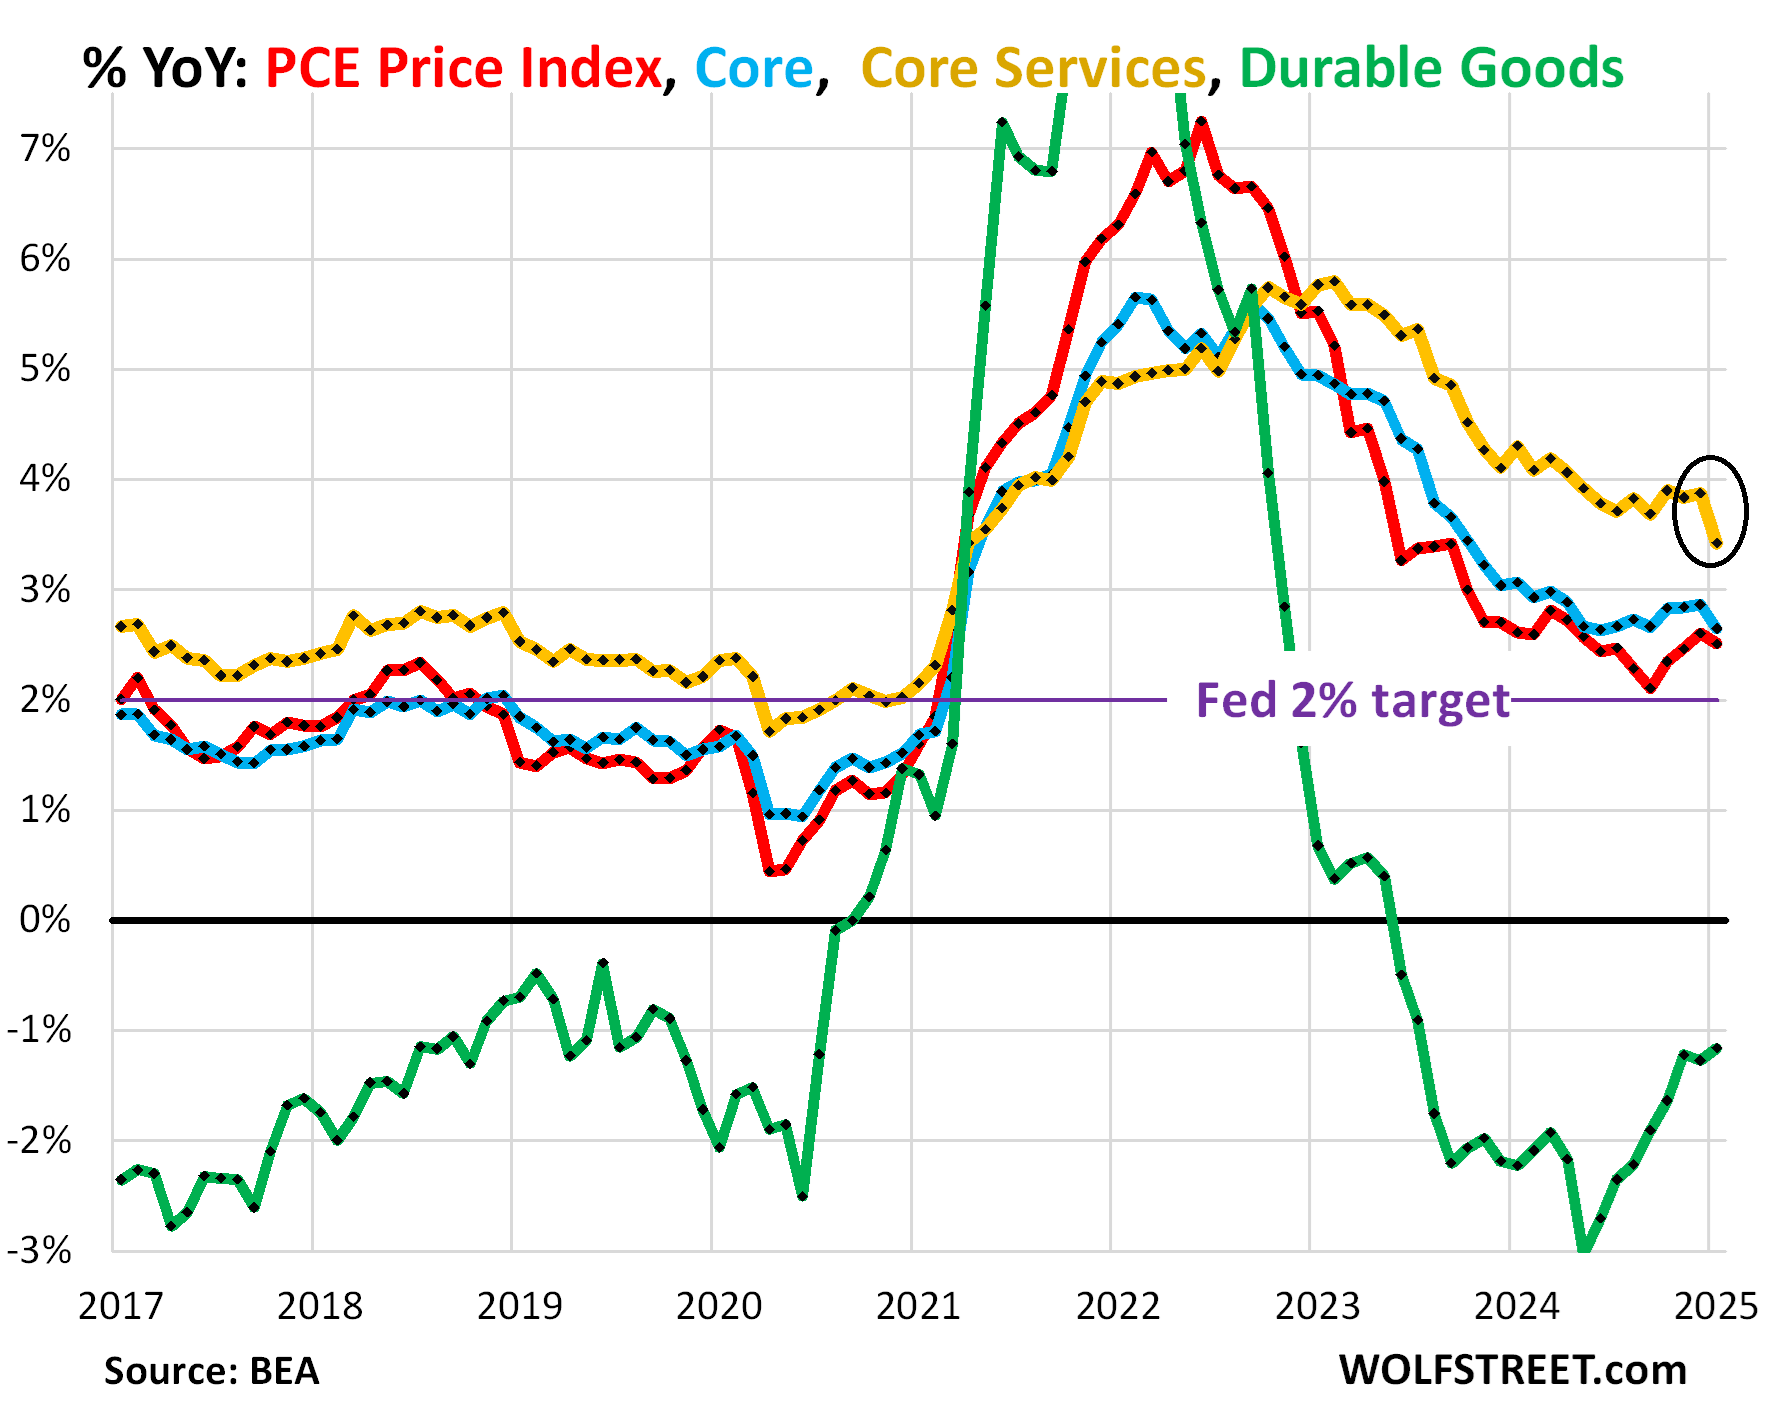
The PCE price index decelerated a tad to 2.51% in January, from 2.60% in December, after three months of acceleration. The Fed’s target for this measure is 2%.
The “core” PCE price index decelerated to 2.65% in January from 2.86% in December, which was rounded to 2.6% in January from the upwardly revised 2.9% in December (originally reported as 2.8%).
The “core services” PCE price index decelerated to 3.42% (see the base effect above), from the upwardly revised 3.87% in December.
The durable goods PCE price index became less negative, declining by 1.16% year-over-year in January, the smallest decline since July 2023.
The durable goods category is dominated by new and used vehicles, and includes appliances, furniture, computers, cellphones, other consumer electronics, sporting goods, such as bicycles, etc.
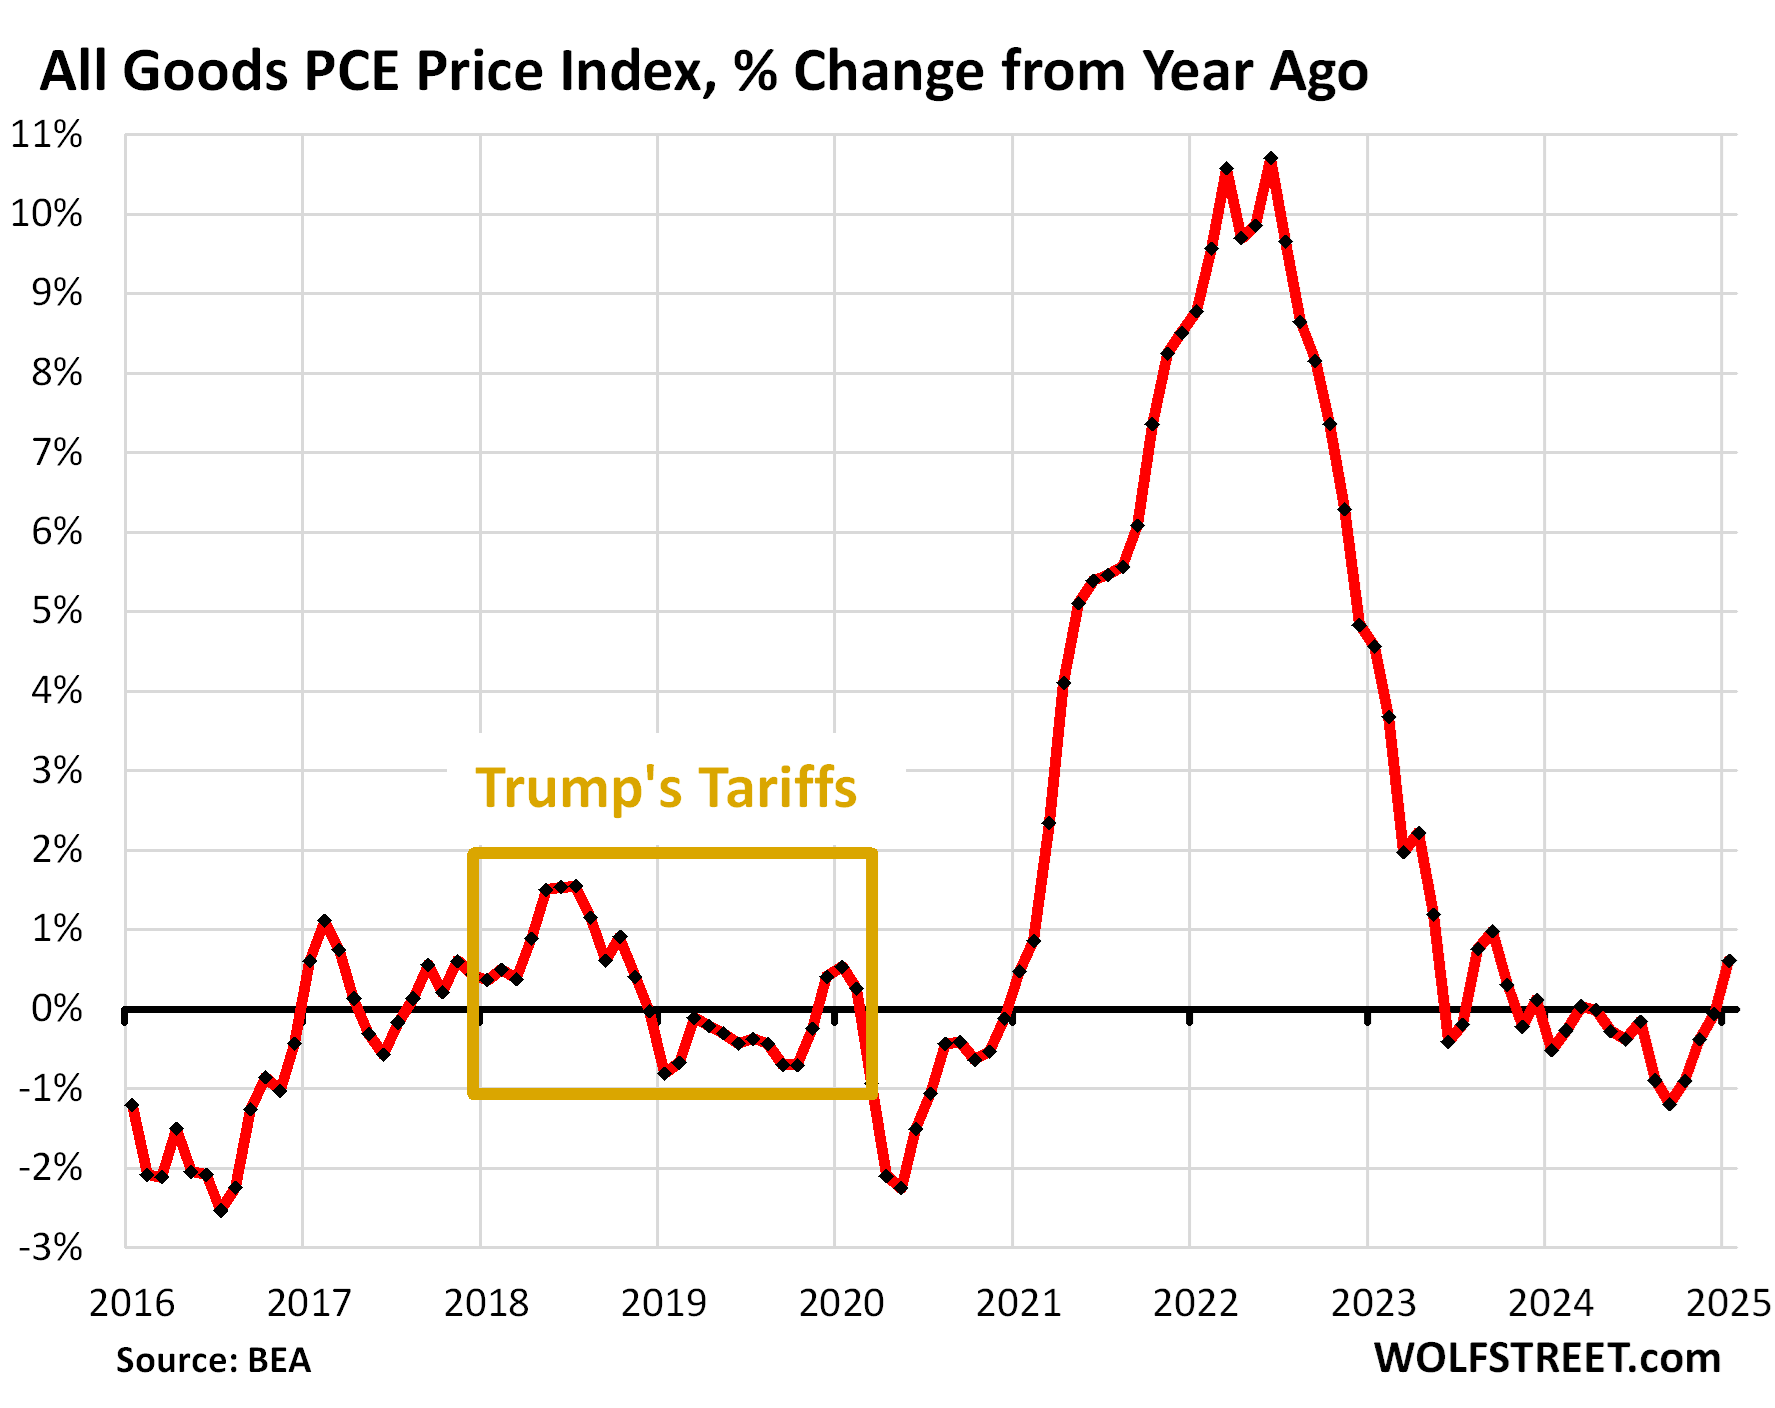
The all-goods price index.
The PCE Price index for all goods, including durable goods, apparel and shoes, food, energy products, household supplies, etc. jumped by 0.5% in January from December (6.2% annualized), the biggest month-to-month increase since August 2023.
Year-over-year, the goods index accelerated from negative readings to +0.6% in January, thereby becoming positive for the first time in a year. It was the biggest year-over-year increase since September 2023.
Year-over-year changes of major goods categories:
- Durable goods: -1.2%
- Food: +1.6%
- Energy products (dominated by gasoline): +0.4%
- Apparel & footwear: +1.1%
The gold box marked the period of Trump’s first round of tariffs. As we can see, companies overall were largely not able to pass them on to consumers, though they tried – creating wild and wooly headlines in the media – but consumers refused to buy those products with higher prices, and companies ended up rolling them back [we discussed this here: What Trump’s Tariffs Did Last Time (2018-2019): No Impact on Inflation, Doubled Receipts from Customs Duties, and Hit Stocks].
Note that the tariffs Trump is now talking about, and even those that were announced in January, have not hit the goods that consumers bought in January. Those goods, if imported, came into the US before January, before any new tariffs were implemented.
Enjoy reading WOLF STREET and want to support it? You can donate. I appreciate it immensely. Click on the mug to find out how:

![]()
I wonder, is there a measurable effect of business uncertainty about tariffs? I guess, as you indicated, last time the tariffs came largely out of corporate profits, percolating through in stock prices. Where are the fabled drunken sailors, to bail us out? Are they getting scarce? Buying the dip today maybe?
Hi all,
Based on the services dip in inflation with the January base effect the Fed will claim the job on inflation is going well downward. They can’t raise rates going forward. But now the market is concerned about growth scare. Let’s see what happens with that. Yields lower seem to happen bc of that
“Where are the fabled drunken sailors, to bail us out? Are they getting scarce?”
Seems to me like they’re still at it. Hot off the press:
No, Consumer Spending Didn’t Plunge in January and Auto Sales Didn’t Collapse, or Whatever, But the Huge Seasonal Adjustments Might Have Gone Awry.
Year-over-year, consumer spending jumped by 5.6% and retail sales by 4.8% in January. So there’s that.
Wolf,
Boy, the range of those sub-indexes it incredible – from -5% in Insurance to +15%. In Recreation…all in ostensibly the same economy.
As you point out, the base year effect (current changes sometimes a function of prior year changes) likely has a lot to do with it.
Still, it is hard to see how Recreation (one of first things tossed over side as economy turns to crud) had the leverage to make a 15% jump stick.
Makes me wonder if perhaps an “asking” vs. “actually paid” issue is at work *or* if the lack of transactional *volume* data is an issue.
That is, paid Recreation prices may have actually jumped 15% but the number of closed Recreation transactions fell 33% (see also, housing mkt…)
These month-to-month changes in the services sub-indices are super-volatile, going from big positive to big negative without batting an eyelash, so to speak. So don’t over-interpret the month-to-month changes of the sub-indices.
Here are recreation services. The chart goes from -5% to +13%, and it still cuts off some of the bottoms and tops of the month-to-month swings (blue). The six-month average is more meaningful (red):
Thanks! I think news sources are trying to take small and poorly-confused samples to further their pre-set, competing political narratives.
I really dislike the way the Federal Reserve uses PCEPI as its main benchmark, after switching to it from CPI in the 2000s.
The PCEPI is not a cost of living index, but a GDP deflator. It includes costs paid by consumers, businesses as well as governments, the last of which isn’t as price-sensitive. It’s distorted by quality adjustments & substitution effects. Shelter is only 10-15% which is far lower than the average middle class family spends on rent & mortgages.
As a result, PCE almost always runs lower than CPI, often by 0.5-1% for much of this cycle, so it gives the Federal Reserve a much easier target to reach.
Many other countries don’t have this distinct metric – their central banks just use CPI.
It’s interesting how the economy was booming during Q4 2024 when the Federal Reserve was lowering rates … but now that they’re on hold again due to still-elevated inflation, every CNBC & WSJ analyst is doom & gloom.
Seems to me like consumers are still at it. Hot off the press:
No, Consumer Spending Didn’t Plunge in January and Auto Sales Didn’t Collapse, or Whatever, But the Huge Seasonal Adjustments Might Have Gone Awry.
Year-over-year, consumer spending jumped by 5.6% and retail sales by 4.8% in January. So there’s that.
First few months of the year always seems to be higher… I’d still use the YoY. Positive news overall, but not optimistic of tariffs even if they didn’t lead to significantly higher inflation last time round.
Tariffs, unless compounded, as Wolf Richter has shown are not inflationary.
I hope President Trump did not overplay his hand sending Zelensky out of the White House with no Ukrainian mineral rights. The world stage is not the American public.
I think much of the US public is horrified and embarrassed. One GOP Senator has called Putin a war criminal who should be jailed.
When gopher Vance told Zelensky he was being disrespectful to Trump, he was being disrespectful to Ukraine. Zelensky is the Pres of Ukraine: according to diplomatic protocol, he ranks with Trump.
Much of the US public is sick of throwing good money after bad. We were so effective on the world stage from 2020 – 2024 weren’t we ?
Remember all the flak about the US withdrawal from Afghanistan. and how Biden got the blame when lo! the Taliban didn’t keep its word and kept attacking as the US troops were withdrawing?
Guess who crafted the deal to withdraw?
@Nick Kelly
Not defending anyone, but the Afghanistan withdrawal was almost 6 months into the Biden administration, that administration is fully responsible for how and when the withdrawal occurred, it doesn’t matter at all what the prior administration had planned.
And I don’t think most people have a problem with the idea of the withdrawal, we all thought it was well past time, it was the chaotic unplanned scrambling and abandonment of our allies that was so shameful.
One former GOP senator called Trump ‘Hitler’. So yes, they like to screech out sound bites…
Z is not the elected president at this point.
Seriously, watch the whole 40 minutes, not the last 10 minutes.
This is not really about personalities. This is about MONEY and the changing world order. This is a site about MONEY, not middle school mean girls fighting.
Russian FM Lavrov told SOS Rubio that the USA lost $300B when they pulled out of Russia, meaning thank you America for the free money. On top of the $350B we gave to Ukraine and whatever we give to the EU via NATO/USAID/Whatever.
Basically, the juice ain’t worth the squeeze anymore in Ukraine and the EU. I am sad that 1.1MM Ukrainians and 100K Russians were killed in this conflict, but not enough to put the USA at risk for the third fucking time over Europe. Yeah, USA isn’t innocent, but the USA has her interests.
Zelensky and the EU have their interests and now, their interests do not align with the US interests. Therefore, we are breaking up with you losers. Maybe, the EU will pull themselves together and become one of the multi-polar centers of power. Or, they will become rump states like Ukraine with a beggar’s cup in hand.
In a nutshell. Good luck making money. God Bless America.
Sounds like we will be going back to FDRs “Neutrality Rights” doctrine. I guess we may have to see whether the ocean is a better protector now than it was when Pearl Harbor was attacked. As someone else here posts often, may we live to see a better day.
Great job J Pow! 4 years now with inflation above your bogus and illegal 2% target. So much for “price stability”. Good thing you poured gasoline in the fire buying MBS. I wonder how many more years our dollars will lose value like this?
I could not agree more. Or as JPow and the Bailout Boys call this, Mission Accomplished!
In 2018, President Trump applied tariffs on primarily steel (25%) and aluminum (10%) and then used this as a bargaining chip to re-negotiate NAFTA into the USMCA to the benefit of America. I was on a Navy project in Canada and my oh my, we had some exciting ($) times as we used the specialized imported steel from the US!
This time is seems different with everything being tariffed and this impacts pretty much everyone. In 2018, one could hedge or shift the risk somewhat on steel, but most businesses are unfamiliar with hedging and are facing prices. I fear “demand destruction” which will slow economic growth at a time that many businesses are still trying to get their footing after Covid.
You need to get a list of the goods, including consumer goods, from China that were tariffed in 2018.
So here is the final list from the USTR, a 194-page PDF, of the goods imported from China that were tariffed in 2018.
https://ustr.gov/sites/default/files/enforcement/301Investigations/Tariff%20List-09.17.18.pdf
Refinancing wall is coming for many, starting in earnest the 2nd half. Trump admin needs and wants to get the 10 year down. Seems to me they want to slow the economy to do this. Just look at the actions; tariffs, Federal job cuts and spending cuts all anti growth in the near term. Trump said short term pain will need to be tolerated. When economy starts to roll over they will enact QE again, and inflation will come back stronger. Also, if China every gets out of its malaise, oil is going back up.
Seems businesses have gorged themselves and gouged consumers the last 5 years, everything has gone up and up and up. If you have not been around to notice it. I stand with Trump on ending the wars. We’ve already spent $15 trillion in the Middle East since the weapons of Mass Destruction Bush Jr, fiasco. Guaranteed the United States next big terrorist attack will come on American soil. We let too many people in with open borders and refugees who now stand in protest of where they live. The fight for Jerusalem been taking place since 1948 and it will never end. The most advanced cultures in Japan, China, and South Korea are light years ahead of the west in every aspect.
Breaking – like it or not, there is no wall, missile dome, or policy that will hermetically-seal off the U.S. from the headcount of the rest of the world and its angers/ambitions du jour any more than 1800’s Japan and China were able to resist incursion (and technological progress) from the West. Couple this with the existing, massive, mantle of the premier, and generally more-benign world empire the American people and its businesses happily(?) assumed after WWII (endeavoring to avoid future WW events), there will be no safe haven from the effects of those years in its divestiture, rhyming with the historical exhaustion of all empires…
may we all find a better day.
Higher for longer then? Good…what would be even better? Even Higher for longer? Perhaps slightly above inflation isn’t doing the trick if they are serious about getting back to 2% asap…
Then again any decent plans to try to tackle inflation in meaningful way might all just be go down the drain once toddler start to cry about lower interest rates again…probably while he confuses short and long term yield differences and causing more chaos…it will be an interesting ride for the next couple of years to be it extremely nicely.
Reading msm financial press one gets the sense this PCE report was benign and supports further Fed easing.
Wolfstreet gives the reader the more sober analysis which may or may not be in line with consensus. This time clearly it doesn’t and he is persuasive in his analysis.
I appreciate his work and plan to continue to financially support Wolf this year.
I have a feeling the president is hell bent on sinking the economy. He seems to be in a I don’t give a f mode with uncontrollable anger with the people around him terrified to go against him. A possible recipe for disaster. And he obviously is not sleeping well.
Wolf is a work horse. That’s why his stuff is worth reading.
gee the headline on my trading platform during the reflexive rally friday was ‘good PCE news bolsters stocks’. so does the monthly options unwind. and so do the artificially intelligent algorithms which can read moving averages. is inflation sticky, anecdotally gasoline in my area has been stuck on $5 for a long time (good or bad?) eggs have not. chicken on sale at 99 cents, gone forever, i think. whenever my store puts something on sale they always run out, but they do give rainchecks. US imports most of its food. should the fed cut interest rates (source of income to many) and inflation rises, then kiss your donkey goodbye.